Posts Tagged ‘MLS’
Thursday, February 3rd, 2022
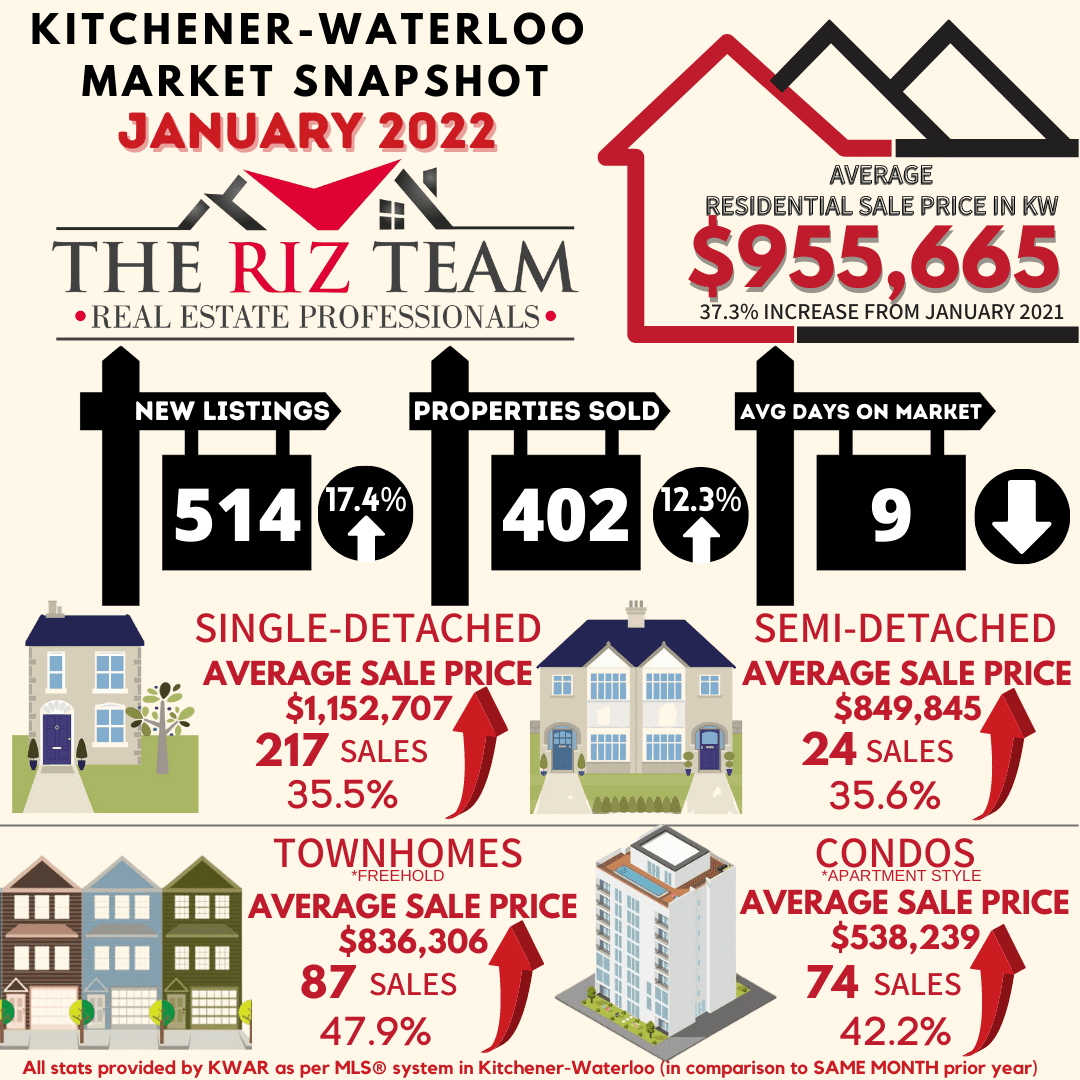
NUMBER OF HOME SALES IN JANUARY SET NEW RECORD
If you are considering to Sell your home or Buy a home in the next short while it would be highly beneficial for you to connect with one of our Team Agents at
The Riz Team
Do you want to know what your home is worth today? Click Below for our Online No Obligation Market Evaluation

PRICES CONTINUE TO ESCALATE
KITCHENER-WATERLOO, ON (Feb 3, 2022) –– The 402 residential homes sold last month through the Multiple Listing Service® (MLS® System) of the Kitchener-Waterloo Association of REALTORS® (KWAR), set a new record high for January. On a year-over-year basis January’s sales were up 12.3 per cent; compared to last month they were up 16.5 per cent. The previous ten-year average number of residential sales for January is 291.
“While it’s a new year, the song remains the same with homebuying demand outstripping supply in January,” said Megan Bell, President of KWAR. “This has resulted in price jumps across all property types.”
Total residential sales in January included 217 detached (up 4.8 per cent from January 2021), and 74 condominium units (up 1.4 per cent). Sales also included 24 semi-detached homes (up 14.3 per cent) and 87 townhouses (up 52.6 per cent).
In January, the average sale price for all residential properties in the Kitchener-Waterloo area was $955,665. This represents a 37.3 per cent increase over January 2021 and a 13.6 per cent increase compared to December 2021.
- The average price of a detached home was $1,152,707. This represents a 35.5 per cent increase from January 2021 and an increase of 12.9 per cent compared to December 2021.
- The average sale price for an apartment-style condominium was $538,239. This represents an increase of 42.2 per cent from January 2021 and an increase of 7.7 per cent compared to December 2021.
- The average sale price for a townhouse was $836,306. This represents a 47.9 per cent increase from January 2021 and an increase of 16.7 per cent compared to December 2021.
- The average sale price for a semi was $849,845. This represents an increase of 35.6 per cent compared to January 2021 and an increase of 10.3 per cent compared to December 2021.

KWAR cautions that average sale price information can be useful in establishing long-term trends but should not be used as an indicator that specific properties have increased or decreased in value. The MLS® Home Price Index (HPI) provides the best way to gauge price trends because averages are strongly distorted by changes in the mix of sales activity from one month to the next.
The MLS® HPI composite benchmark price for all residential properties in Kitchener-Waterloo was $924,900 in January. This represents a 37.1 per cent increase over January 2021 and a 8.6 per cent increase compared to December 2021.
- The benchmark price for a detached home was $1,038,200. This represents a 39.7 per cent increase from January 2021 and 9.8 per cent increase compared to December 2021.
- The benchmark price for an apartment-style condominium was $437,700. This represents a 25.9 per cent increase from January 2021 and a 6.1 per cent increase compared to December 2021.
- The benchmark price for a townhouse is $682,200. This represents a 40.7 per cent increase from January 2021 and a 6.1 per cent increase compared to December 2021.

Bell notes it is anticipated that the Bank of Canada will raise interest rates at their next scheduled announcement in mid-March. “I think we can expect over the course of the next few weeks, buyers who have yet to be priced out of the market will be looking to lock in a mortgage and scoop up any homes that come onto the market.”
There were 514 new listings added to the MLS® System in KW and area last month, an increase of 17.4 per cent compared to January of last year, and a 20.1 per cent decrease compared to the previous ten-year average for January.
The total number of homes available for sale in active status at the end of January was 174, a decrease of 22.0 per cent compared to January of last year, and 80.3 per cent below the previous ten-year average of 883 listings for January.
The number of months of inventory remained extremely low in January at 0.3. Inventory has been at half a month or less since July of 2021. The number of months of inventory represents how long it would take to sell off current inventories at the current rate of sales.
The average number of days to sell in January was 9 days, compared to 16 days in January 2021 and a previous 5-year average of 24 days.
Those requiring specific information on property values should contact a local REALTOR®. Working with a Realtor is the best way to get a complete picture of the property and community you are considering.
View our HPI tool here to learn more: https://kwar.ca/hpi-dashboard
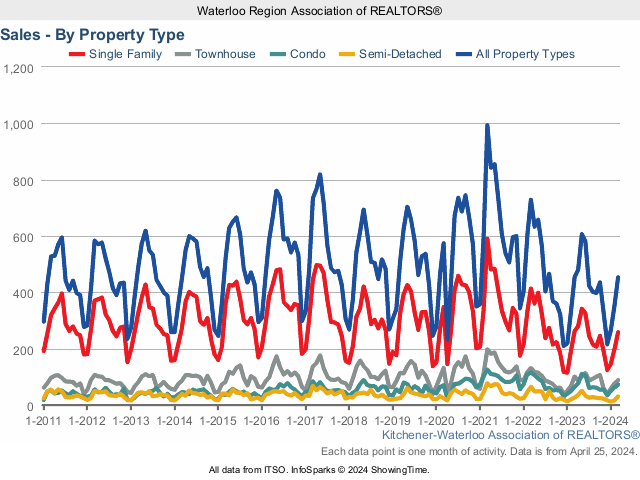
Historical Sales By Property Type

Months Supply of Homes for Sale

Historical Median Sales Price – By Property Type

Historical Average Sales Price – By Property Type

Average Days on Market

KWAR cautions that average sale price information can be useful in establishing long term trends but should not be used as an indicator that specific properties have increased or decreased in value. The average sale price is calculated based on the total dollar volume of all properties sold. Months Supply is the inventory of homes for sale at the end of a given month, divided by the average monthly closed sales from the last 12 months Those requiring specific information on property values should contact a local REALTOR®. REALTORS® have their fingers on the pulse of the market. They know the questions to ask, the areas to probe and what to look for so that you get a complete picture of the property and community you’re considering.
Tags: buyers, Homes For Sale, kitchener-waterloo, kitchener-waterloo association of realtors, KW Market Update, Market Update, MLS, Royal Lepage Wolle Realty, Waterloo Buyers, waterloo realtor, Waterloo Sellers
Posted in Kitchener Buyers, Kitchener Sellers, Market Stats, Market Update, Real Estate News, Realtor Tips, Waterloo Buyers, Waterloo Sellers | Comments Off on Kitchener-Waterloo Market Snapshot January 2022
Thursday, August 5th, 2021
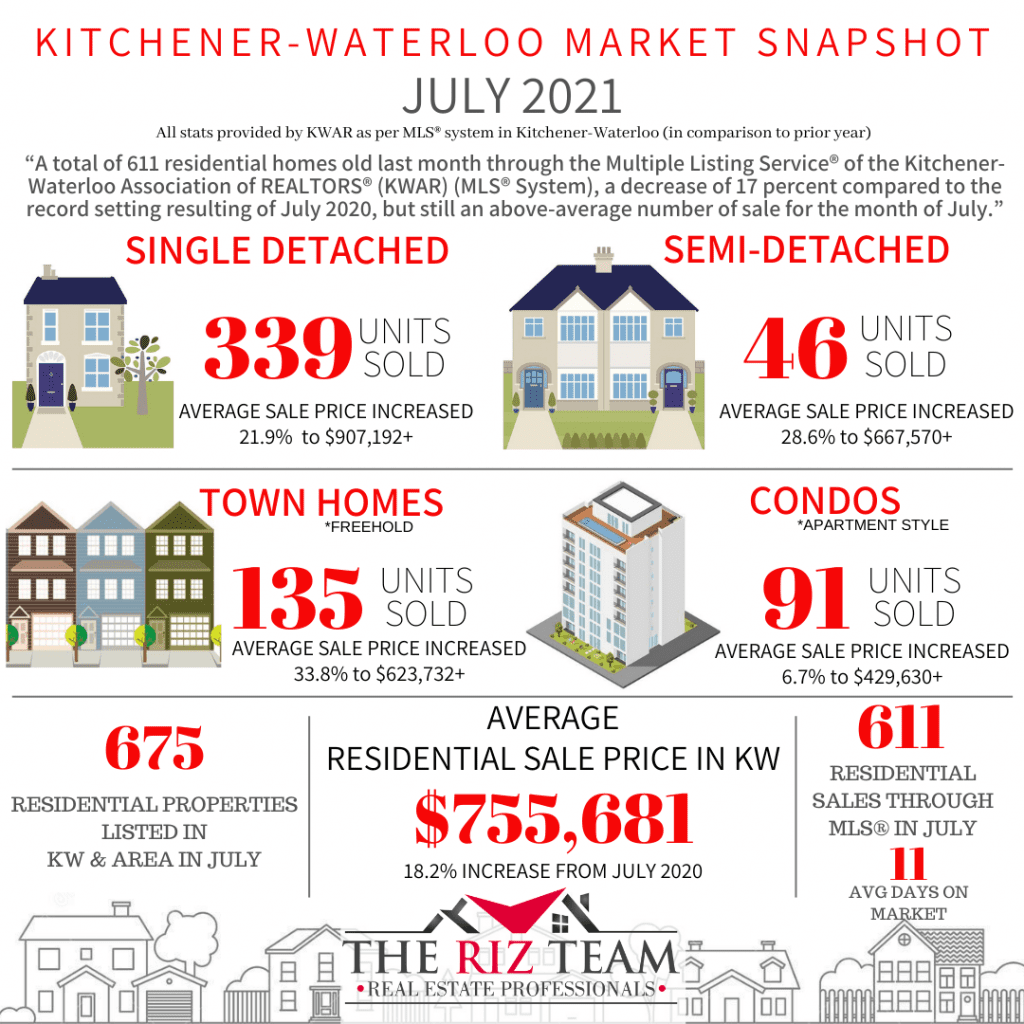
VERY LOW INVENTORY COMBINED WITH STRONG DEMAND KEEPS HOME PRICES HUMMING IN JULY
“Although home sales slowed down to some degree in July compared to June, overall demand remains very strong,” says Nicole Pohl, President of KWAR. “The current inventory of homes available for sale in the Kitchener-Waterloo and area is extremely low, making Waterloo Region one of the most competitive markets in Ontario.”
Total residential sales in July included 339 detached (down 27.1 per cent from July 2020), and 91 condominium units (up 30 per cent). Sales also included 46 semi-detached homes (down 4.2) and 135 townhouses (down 11.8 per cent).
In July, the average sale price for all residential properties in the Kitchener-Waterloo area was $755,681. This represents a 18.2 per cent increase over July 2020 and a 0.6 per cent decrease compared to June 2021.
-
-
- The average price of a detached home was $907,192. This represents a 21.9 per cent increase from July 2020 and a decrease of 1.4 per cent compared to June 2021.
-
- The average sale price for an apartment-style condominium was $429,630. This represents an increase of 6.7 per cent from July 2020 and a decrease of 3.6 per cent compared to June 2021.
-
- The average sale price for a townhouse was $623,732. This represents a 33.8 per cent increase from July 2020 and an increase of 5.4 per cent compared to June 2021.
-
- The average sale price for a semi was $667,570. This represents an increase of 28.6 per cent compared to July 2020 and an increase of 2.9 per cent compared to June 2021.

KWAR cautions that average sale price information can be useful in establishing long-term trends but should not be used as an indicator that specific properties have increased or decreased in value. The MLS® Home Price Index (HPI) provides the best way to gauge price trends because averages are strongly distorted by changes in the mix of sales activity from one month to the next.
The MLS® HPI composite benchmark price for all residential properties in Kitchener-Waterloo was $748,700 in July. This represents a 30.5 per cent increase over July 2020 and a 0.4 per cent increase compared to June 2021.
- The benchmark price for a detached home was $822,300. This represents a 31.1 per cent increase from July 2020 and 0.2 per cent increase compared to June 2021.
- The benchmark price for an apartment-style condominium was $385,900. This represents a 19.5 per cent increase from July 2020 and a 3.3 per cent increase compared to June 2021.
- The benchmark price for a townhouse is $564,500. This represents a 40 per cent increase from July 2020 and a 0.4 per cent decrease compared to June 2021.

“The housing market took a bit of a breather last month,” notes Pohl. “July is typically a quieter month with families taking vacation, and with the region coming out of lockdown there were certainly more staycations happening. But we do anticipate the market will pick up steam again and it will be another busy fall.”
There were 675 new listings added to the MLS® System in KW and area last month, a decrease of 24 per cent compared to July of last year, and a 14.4 per cent decrease compared to the previous ten-year average for July.
The total number of homes available for sale in active status at the end of July was 281, a decrease of 52.7 per cent compared to July of last year, and 79.1 per cent below the previous ten-year average of 1,346 listings for July.
The number of months of inventory was 0.4 in July, a decline from 0.5 months in June. Inventory has numbered less than 1 month since October. The number of months of inventory represents how long it would take to sell off current inventories at the current rate of sales.
The average number of days to sell in July was 11 days, compared to 17 days in July 2020 and a previous 5-year average of 22 days.
Those requiring specific information on property values should contact a local REALTOR®. Working with a Realtor is the best way to get a complete picture of the property and community you are considering.
View our HPI tool here to learn more: https://kwar.ca/hpi-dashboard
Historical Sales By Property Type

Months Supply of Homes for Sale

Historical Median Sales Price – By Property Type

Historical Average Sales Price – By Property Type

Average Days on Market

KWAR cautions that average sale price information can be useful in establishing long-term trends but should not be used as an indicator that specific properties have increased or decreased in value. The average sale price is calculated based on the total dollar volume of all properties sold. Months Supply is the inventory of homes for sale at the end of a given month, divided by the average monthly closed sales from the last 12 months Those requiring specific information on property values should contact a local REALTOR®. REALTORS® have their fingers on the pulse of the market. They know the questions to ask, the areas to probe and what to look for so that you get a complete picture of the property and community you’re considering.
Tags: Data, Home Sale, housing market, July, kitchener-waterloo, kitchener-waterloo real estate, kw, KW Real Estate, Market Data, MLS, MLS System, Ontario, real estate, realtor, waterloo
Posted in Enhance Your Home, Kitchener Buyers, Kitchener Sellers, Market Stats, Market Update, Real Estate News, Realtor Tips, Uncategorized, Waterloo Buyers, Waterloo Sellers | Comments Off on Kitchener-Waterloo Market Snapshot July 2021
Tuesday, July 6th, 2021
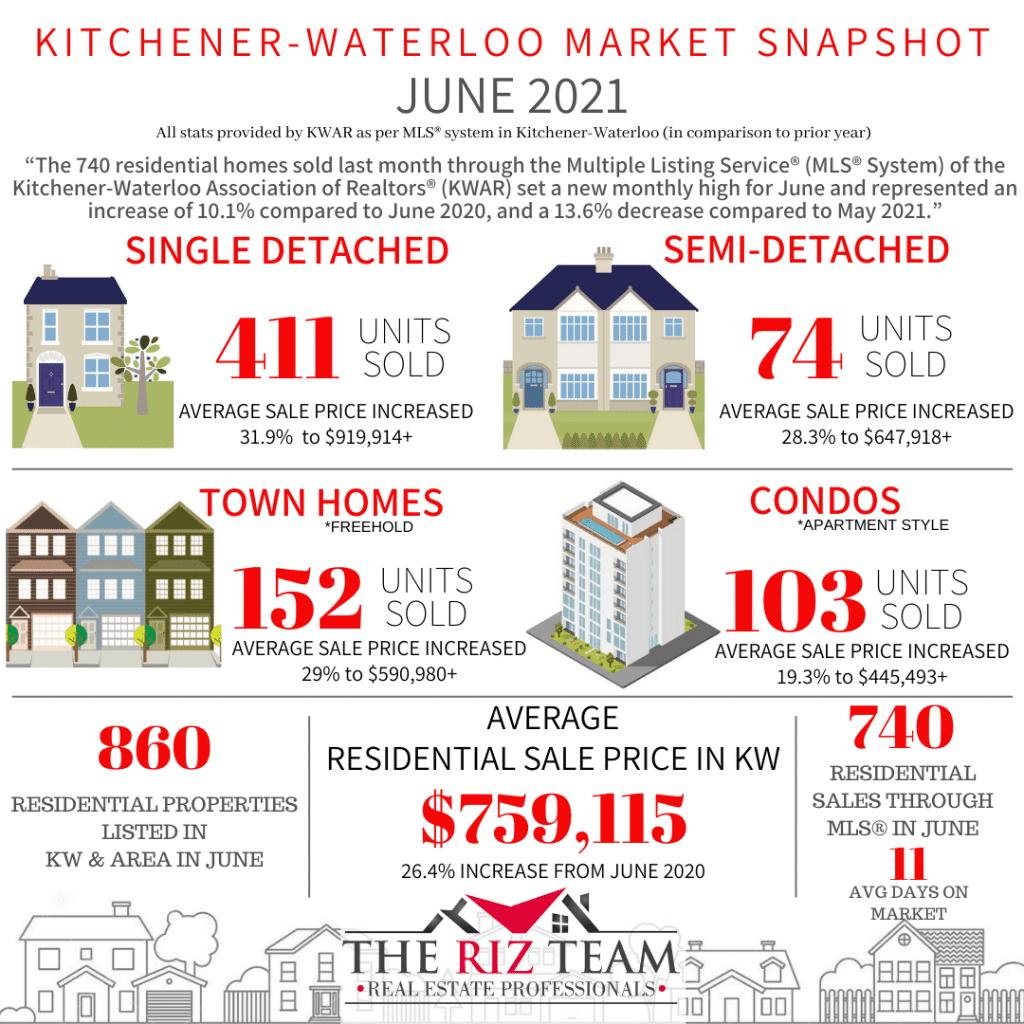
Number of Home Sales Set New June Record
KITCHENER-WATERLOO, ON (July 6, 2021) –– The 740 residential homes sold last month through the Multiple Listing Service® (MLS® System) of the Kitchener-Waterloo Association of REALTORS® (KWAR) set a new monthly high for June and represented an increase of 10.1 per cent compared to June 2020, and a 13.6 per cent decrease compared to May 2021.
“The number of homes sold in the Kitchener-Waterloo area these past 6 months surpasses any previous 6 months of activity through our MLS® System,” says Nicole Pohl, President of KWAR. “Since the beginning of the year, we have reported 4,393 home sales in Kitchener-Waterloo and area, which is remarkable.”
Total residential sales during this second quarter (April, May, June) are up 83.7 per cent compared to last year. On a year-to-date basis, they are up 65.7 per cent.
Total residential sales in June included 411 detached (down 0.2 per cent from June 2020), and 103 condominium units (up 51.5 per cent). Sales also included 74 semi-detached homes (on par) and 152 townhouses (up 14.3 per cent).
In June, the average sale price for all residential properties in the Kitchener-Waterloo area was $759,115. This represents a 26.4 per cent increase over June 2020 and a 2.6 per cent increase compared to May 2021.
-
-
- The average price of a detached home was $919,914. This represents a 31.9 per cent increase from June 2020 and an increase of 5.9 per cent compared to May 2021.
- The average sale price for an apartment-style condominium was $445,493. This represents an increase of 19.3 per cent from June 2020 and a decrease of 2.3 per cent compared to May 2021.
- The average sale price for a townhouse was $590,980. This represents a 29 per cent increase from June 2020 and a decrease of 1.9 per cent compared to May 2021.
- The average sale price for a semi was $647,918. This represents an increase of 28.3 per cent compared to June 2020 and a decrease of 1.8 per cent compared to May 2021.

KWAR cautions that average sale price information can be useful in establishing long-term trends but should not be used as an indicator that specific properties have increased or decreased in value. The MLS® Home Price Index (HPI) provides the best way to gauge price trends because averages are strongly distorted by changes in the mix of sales activity from one month to the next.
The MLS® HPI composite benchmark price for all residential properties in Kitchener-Waterloo was $745,800 in June. This represents a 32.1 per cent increase over June 2020 and a 0.4 per cent decrease compared to May 2021.
The benchmark price for a detached home was $820,800. This represents a 32.7 per cent increase from June 2020 and 0.6 per cent increase compared to May 2021.
-
-
- The benchmark price for an apartment-style condominium was $373,400. This represents a 17 per cent increase from June 2020 and a 0.1 per cent decrease compared to May 2021.
- The benchmark price for a townhouse is $566,900. This represents a 45 per cent increase from June 2020 and a 1.4 per cent decrease compared to May 2021.

“The greatest challenge of the housing market continues to be the limited supply of existing homes to purchase,” says Pohl. “What we could use right now is for more homes to get built to help meet the robust buyer demand which continues to exceed supply.”
There were 860 new listings added to the MLS® System in KW and area last month, a decrease of 6.6 per cent compared to June of last year, and a 5.4 per cent decrease compared to the previous ten-year average for June.
The total number of homes available for sale in active status at the end of June was 365, a decrease of 43 per cent compared to June of last year, and 73.9 per cent below the previous ten-year average of 1,400 listings for June.
The number of months of inventory was 0.5 in June, a decline from 0.7 months in May. Inventory has numbered less than 1 month since October. The number of months of inventory represents how long it would take to sell off current inventories at the current rate of sales.
The average number of days to sell in June was 11 days, compared to 17 days in June 2020 and a previous 5-year average of 20 days.
Those requiring specific information on property values should contact a local REALTOR®. Working with a Realtor is the best way to get a complete picture of the property and community you are considering.
View our HPI tool here to learn more: https://kwar.ca/hpi-dashboard
Historical Sales By Property Type

Months Supply of Homes for Sale

Historical Median Sales Price – By Property Type

Historical Average Sales Price – By Property Type

Average Days on Market Chart

Tags: Data, home sales, housing market, June, kitchener-waterloo, kitchener-waterloo association of realtors, kw, KW Real Estate, Market Data, MLS, MLS System, Ontario, real estate, realtor, Stats, waterloo
Posted in Kitchener Buyers, Kitchener Sellers, Market Stats, Market Update, Real Estate News, Waterloo Buyers, Waterloo Sellers | Comments Off on Kitchener-Waterloo Market Snapshot June 2021
Thursday, June 3rd, 2021

HOMES SALES CONTINUE TO SMASH RECORDS
KITCHENER-WATERLOO, ON (June 3, 2021) –– Strong home sales continued in May as the Kitchener-Waterloo Association of REALTORS® (KWAR) once again posted a record-setting number of monthly home sales. There were 854 residential homes sold through the Multiple Listing Service® (MLS® System) of KWAR last month, an increase of 100.9 per cent compared to May 2020, and a 0.9 per cent increase compared to April 2021.
“While last May home sales were restrained due to the pandemic, May 2021 was another extraordinary month of home buying and selling activity,” says Nicole Pohl, President of KWAR. “Prior to 2020, the previous 10-year average number of residential sales for May was 656.”
Total residential sales in May included 485 detached (up 85.8 per cent from May 2020), and 106 condominium units (up 152.4 per cent). Sales also included 74 semi-detached homes (up 72.1 per cent) and 188 townhouses (up 138 per cent).
In May, the average sale price for all residential properties in the Kitchener-Waterloo area was $740,103. This represents a 30.4 per cent increase over May 2020 and a 2.4 per cent decrease compared to April 2021.
-
-
- The average price of a detached home was $868,990. This represents a 32.6 per cent increase from May 2020 and a decrease of 3.4 per cent compared to April 2021.
- The average sale price for an apartment-style condominium was $457,935. This represents an increase of 38.6 per cent from May 2020 and an increase of 3.1 per cent compared to April 2021.
- The average sale price for a townhouse was $601,987. This represents a 33.7 per cent increase from May 2020 and a decrease of 1.8 per cent compared to April 2021.
- The average sale price for a semi was $659,975. This represents an increase of 36.8 per cent compared to May 2020 and an increase of 1.2 per cent compared to April 2021.
“Last month the market took a breath and calmed a bit, but there is still very strong demand throughout our region,” says Pohl. “This started prior to the new mortgage stress test that came into effect on June 1. While these changes will impact the affordability for some, I do not expect it to be very impactful due to the sheer number of buyers in our market.”
Average Sales Price – By Property Type

KWAR cautions that average sale price information can be useful in establishing long-term trends but should not be used as an indicator that specific properties have increased or decreased in value. The MLS® Home Price Index (HPI) provides the best way to gauge price trends because averages are strongly distorted by changes in the mix of sales activity from one month to the next.
The MLS® HPI composite benchmark price for all residential properties in Kitchener-Waterloo was $749,100 in May. This represents a 35.8 per cent increase over May 2020 and a 0.4 per cent increase compared to April 2021.
-
-
- The benchmark price for a detached home was $815,800. This represents a 35.8 per cent increase from May 2020 and 0.8 per cent decrease compared to April 2021.
- The benchmark price for an apartment-style condominium was $373,700. This represents a 16.9 per cent increase from May 2020 and a 2.1 per cent decrease compared to April 2021.
- The benchmark price for a townhouse is $574,900. This represents a 49 per cent increase from May 2020 and a 0.5 per cent decrease compared to April 2021.

There were 1,061 new listings added to the MLS® System in KW and area last month, an increase of 83.2 per cent compared to May of last year, and a 2.6 per cent increase compared to the previous ten-year average for May* (*calculated from 2010 to 2019 to adjust for the impact of the state of emergency on activity in May 2020).
The total number of homes available for sale in active status at the end of May was 448, a decrease of 20. per cent compared to May of last year, and 70.5 per cent below the previous ten-year average of 1,520 listings for May* (*calculated from 2010 to 2019 to adjust for the impact of the state of emergency on activity in May 2020).
The number of months of inventory was 0.7 in May, which is unchanged from April. Inventory has numbered less than 1 month since October. The number of months of inventory represents how long it would take to sell off current inventories at the current rate of sales.
The average number of days to sell in May was 9 days, compared to 21 days in May 2020 and a previous 5-year average of 20 days.
Those requiring specific information on property values should contact a local REALTOR®. Working with a Realtor is the best way to get a complete picture of the property and community you are considering.
View our HPI tool here to learn more: https://kwar.ca/hpi-dashboard
Historical Sales By Property Type

Months Supply of Homes for Sale

Historical Median Sales Price – By Property Type

Historical Average Sales Price – By Property Type

Average Days on Market Chart

KWAR cautions that average sale price information can be useful in establishing long term trends but should not be used as an indicator that specific properties have increased or decreased in value. The average sale price is calculated based on the total dollar volume of all properties sold. Months Supply is the inventory of homes for sale at the end of a given month, divided by the average monthly closed sales from the last 12 months Those requiring specific information on property values should contact a local REALTOR®. REALTORS® have their fingers on the pulse of the market. They know the questions to ask, the areas to probe and what to look for so that you get a complete picture of the property and community you’re considering.
Tags: Data, home sales, housing market, kitchener, kitchener-waterloo association of realtors, kw, KW Real Estate, KW Realtor, kwar, Market Data, May, MLS, MLS System, Ontario, real estate, realtor, statistics, Stats, waterloo, waterloo region
Posted in Uncategorized | Comments Off on Kitchener-Waterloo Market Snapshot May 2021
Tuesday, July 7th, 2020
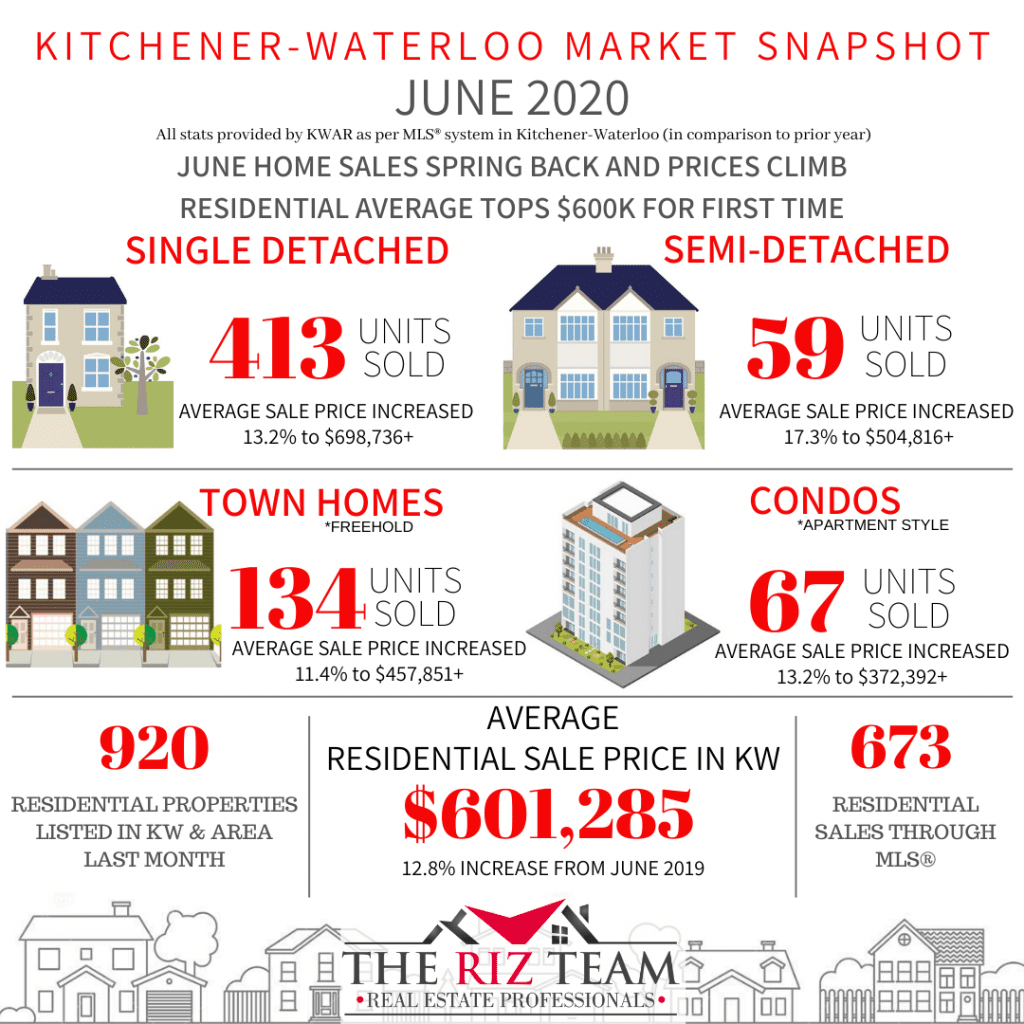
JUNE HOME SALES SPRING BACK AND PRICES CLIMB
RESIDENTIAL AVERAGE TOPS $600K FOR FIRST TIME
KITCHENER-WATERLOO, ON (July 6, 2020) ––The number of homes sold in June shot up 57.6 per cent compared to May. There were 673 residential homes sold through the Multiple Listing System (MLS® System) of the Kitchener-Waterloo Association of REALTORS® in June 2020, an increase of 2.1 per cent compared to June 2019, and an increase of 8.5 per cent compared to the previous 10-year average for June.
“After a pandemic-induced delay to the typical spring market, home sales sprung back to life in a big way in June,” said Colleen Koehler, President of KWAR. “As Waterloo region entered stage two of reopening, we saw many buyers and sellers resuming their home buying and selling plans.”
Total residential sales in June included 413 detached homes (up 1.7 per cent from June 2019), and 67 condominium apartments (up 36.7 per cent). Sales also included 134 townhouses (down 15.7 per cent) and 59 semi-detached homes (up 31.1 per cent).
Total residential sales during this second quarter (April, May, June) are down 33 per cent compared to last year. On a year-to-date basis, they are down 15.6 per cent.
“I expect for the remainder of 2020 will see the number of home sales returning to near historical levels,” says Koehler. “There will be some catching up to do in the coming weeks, but I don’t think you will see the market taking a hiatus this summer.”
The average sale price of all residential properties sold in June increased 12.8 per cent to $601,285 compared to the same month last year, while detached homes sold for an average price of $698,736 an increase of 13.2 per cent. During this same period, the average sale price for an apartment-style condominium was $372,392 for an increase of 13.2 per cent. Townhomes and semis sold for an average of $457,851 (up 11.4 per cent) and $504,816 (up 17.3 per cent) respectively.
The median price of all residential properties sold in June increased 14.4 per cent to $564,000 and the median price of a detached home during the same period increased 11.9 per cent to $650,000.
There were 920 new listings added to the MLS® System in KW and area last month, the most added in a single month since May of last year, and 1.9 per cent more than the previous ten-year average for June.
The total number of homes available for sale in active status at the end of June was 640, a decrease of 28.7 per cent compared to June of last year.
The number of Months Supply (also known as absorption rate) continues to be very low at just 1.4 months for the month of June, 22.2 per cent below the same period last year. The previous ten-year average supply of homes for June was 3.22 months, and in the past 5 years, the average supply for June was 2.22 months.
The average days to sell in June was 16 days, compared to 20 days in June 2019.
Koehler notes real estate was deemed an essential service from the beginning of the lockdown and REALTORS® have been taking all the necessary precautions to ensure transactions are done safely. KWAR’s president advises consumers to talk to their Realtor® about what measures they will be taking to protect your health and safety as they help you on your real estate journey.
Historical Sales By Property Type

Months Supply of Homes For Sale

Historical Median Sales Price – By Property Type

Historical Average Sales Price – By Property Type

Historical Sales – By Price Range

Average Days on Market

Tags: 2020, buyers, for sale, home sales, homes, Homes For Sale, June, kitchener, kitchener real estate, kitchener-waterloo, kitchener-waterloo association of realtors, KW Market Update, KW Realtor, Kwawesome, Market Report, Market Update, MLS, Ontario, real estate, Real Estate Board, real estate market, realtor, realtors, riz jadavji, royal lepage, Royal Lepage Wolle Realty, sales representative, Stats, Stats Release, Stats Report, the riz team, Top Team, waterloo, Waterloo Buyers, waterloo for sale, Waterloo Homes, waterloo real estate, waterloo realtor, waterloo region, Waterloo Sellers
Posted in Market Stats, Market Update | Comments Off on Kitchener Market Snapshot for June 2020
Tuesday, July 7th, 2015
What goes under foot is seldom an easy decision. Colour, surface texture, room usage and price all come into play. Today, greener options abound, adding to the myriad of choices already available.
Increasing interest in incorporating renewable resources into the home has resulted in many beautiful eco-friendly flooring options.
For homeowners looking on the greener side, it’s worth a look at the many sustainable products available today:
• Give a tree another lease on life with salvaged wood flooring. A rustic look can be created with reclaimed wood. Buying reclaimed lumber continues to get easier, and in some instances, less expensive relative to the cost of new hardwoods.
• Bamboo is a good option for rooms with low humidity. High abundance and a natural look make sustainable bamboo an attractive flooring option. Bamboo grows to maturity in three to five years, about a quarter of the time it takes to grow trees used for hardwood.
• Linoleum flooring has retained its popularity over decades. Unlike vinyl flooring, which is a synthetic product made of chlorinated petrochemicals, linoleum is manufactured from natural compounds including linseed oil, cork dust, tree resins and ground limestone. With natural, renewable elements used in its manufacturing, this eco-friendly flooring option continues to remain a popular option.
• Cork flooring has many eco-friendly attributes. Like bamboo, cork is quickly renewable. It is harvested from the bark of the cork oak tree and grows back every three years. Cork has anti-microbial properties to reduce allergens, is fire retardant and provides a comfortable feel under foot. Cork flooring can be finished in a variety of paints and stains to complement any room setting.
• Polyester (P.E.T.) Berber carpet is a sustainable option made of recycled plastic bottles. Anytime we can reuse these materials, we reduce the amount of new materials being manufactured and we reduce non-biodegradable materials in our landfills. Polyester Berber is spill resistant and comes in a variety of aesthetically – pleasing colours and patterns.
Whatever your home’s style or design, an eco-friendly flooring option exists to complement the desired look and existing patterns.
Tags: buyers, easy home improvement tips, for sale, home, home sales, home staging, Homes For Sale, house, housing, kitchener, Kitchener Buyers, kitchener for sale, Kitchener Homes, kitchener real estate, kitchener realtor, Kitchener Sellers, kitchener-waterloo, kitchener-waterloo association of realtors, kw, MLS, preparing to sell, real estate, real estate market, realtor, riz jadavji, Riz Sells KW, rizsellskw.com, royal lepage, Royal Lepage Wolle Realty, seller's tips, waterloo, waterloo real estate, waterloo realtor, Waterloo Sellers, www.rizsellskw.com
Posted in Enhance Your Home, For Sale, From The Riz Team, Kitchener Buyers, Kitchener Sellers, Real Estate Listings, Real Estate News, Realtor Tips, Uncategorized, Waterloo Buyers, Waterloo Sellers | Comments Off on Flooring choices on the greener side!
Thursday, March 7th, 2013
By Kitchener-Waterloo Association of REALTORS® (KWAR) admin •March 6th, 2013
KITCHENER-WATERLOO, ON (March 6, 2013) –– Residential sales through the Multiple Listing System (MLS®) of the Kitchener-Waterloo Association of REALTORS® (KWAR) were down 10.5 percent compared to this month last year while the year-to-date dollar volume of sales was 8 percent above the 5-year average.
A total of 445 residential properties sold last month, a 31.3 percent increase compared to January 2013. February’s residential sales included 297 detached homes (down 9.7 percent compared to February 2012) 81 condos (down 12.9 percent), 36 semis (up 5.9 percent), and 29 freehold townhouses (down 25.6 percent).
“Sales in February showed a healthy increase over January,” says Dietmar Sommerfeld, President of the KWAR. “The reduction in the number of sales on a year over year basis can be attributed to the tightened mortgage rules implemented by the government in mid-2012.”
The average sale price of all homes sold in February increased 5.4 percent to $324,998 from the same time last year. Single detached homes sold for an average price of $368,573, an increase of 5 percent compared to February 2012. Average sale prices for condos rose to $218,591, an 8.8 percent increase from last year and townhomes followed closely with an 8.3 percent bump putting the average selling price at $283,513.
“With continued low mortgage rates we expect a healthy spring market,” says Sommerfeld. “It remains an incredibly good time to buy or sell in our market.”
The KWAR cautions average sale price information can be useful in establishing long term trends, but should not be used as an indicator that specific properties have increased or decreased in value. The average sale price is based on the total dollar volume of all residential properties sold.
Consumers uncertain about current market conditions should work with a REALTOR® to develop an effective selling strategy. If you are buying, a REALTOR® will negotiate on your behalf and guide you through every step. A REALTOR® understands the local market and must, by law, look after your best interests.
{Source}
Tags: average, february, homes, housing, increase, kitchener, kitchener-waterloo association of realtors, MLS, price, real estate, realtor, residential sales, sales, statistics, trends, waterloo
Posted in Real Estate News, Realtor Tips | Comments Off on Kitchener-Waterloo Average Prices Up from January
Thursday, February 7th, 2013
By Kitchener-Waterloo Association of REALTORS® (KWAR) admin •February 6th, 2013
KITCHENER-WATERLOO, ON (February 5, 2013) –– Residential sales through the Multiple Listing Service (MLS® System) of the Kitchener-Waterloo Association of REALTORS® (KWAR) were down slightly in January compared to the same month last year.
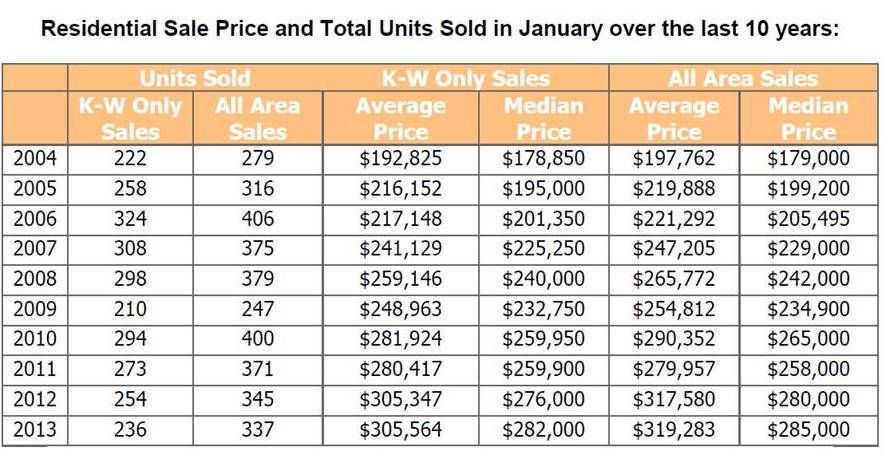
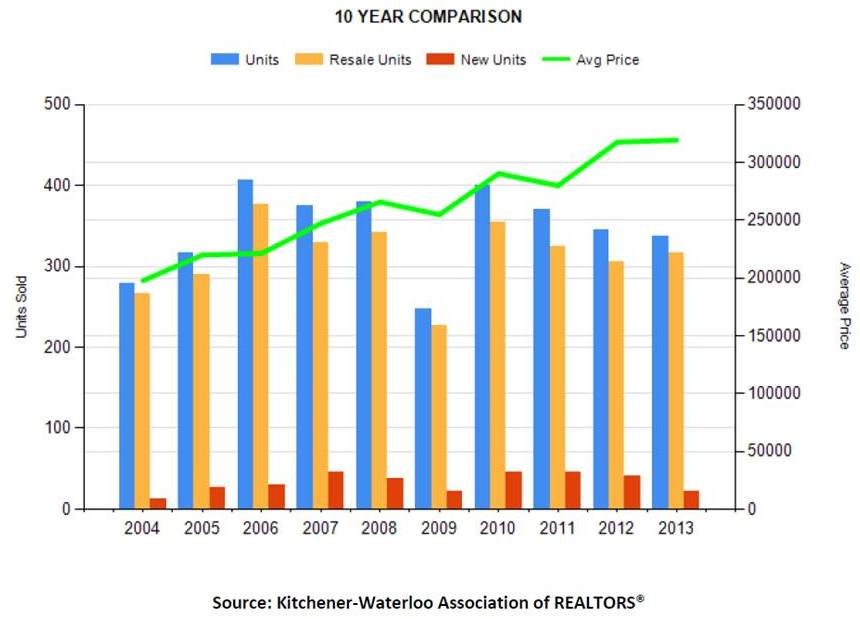
There were a total of 337 residential properties sold last month, a 2.3 percent decrease compared to the same month last year, and a 23.9 percent increase from December 2012.
“January’s sales were in line with the 10-year average for our area,” Dietmar Sommerfeld, President of the KWAR points out.
January’s residential sales included 237 detached homes (up 6.8 percent compared to January 2012) 49 condos (down 34.7 percent), 24 semis (up 14.3 percent), and 26 freehold townhouses (up 4 percent).
Residential sales between $250 and $349,999 were strong showing a 32 percent (157 vs. 119 units) increase compared to January last year.
The average sale price of all homes sold in January increased half a percent to $319,283 from the same time last year. Single detached homes sold for an average price of $354,540, a decrease of 2.6 percent compared to January 2012. In the condominium market the average sale price in January was $212,408, a 4.7 percent decrease compared to the same month a year ago.
The KWAR cautions average sale price information can be useful in establishing long term trends, but should not be used as an indicator that specific properties have increased or decreased in value. The average sale price is based on the total dollar volume of all residential properties sold.
Consumers uncertain about current market conditions should work with a REALTOR® to develop an effective selling strategy. If you are buying, a REALTOR® will negotiate on your behalf and guide you through every step. A REALTOR® understands the local market and must, by law, look after your best interests.

{Source}
Tags: homes, housing, kitchener, kitchener-waterloo association of realtors, MLS, real estate, realtor, residential sales, statistics, trends, waterloo
Posted in Real Estate News, Realtor Tips | Comments Off on Kitchener-Waterloo Home Sales Maintain Steady Pace
Monday, January 7th, 2013
By Kitchener-Waterloo Association of REALTORS® (KWAR) admin •January 4th, 2013
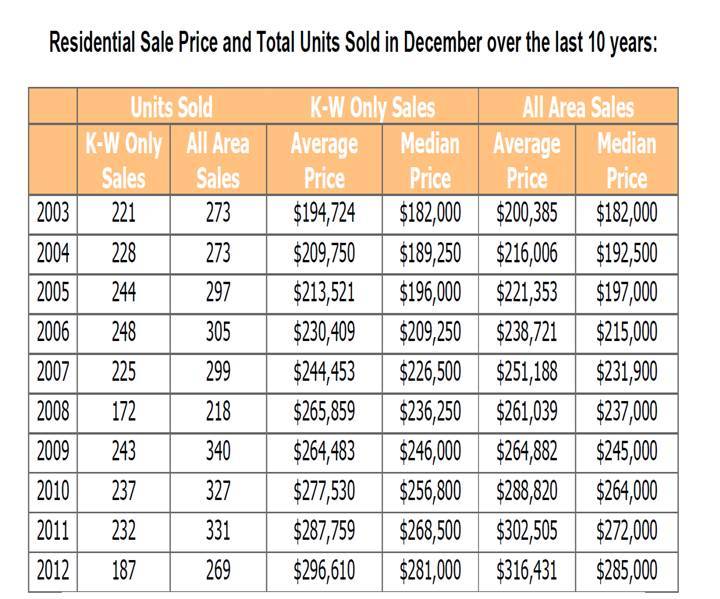
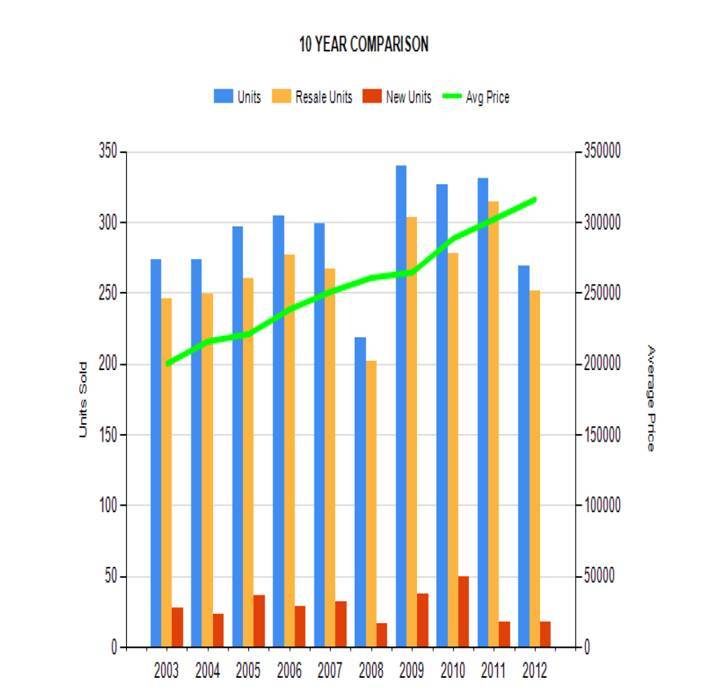
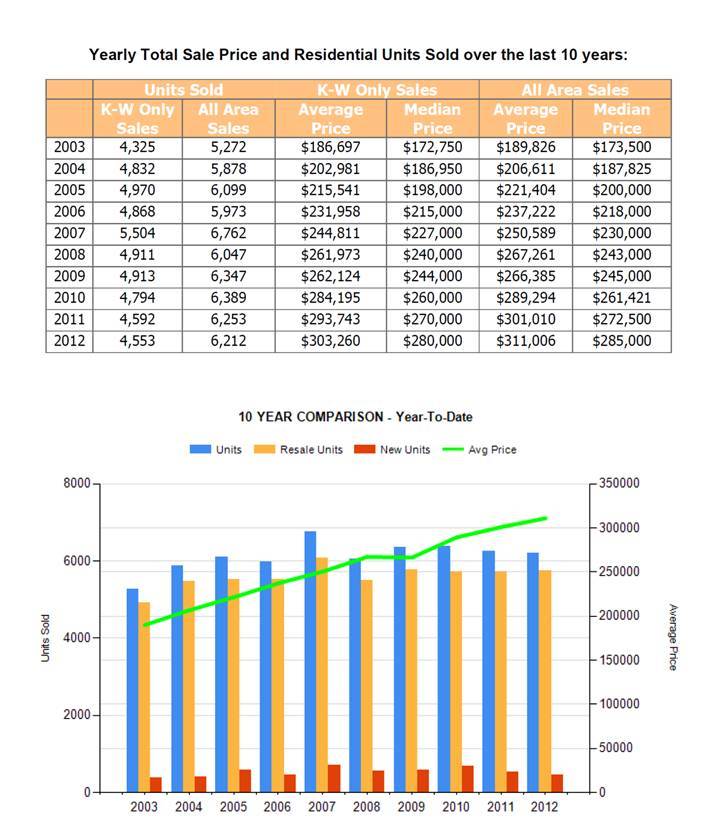
KITCHENER-WATERLOO, ON (January 4, 2013) –– There were a total of 6,212 residential sales through the Multiple Listing System (MLS®) of the Kitchener-Waterloo Association of REALTORS® (KWAR) in 2012, a slight decline of 0.7 percent compared to 2011’s year-end results.
Coming off two consecutive months of strong housing activity in October and November, fourth quarter home sales were practically on par with last year’s results. A total of 1,268 homes sold through the last 3 months of 2012, 6 transactions more than the same period in 2011.
Dollar volume of all residential real estate sold last year increased 2.6 percent to $ 1,931,345,147 compared with 2011, reflecting the steady price gains realized in 2012.
The average sale price of all homes sold in 2012 increased 3.3 percent to $311,006. Single detached homes sold for an average price of $353,888 in 2012, an increase of 3.2 percent. In the condominium market the average sale price in 2012 was $213,520, a 4 percent increase compared to the previous year.
“Residential sales activity remained fairly steady throughout 2012,” says Dietmar Sommerfeld, president of the KWAR. “In July the government put in place tighter mortgage lending rules, which is perhaps partly responsible for the slight easing of demand we saw, but overall the Kitchener-Waterloo housing market continues to show its stability.”
Home sales in 2012 included 4,070 detached homes (down 1.2 percent from 2011), 1,200 condos (down 0.1 percent) 486 semis (down 2.4 percent), and 400 townhouses (up 7.8 percent).
Sommerfeld says that Waterloo region benefits from a very diverse and dynamic economy that will continue to support a healthy housing market and consumer appetite for home ownership in 2012.
The KWAR cautions average sale price information can be useful in establishing long term trends, but should not be used as an indicator that specific properties have increased or decreased in value. The average sale price is based on the total dollar volume of all residential properties sold.
Consumers uncertain about current market conditions should work with a REALTOR® to develop an effective selling strategy. If you are buying, a REALTOR® will negotiate on your behalf and guide you through every step. A REALTOR® understands the local market and must, by law, look after your best interests.

{Source}
Tags: 2012, average price, homes, housing, kitchener, kitchener-waterloo association of realtors, MLS, real estate, realtor, residential, sale, sales, waterloo, year
Posted in Real Estate News, Realtor Tips, Uncategorized | Comments Off on Home Sales In Kitchener-Waterloo Steady In 2012
Monday, December 17th, 2012
The Canadian Real Estate Association is forecasting that house sales will decline two per cent in 2013
The Canadian Press Mon Dec 17 2012 11:49:00
OTTAWA – The Canadian Real Estate Association cut its sales forecast for this year and next on Monday as it said slower sales in the wake of tighter lending rules this summer have remained.
The industry association said now expects home sales this year to slip 0.5 per cent compared with 2011 to about 456,300.
That compared with a forecast in September that called for sales this year to rise 1.9 per cent to 466,900 units.
The association also said it now expects sales next year to drop two per cent to 447,400 compared with earlier expectations for a drop of 1.9 per cent to 457,800 in 2013.
“Annual sales in 2012 reflect a stronger profile prior to recent mortgage rule changes followed by weaker activity following their implementation,” said Gregory Klump, the association’s chief economist.
“By contrast, forecast sales in 2013 reflect an improvement from levels this summer in the immediate wake of mortgage rule changes. Even so, sales in most provinces next year are expected to remain down from levels posted prior to the most recent changes to mortgage regulations.”
Finance Minister Jim Flaherty moved in July to tighten mortgage rules for the fourth time in as many years in order to discourage those most at risk of becoming over-leveraged. Flaherty made mortgage payments more expensive by dropping the maximum amortization period to 25 years.
The association said the average price for 2012 is expected to be $363,900, up 0.3 per cent compared with a September forecast of $365,000, up 0.6 per cent.
For 2013, the association said it expects prices to gain 0.3 per cent to average $365,100. That compared with earlier expectations of a drop of one tenth of one per cent to $364,500 in 2013.
The downgrade for the outlook for the year came as home sales edged down 1.7 per cent month over month in November and were back where they stood in August.
The decrease followed a drop of about one-tenth of a per cent in September.
Actual, or non-seasonally adjusted sales, were down 11.9 per cent from November 2011 while the national average home price in November was $356,687, off 0.8 per cent from November 2011.
Sales were down on a year-over-year basis in three of every four of all local markets in November, including most large urban centres. Calgary stood out as an exception, with sales up 10.6 per cent from a year ago.
Kitchener and Waterloo also recorded a sales increase in November, with sales rising 7.3 per cent. Sales in Cambridge fell 14 per cent.
Toronto, Montreal and Vancouver contributed most to the small decline at the national level.
A total of 432,861 homes have traded hands over the MLS system so far this year, down 0.2 per cent from levels reported over the first 11 months of 2011 and 0.8 per cent below the 10-year average for the period.
The MLS Home Price Index, which is not affected changes in the mix of sales, showed prices up 3.5 per cent nationally on a year-over-year basis in November.
However, it was the seventh consecutive month in which the year-over-year gain shrank and marked the slowest rate of increase since May 2011.
The MLS HPI rose fastest in Regina, up 11.6 per cent year over year in November, though down from 13 per cent in November.
Among other markets, the HPI was up 4.6 per cent year over year in Toronto, 1.9 per cent in Montreal and 7.1 per cent in Calgary. In Greater Vancouver, the HPI was down 1.7 per cent year over year.
{Source}
Tags: canada, canadian real estate association, home sales. mortgage, MLS, mortgage regulations, real estate, real estate market, sales
Posted in Economy, Magazine Articles, Real Estate News, Realtor Tips | Comments Off on Real Estate Association Cuts Canadian Home Sales Forecast for 2012 and 2013