Kitchener Waterloo Market Snapshot June 2022
Wednesday, July 6th, 2022HOME PRICES CONTINUE TO DIP AS MONTHS SUPPLY RETURNS TO PRE-PANDEMIC LEVEL
If you are considering to Sell your home or Buy a home in the next short while it would be highly beneficial for you to connect with one of our Team Agents at
The Riz Team
Do you want to know what your home is worth today? Click Below for our Online No Obligation Market Evaluation

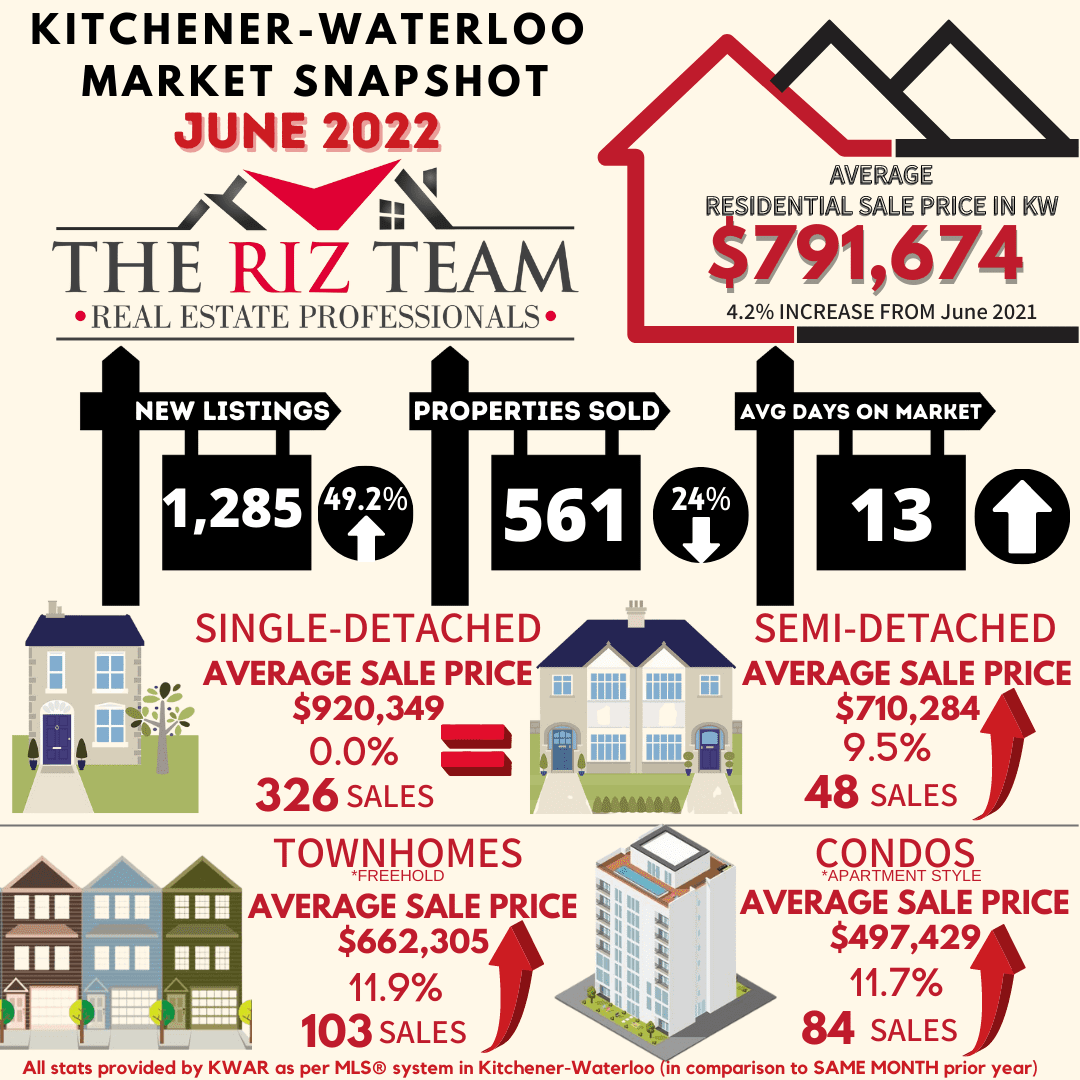
The Riz Team monthly market stats June 2022. Kitchener Waterloo, ON.
There were 561 residential homes sold through the Multiple Listing Service® System (MLS® System) of the Kitchener-Waterloo Association of REALTORS® (KWAR) in June, a decrease of 24.0 per cent compared to the same month last year, and 17.3 per cent below the previous 5-year average. “For the fourth consecutive month we’re seeing home prices moderate as the number of properties available for sale has steadily increased” says Megan Bell, President of KWAR. “In June the average price of a detached home has levelled off to where it was this time last year.”
Total residential sales in June included 326 detached (down 20.7 per cent from June 2021), and 103 townhouses (down 32.2 per cent). Sales also included 84 condominium units (down 18.4 per cent) and 48 semi-detached homes (down 33.3 per cent).
In June, the average sale price for all residential properties in the Kitchener-Waterloo area was $791,674. This represents a 4.2 per cent increase over June 2021 and a 9.6 per cent decrease compared to May 2022.
- The average price of a detached home was $920,349. This represents a 0.0 per cent change from June 2021 and a decrease 9.5 per cent compared to May 2022.
- The average sale price for a townhouse was $662,305. This represents a 11.9 per cent increase from June 2021 and a decrease of 6.5 per cent compared to May 2022.
- The average sale price for an apartment-style condominium was $497,429. This represents an increase of 11.7 per cent from June 2021 and a decrease of 8.9 per cent compared to May 2022.
- The average sale price for a semi was $710,284. This represents an increase of 9.5 per cent compared to June 2021 and a decrease of 2.8 per cent compared to May 2022.

KWAR cautions that average sale price information can be useful in establishing long-term trends but should not be used as an indicator that specific properties have increased or decreased in value. The MLS® Home Price Index (HPI) provides the best way to gauge price trends because averages are strongly distorted by changes in the mix of sales activity from one month to the next.
The MLS® HPI composite benchmark price for all residential properties in Kitchener-Waterloo was $790,600 in June. This represents a 6.8 per cent increase over June 2021 and a 6.8 per cent decrease compared to May 2022.
- The benchmark price for a detached home was $876,600. This represents a 5.3 per cent increase from June 2021 and 7.3 per cent decrease compared to May 2022.
- The benchmark price for a townhouse is $676,900. This represents a 15.8 per cent increase from June 2021 and a 7.1 per cent decrease compared to May 2022.
- The benchmark price for an apartment-style condominium was $537,100. This represents a 24.2 per cent increase from June 2021 and a 2.4 per cent decrease compared to May 2022.

“This time last year, sales were going through the roof,” says Bell. “The home buying scene is a little different this year with folks finally taking their postponed trips, attending weddings, and generally catching up on the many missed occasions of the past two years.” Of course, recent hikes in mortgage rates are also contributing to sales cooling, notes KWAR’s president.
“While any shift in the market will result in some individuals predicting the worse, the simple reality is that the market we had been in was unsustainable,” says Bell. “What this means for buyers is more inventory, more choices, and perhaps most importantly, potentially less stress when purchasing. For sellers, they need to ensure their properties stand out from the competition and be aware it may take more time to sell their home and for potentially less money than they were expecting.”
There were 1,285 new listings added to the MLS® System in KW and area last month, an increase of 49.2 per cent compared to June of last year, and a 41.7 per cent increase compared to the previous ten-year average for June.
The total number of homes available for sale in active status at the end of June was 991, an increase of 165.0 per cent compared to June of last year, and 20.6 per cent below the previous ten-year average of 1249 listings for June.
The number of months of inventory increased to 1.8 months in June from 1.6 months in May. While inventory is still at historic lows, this is the highest it’s been since September 2019 and a return to where inventory was in the pre-pandemic June of 2019. The number of months of inventory represents how long it would take to sell off current inventories at the current rate of sales.
The average number of days to sell in June was 13 days, compared to 11 days in June 2021. The previous 5-year average is 17 days.
Those requiring specific information on property values should contact a local REALTOR®. Working with a Realtor is the best way to get a complete picture of the property and community you are considering.
View our HPI tool here to learn more: https://kwar.ca/hpi-dashboard
Historical Sales By Property Type

Months Supply of Homes for Sale

Historical Median Sales Price – By Property Type

Historical Average Sales Price – By Property Type


KWAR cautions that average sale price information can be useful in establishing long term trends but should not be used as an indicator that specific properties have increased or decreased in value. The average sale price is calculated based on the total dollar volume of all properties sold. Months Supply is the inventory of homes for sale at the end of a given month, divided by the average monthly closed sales from the last 12 months Those requiring specific information on property values should contact a local REALTOR®. REALTORS® have their fingers on the pulse of the market. They know the questions to ask, the areas to probe and what to look for so that you get a complete picture of the property and community you’re considering.