Kitchener Waterloo Market Snapshot August 2023
Wednesday, September 6th, 2023Soft Home Sales in August Coupled with Strong Listing Activity
If you are considering to Sell your home or Buy a home in the next short while it would be highly beneficial for you to connect with one of our Team Agents at
The Riz Team
Do you want to know what your home is worth today? Click Below for our Online No Obligation Market Evaluation
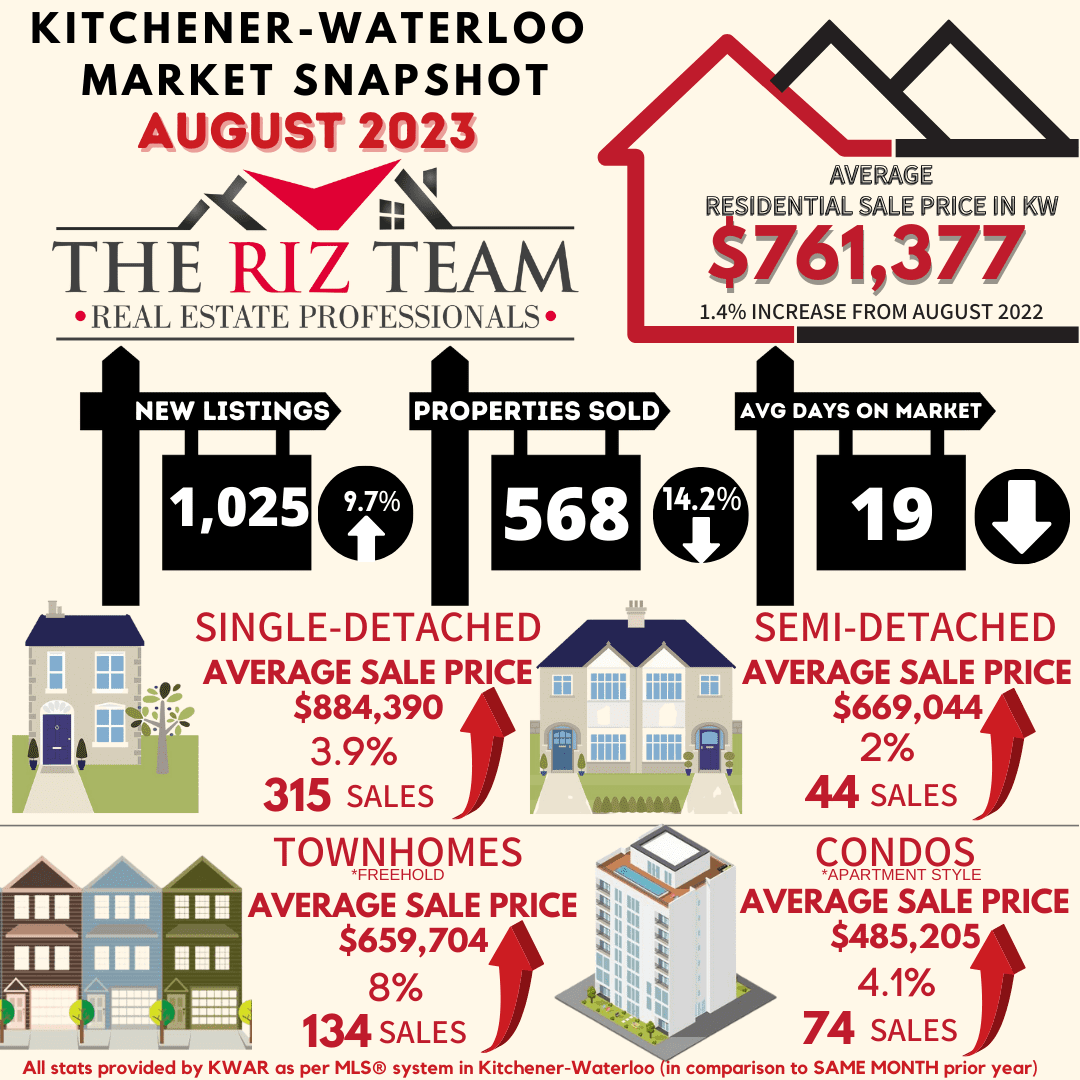
WATERLOO REGION, ON (September 6, 2023) — In August, there were 568 homes sold through the Multiple Listing Service® (MLS®) System of the Waterloo Region Association of REALTORS® (WRAR), representing a decrease of 14.2 per cent compared to the previous year and a decline of 23.5 per cent compared to the previous 5-year average for the month.
“For the first time in a decade we saw August’s home sales slip under the 600-unit mark,” says Megan Bell, president of WRAR.” “Home sales were softer than normal last month, which is not surprising given the current borrowing environment.”
Total residential sales in August included 315 detached (down 24.1 per cent from August 2022), and 134 townhouses (up 12.6 per cent). Sales also included 74 condominium units (up 10.4 per cent) and 44 semi-detached homes (down 27.9 per cent).
In August, the average sale price for all residential properties in Waterloo Region was $761,377. This represents a 1.4 per cent increase compared to August 2022 and a 4.4 per cent decrease compared to July 2023.
- The average price of a detached home was $884,390. This represents a 3.9 per cent increase from August 2022 and a decrease of 3.9 per cent compared to July 2023.
- The average sale price for a townhouse was $659,704. This represents a 8.0 per cent increase from August 2022 and a decrease of 1.7 per cent compared to July 2023.
- The average sale price for an apartment-style condominium was $485,205. This represents an increase of 4.1 per cent from August 2022 and a decrease of 2.3 per cent compared to July 2023.
- The average sale price for a semi was $669,044. This represents an increase of 2.0 per cent compared to August 2022 and a decrease of 0.3 per cent compared to July 2023.
WRAR cautions that average sale price information can be useful in establishing long-term trends but should not be used as an indicator that specific properties have increased or decreased in value. The MLS® Home Price Index (HPI) provides the best way to gauge price trends because averages are strongly distorted by changes in the mix of sales activity from one month to the next.

MLS® Home Price Index Benchmark Price |
||||||
| Kitchener-Waterloo | Cambridge | |||||
| Benchmark Type: | August 2023 | Monthly % Change | Yr./Yr. % Change | August 2023 | Monthly % Change | Yr./Yr. % Change |
| Composite | $745,100 | -2.6 | 1.1 | $758,000 | -0.9 | 1.4 |
| Detached | $846,900 | -2.5 | 3.3 | $788,100 | -1.1 | 3.3 |
| Townhouse | $634,900 | -2.1 | 1.4 | $669,300 | 0.9 | -5.5 |
| Apartment | $475,400 | -2.0 | -5.2 | $501,000 | 1.7 | -12.4 |

“Home buyers had the advantage of strong listing activity in August, which helped to provide a little more choice and temper prices,” says Bell. “But affordability remains a top concern for many who are looking to get into the market and finding it a challenge to resolve what they want with what they can afford.”
WRAR’s president points out that while market-wide, inventory levels were up 7.6 per cent in August, this was mainly due to the Townhouse/Condo segment, where inventory increased by 35.3 per cent. The property type with the most supply in the market is the condo segment with 3.3 months supply, compared to 1.8 months supply in the detached home category.
“Right now, buyers may find it easier to get into a condominium, which can be a great choice for both first time buyers, and anyone looking for a lifestyle change.”
There were 1,025 new listings added to the MLS® System in Waterloo Region last month, an increase of 9.7 per cent compared to August of last year and a 11.7 per cent increase compared to the previous ten-year average for August.
The total number of homes available for sale in active status at the end of August was 1,094, an increase of 7.6 per cent compared to August of last year and 14.9 per cent below the previous ten-year average of 1431 listings for August.
There were 2.0 months of inventory at the end of August, unchanged from the end of July and in line with the previous 10-year average. The number of months of inventory represents how long it would take to sell off current inventories at the current sales rate.
The average number of days to sell in August was 19, compared to 23 days in August 2022. The previous 5-year average is 21 days.
View our HPI tool here to learn more: https://wrar.ca/hpi/
Click on any of the graphs below for an interactive view.


Tags: for sale, home sales, Kitchener Buyers, kitchener real estate, kitchener-waterloo, Royal Lepage Wolle Realty, the riz team, waterloo, Waterloo Buyers, waterloo for sale, Waterloo Homes, waterloo real estate, waterloo realtor, Waterloo Sellers
Posted in Kitchener Buyers, Kitchener Sellers, Market Stats, Market Update, Real Estate News, Realtor Tips, Waterloo Buyers, Waterloo Sellers | Comments Off on Kitchener Waterloo Market Snapshot August 2023