Kitchener-Waterloo Market Snapshot April 2021
Wednesday, May 5th, 2021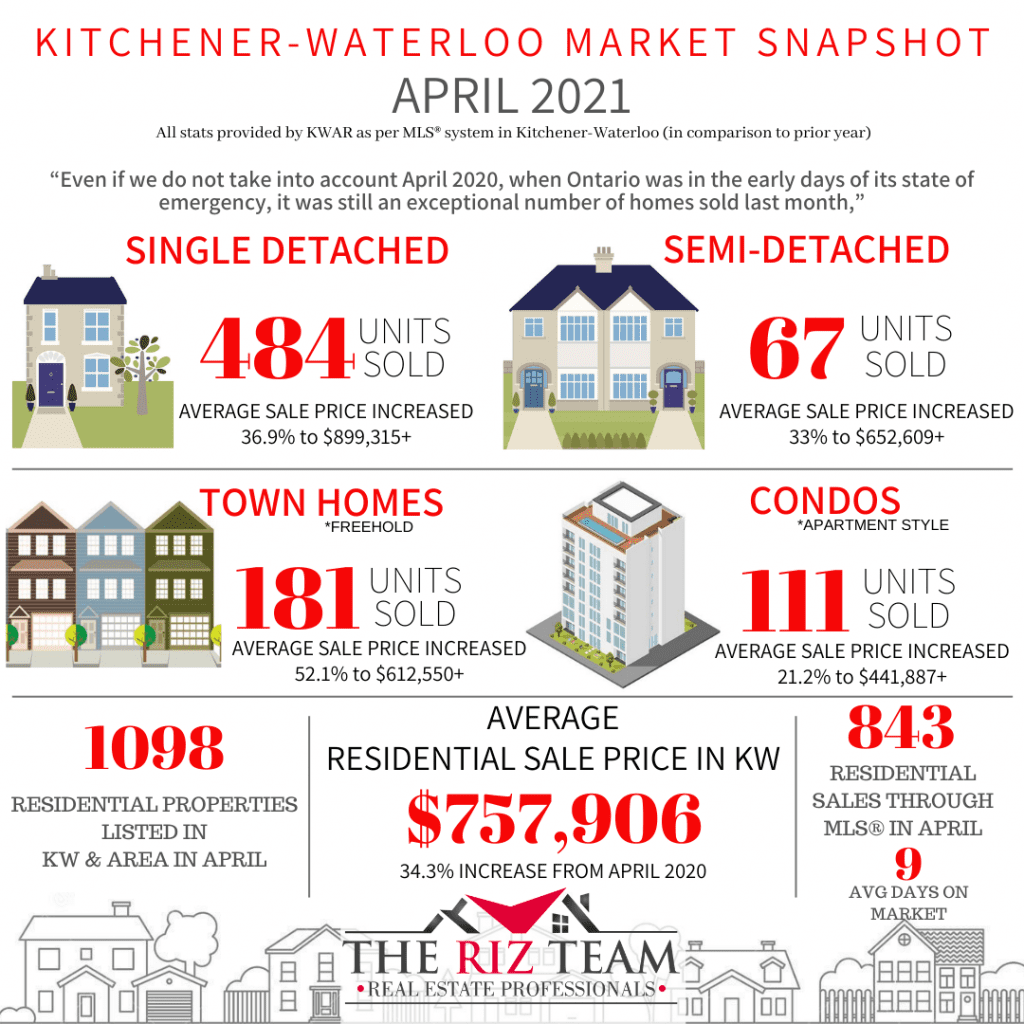
NUMBER OF HOME SALES IN APRIL SECOND HIGHEST ON RECORD
KITCHENER-WATERLOO, ON (May 5, 2021) –– Following last month’s record-smashing number of home sales, the Kitchener-Waterloo Association of REALTORS® (KWAR) posted the second-highest number of monthly home sales in April. There were 843 residential homes sold through the Multiple Listing Service® (MLS® System) of KWAR last month, an increase of 263.4 per cent compared to April 2020, and a decrease of 15.5 per cent compared to March 2021.
“Even if we do not take into account April 2020, when Ontario was in the early days of its state of emergency, it was still an exceptional number of homes sold last month,” says Nicole Pohl, President of KWAR. “The previous 10-year average number of residential sales for April was 618.”
Total residential sales in April included 484 detached (up 233.8 per cent from April 2020), and 111 condominium units (up 382.6 per cent). Sales also included 67 semi-detached homes (up 294.1 per cent) and 181 townhouses (up 285.1 per cent).
In April, the average sale price for all residential properties in the Kitchener-Waterloo area was $757,906. This represents a 34.3 per cent increase over April 2020 and a 0.9 per cent decrease compared to March 2021.
-
-
- The average price of a detached home was $899,315. This represents a 36.9 per cent increase from April 2020 and an increase of 0.04 per cent compared to March 2021.
-
-
-
- The average sale price for an apartment-style condominium was $441,887. This represents an increase of 21.2 per cent from April 2020 and an increase of 4.2 per cent compared to March 2021.
-
-
-
- The average sale price for a townhouse was $612,550. This represents a 52.1 per cent increase from April 2020 and a decrease of 2.03 per cent compared to March 2021.
-
-
-
- The average sale price for a semi was $652,609. This represents an increase of 33.0 per cent compared to April 2020 and an increase of 0.18 per cent compared to March 2021.
-
“We are starting to see home prices calm down in March and April compared to what was happening in January and February,” says Pohl.

KWAR cautions that average sale price information can be useful in establishing long-term trends but should not be used as an indicator that specific properties have increased or decreased in value. The MLS® Home Price Index (HPI) provides the best way to gauge price trends because averages are strongly distorted by changes in the mix of sales activity from one month to the next.
The MLS® HPI composite benchmark price for all residential properties in Kitchener-Waterloo was $742,800 in April. This represents a 40.4 per cent increase over April 2020 and a 0.6 per cent increase compared to March 2021.
-
-
- The benchmark price for a detached home was $809,000. This represents a 39.9 per cent increase from April 2020 and 1.0 per cent decrease compared to March 2021.
-
- The benchmark price for an apartment-style condominium was $374,100. This represents a 31.1 per cent increase from April 2020 and a 4.3 per cent increase compared to March 2021.
-
- The benchmark price for a townhouse is $591,300. This represents a 47.2 per cent increase from April 2020 and a 6.6 per cent increase compared to March 2021.
-

There were 1,098 new listings added to the MLS® System in KW and area last month, an increase of 162.7 per cent compared to April of last year, and a 17.15 per cent increase compared to the previous ten-year average for April* (*calculated from 2019 to 2010 to adjust for the impact of the state of emergency on activity in April 2020).
The total number of homes available for sale in active status at the end of April was 458, a decrease of 21.8 per cent compared to April of last year, and 66.9 per cent below the previous ten-year average of 1,384 listings for April* (*calculated from 2010 to 2019 to adjust for the impact of the state of emergency on activity in April 2020).
The number of months of inventory was 0.7 in April, which is unchanged from March. Inventory has numbered less than 1 month since October. The number of months of inventory represents how long it would take to sell off current inventories at the current rate of sales.
The average number of days to sell in April was 9 days, compared to 19 days in April 2020 and a previous 5-year average of 21 days.
Those requiring specific information on property values should contact a local REALTOR®. Working with a Realtor is the best way to get a complete picture of the property and community you are considering.
View our HPI tool here to learn more: https://kwar.ca/hpi-dashboard
Historical Sales By Property Type

Months Supply of Homes for Sale

Historical Median Sales Price – By Property Type

Historical Average Sales Price – By Property Type

