Kitchener Market Snapshot for April 2020
Thursday, May 7th, 2020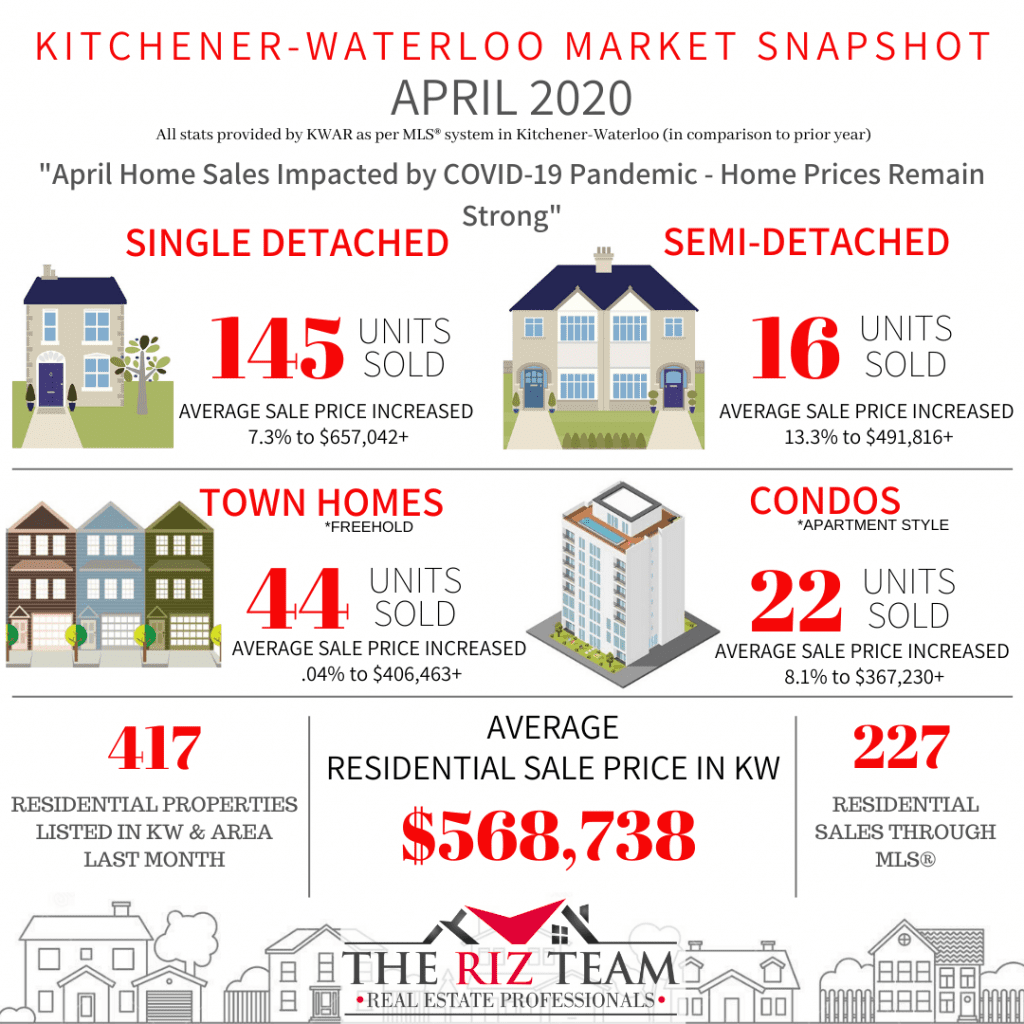
KITCHENER-WATERLOO, ON (May 4, 2020) ––There were 227 residential homes sold through the Multiple Listing System (MLS® System) of the Kitchener-Waterloo Association of REALTORS® in April, a decrease of 63.6 per cent compared to the same month last year, and the lowest number of sales in a single month since December 2008.
“It goes without saying the current pandemic has had a major impact on the number of sales we would normally see in April,” says Colleen Koehler, President of KWAR. “With everyone doing their part to flatten the curve and doing their best to self-isolate, the buying and selling of homes have been greatly reduced.”
Total residential sales in April included 145 detached homes (down 63.3 per cent), and 22 condominium apartments (down 71.1 per cent). Sales also included 44 townhouses (down 61.1 per cent) and 16 semi-detached homes (down 60 per cent).
The average sale price of all residential properties sold in April increased 7.3 per cent to $568,738 compared to the same month last year, while detached homes sold for an average price of $657,042 an increase of 7.3 per cent. During this same period, the average sale price for an apartment-style condominium was $367,230 for an increase of 8.1 per cent. Townhomes and semis sold for an average of $406,463 (up 0.4 per cent) and $491,816 (up 13.3 per cent) respectively.
The median price of all residential properties sold in April increased by 7.1 per cent to $525,000 and the median price of a detached home during the same period increased 6.3 per cent to $605,000.
While still deemed an essential service, REALTORS® listed considerably fewer homes in April due to the current state of emergency. There were 417 new listings added to the MLS® System in KW and area last month, a decrease of 54.8 per cent compared to April of 2019, far fewer than the previous 10-year average of 937 listings in April.
The total number of homes available for sale in active status at the end of April was 571, a decrease of 36.6 per cent compared to April of last year.
The number of Months Supply (also known as absorption rate) continues to be very low at just 1.2 months for the month of April, 36.8 per cent below the same period last year. The previous ten-year average supply of homes for April was 2.95 months, and in the past 5 years, the average supply for April was 2.12 months.
Koehler says most REALTORS® are advising sellers to hold off on listing their properties until after the state of emergency has been lifted. However, not every seller or buyer has that option which is why real estate was deemed an essential service. Realtors who have been working with buyers and sellers through this unprecedented time have been carefully following the guidelines of health Canada and taking all the necessary precautions to protect themselves and their clients. “In addition to health safety measures, our members are quickly adapting to new ways of showing property by conducting virtual showings for their clients, and other innovative practices,” says Koehler.
The president of KWAR is confident that despite the current pandemic, the slowdown in housing sales will be temporary. “It has been a strong sellers’ market for the past few years with buyers competing for a scare number of listings.” Now for the first time in a long time, April saw some balance with a sales-to-new-listings ratio of 54 percent – well within the balanced threshold. “We have witnessed some buyers expecting homes to sell at greatly reduced amounts, and frankly, that’s simply not the case. Home values have remained stable which we expect will continue,” says Koehler.
The average days to sell in April was 19 days, compared to 21 days in April 2019.
KWAR cautions that average sale price information can be useful in establishing long term trends but should not be used as an indicator that specific properties have increased or decreased in value. The average sale price is calculated based on the total dollar volume of all properties sold. Months Supply is the inventory of homes for sale at the end of a given month, divided by the average monthly closed sales from the last 12 months Those requiring specific information on property values should contact a local REALTOR®. REALTORS® have their fingers on the pulse of the market. They know the questions to ask, the areas to probe and what to look for so that you get a complete picture of the property and community you’re considering.
Historical Sales By Property Type

Months Supply of Homes for Sale

Historical Median Sales Price – By Property Type

Historical Average Sales Price – By Property Type

Historical Sales – By Price Range