Posts Tagged ‘waterloo for sale’
Wednesday, July 8th, 2026
“While sales activity in Waterloo Region picked up in June compared with the previous month, year-over-year figures show a 2.9 per cent dip, marking the slowest June on record, just nine sales short of June 2024. Both Kitchener and Waterloo posted double-digit declines; meanwhile, Cambridge boasted a 15.2 per cent increase in sales year-over-year,” said Bill Duce, CEO of Cornerstone. “The number of new listings added to the market remains lower than last year, reducing months of supply in all areas except Kitchener. Waterloo Region continues to have the tightest market conditions compared with our other regions, highlighting why using a local REALTOR® is beneficial for both buyers and sellers as they navigate the local market.”
If you are considering to SELL your home or BUY a home in the next short while,
it would be highly beneficial for you to connect with one of our Team Agents at
Do you want to know what your home is worth today? Click Below for our Online No Obligation Market Evaluation:

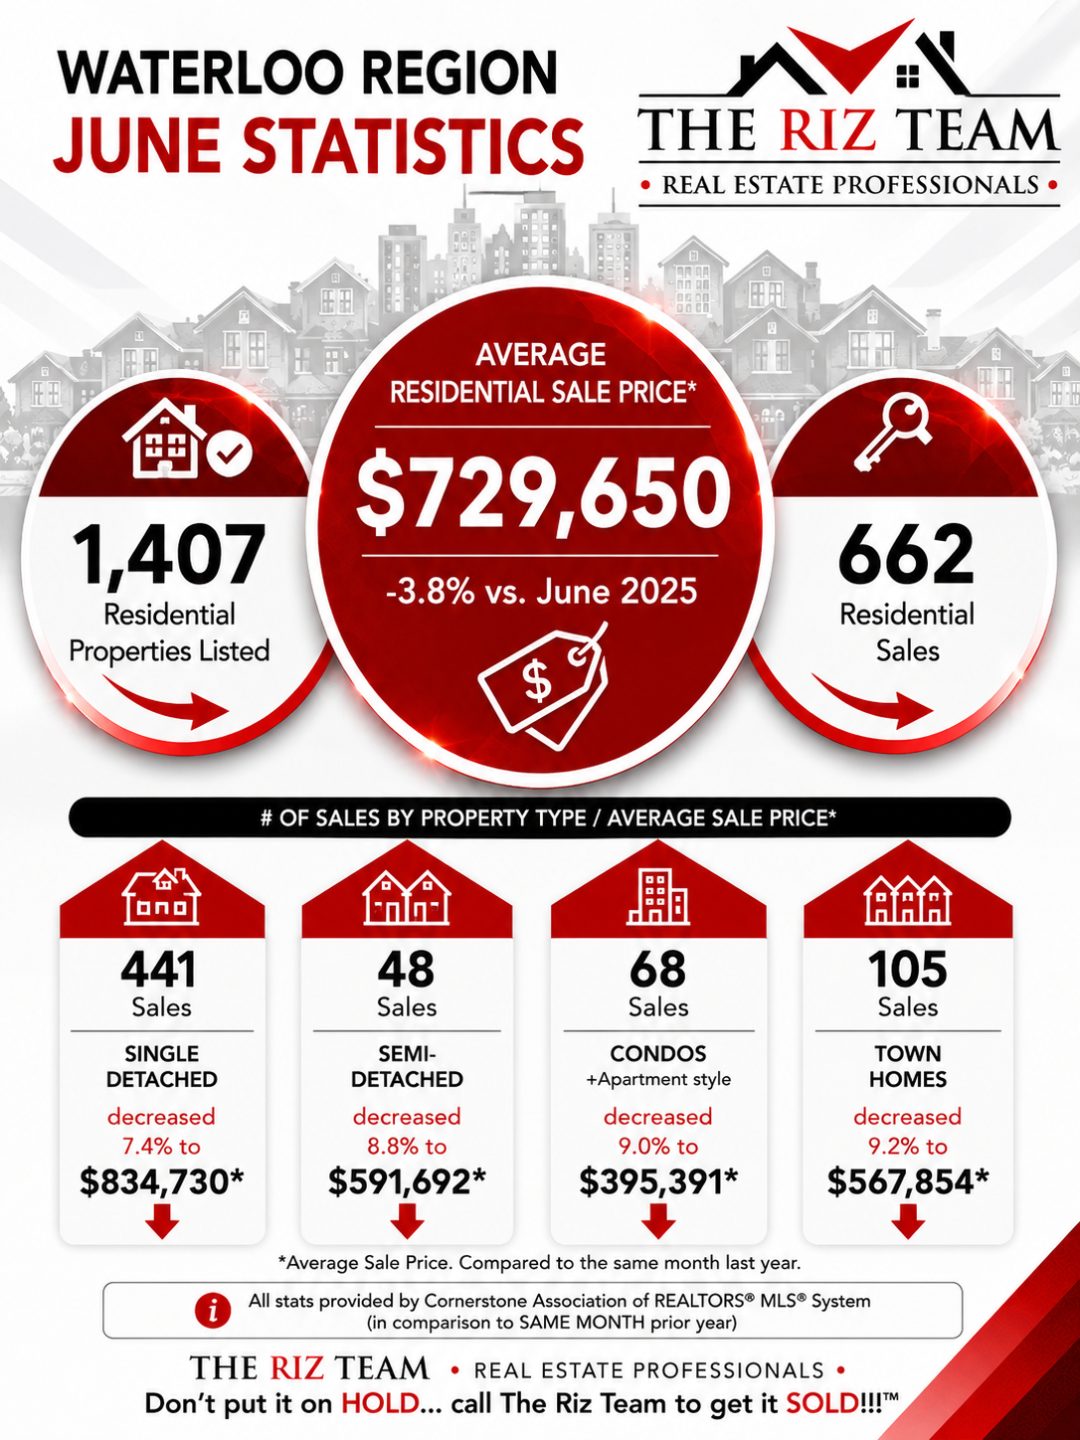
Waterloo Region June 2026 Statistics
“While sales activity in Waterloo Region picked up in June compared with the previous month, year-over-year figures show a 2.9 per cent dip, marking the slowest June on record, just nine sales short of June 2024. Both Kitchener and Waterloo posted double-digit declines; meanwhile, Cambridge boasted a 15.2 per cent increase in sales year-over-year,” said Bill Duce, CEO of Cornerstone. “The number of new listings added to the market remains lower than last year, reducing months of supply in all areas except Kitchener. Waterloo Region continues to have the tightest market conditions compared with our other regions, highlighting why using a local REALTOR® is beneficial for both buyers and sellers as they navigate the local market.”
Waterloo Region Area Highlights:
- Waterloo Region home sales increased 4.3% month-over-month.
- The number of newly listed properties decreased by 4.0% on a month-over-month basis.
- In Kitchener-Waterloo, the MLS® Home Price Index (HPI) was $642,000 in May 2026, a decrease of 1.1% month-over-month and a 5.5 % decline on a year-over-year basis. In Cambridge, the HPI was $671,000, which was a 0.8% decrease month-over-month and a drop of 6.6% on a year-over-year basis.
- The supply of inventory across the market increased 1.2% on a year-over-year basis, and there was a 4.1-month supply of all property types by the end of June, which was 2.4% lower than in June 2025.
Waterloo Region Housing Statistics
Analyze the thriving Waterloo Region real estate market, home to leading tech companies, prestigious universities, and diverse communities. Our comprehensive statistics track this dynamic market across cities, townships, and property types. click on the Cornerstone Image to access full report
Tags: for sale, Kitchener Buyers, kitchener realtor, kitchener-waterloo, rizsellskw, royal lepage, Royal Lepage Wolle Realty, sales representative, the riz team, Waterloo Buyers, waterloo for sale, Waterloo Homes, waterloo real estate, Waterloo Sellers
Posted in Enhance Your Home, Kitchener Buyers, Kitchener Sellers, Market Stats, Market Update, Real Estate News, Realtor Tips, Uncategorized, Waterloo Buyers, Waterloo Sellers | Comments Off on Kitchener Waterloo Market Snapshot June 2026
Tuesday, June 9th, 2026
“Waterloo Region is navigating one of its slowest Mays for sales in the past 15 years, yet the steady month-over-month progress since the start of the year is encouraging. A 9.8 per cent increase in sales from April, combined with a modest uptick in new listings, speaks to a market that is gradually finding its footing,” says Bill Duce, CEO of Cornerstone.
If you are considering to SELL your home or BUY a home in the next short while,
it would be highly beneficial for you to connect with one of our Team Agents at
Do you want to know what your home is worth today? Click Below for our Online No Obligation Market Evaluation:
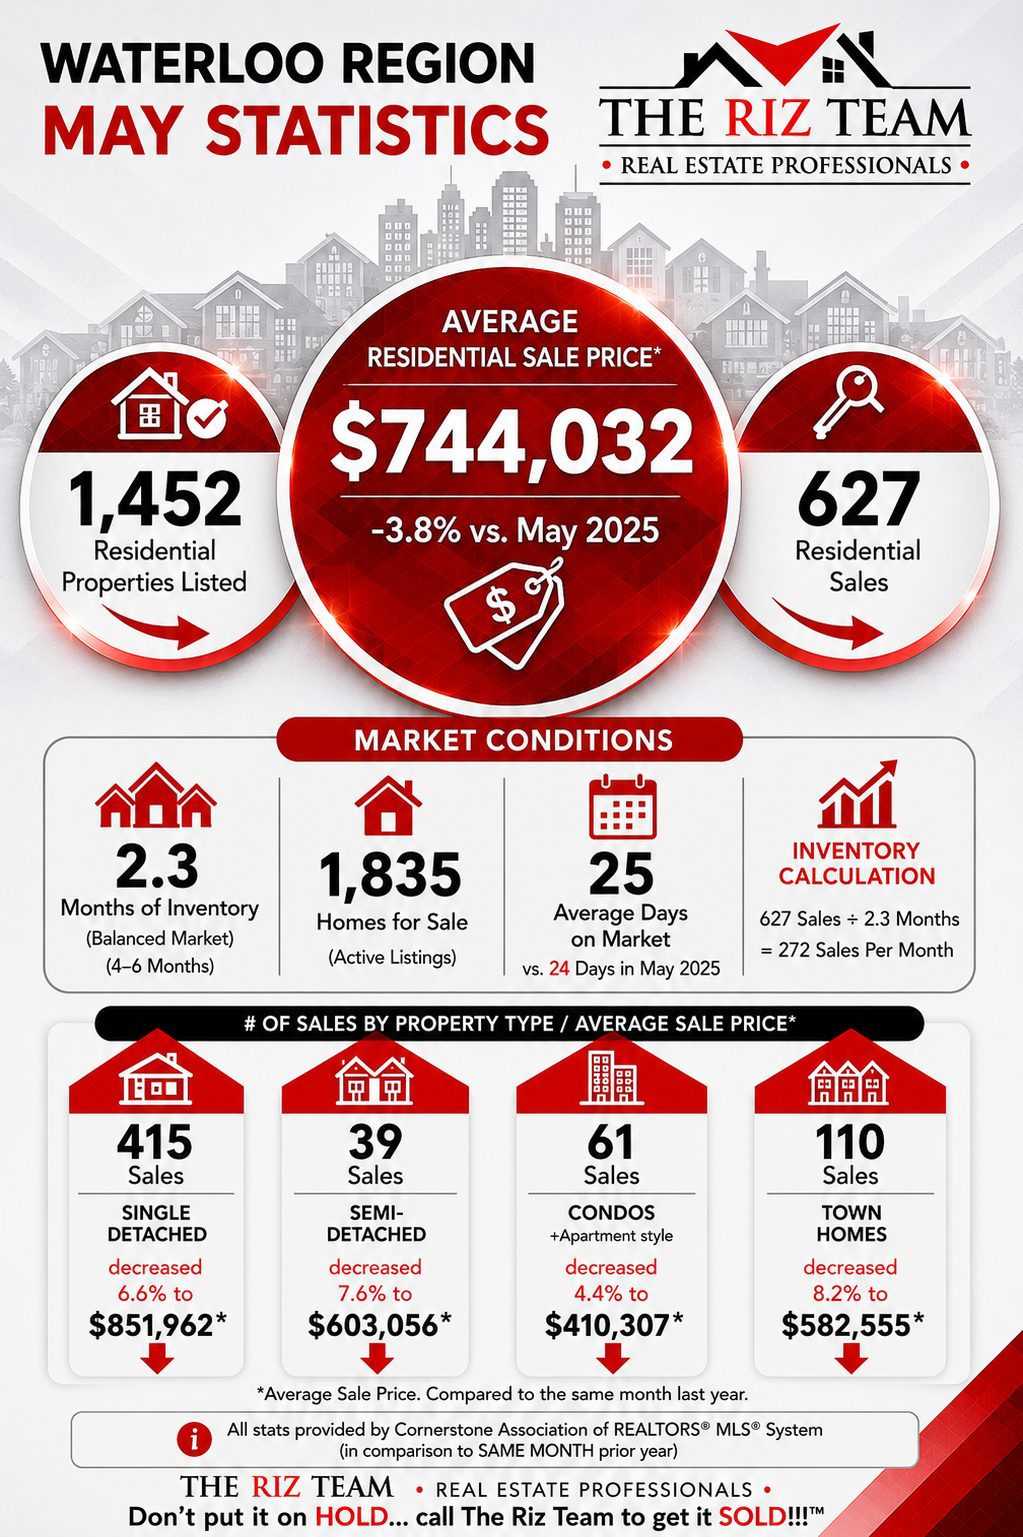
Waterloo Region May Statistics
“Waterloo Region is showing encouraging signs of spring vitality, with sales up 14.0 per cent and new listings surging nearly 28.0 per cent month-over-month. The HPI increased by 0.1 per cent and 1.5 per cent month-over-month in Kitchener-Waterloo and Cambridge, respectively. Inventory levels across the region indicate a 3.6-month supply, which is consistent with the same time last year. However, this supply is higher than the historical average. Each area within Waterloo Region performed differently in April, highlighting the importance of partnering with a local REALTOR® who understands the distinct dynamics across the region.” – Bill Duce, Cornerstone CEO
Waterloo Region Area Highlights:
- Waterloo Region home sales increased 14.0% month-over-month.
- The number of newly listed properties increased by 27.8% on a month-over-month basis.
- In Kitchener-Waterloo, the MLS® Home Price Index (HPI) increased by 0.1% month-over-month and declined 6.7% on a year-over-year basis. In Cambridge, the HPI increased by 1.5% month-over-month and was down 5.4% on a year-over-year basis.
- The supply of inventory across the market decreased 5.0% on a year-over-year basis, resulting in a 3.6-month supply of all property types by the end of April, which was similar to levels reported in April 2025.
Waterloo Region Housing Statistics
Analyze the thriving Waterloo Region real estate market, home to leading tech companies, prestigious universities, and diverse communities. Our comprehensive statistics track this dynamic market across cities, townships, and property types. click on the Cornerstone Image to access full report
Tags: buyers, for sale, Homes For Sale, Kitchener Sellers, kitchener-waterloo association of realtors, KW Market Update, Market Update, real estate, real estate market, Royal Lepage Wolle Realty, the riz team, waterloo for sale, Waterloo Sellers
Posted in Enhance Your Home, Kitchener Buyers, Market Stats, Market Update, Real Estate News, Realtor Tips, Uncategorized, Waterloo Buyers, Waterloo Sellers | Comments Off on Kitchener Waterloo Market Snapshot May 2026
Tuesday, May 5th, 2026
“The real estate market has gained positive momentum this spring, with steady month-over-month growth in sales and new listing activity since the start of the year, although at a more moderate pace than the same period in 2025,” said Bill Duce, CEO of Cornerstone. “It is encouraging that we are still early in the spring market. These April numbers are just the beginning, and May and June are typically among the strongest months of the year. The Bank of Canada’s decision last week to hold the policy rate was a welcome signal of stability, giving both buyers and sellers greater confidence to move forward with their real estate goals. For those who have been waiting on the sidelines, now is a great time to re-engage with the market.”
If you are considering to SELL your home or BUY a home in the next short while,
it would be highly beneficial for you to connect with one of our Team Agents at
Do you want to know what your home is worth today? Click Below for our Online No Obligation Market Evaluation:
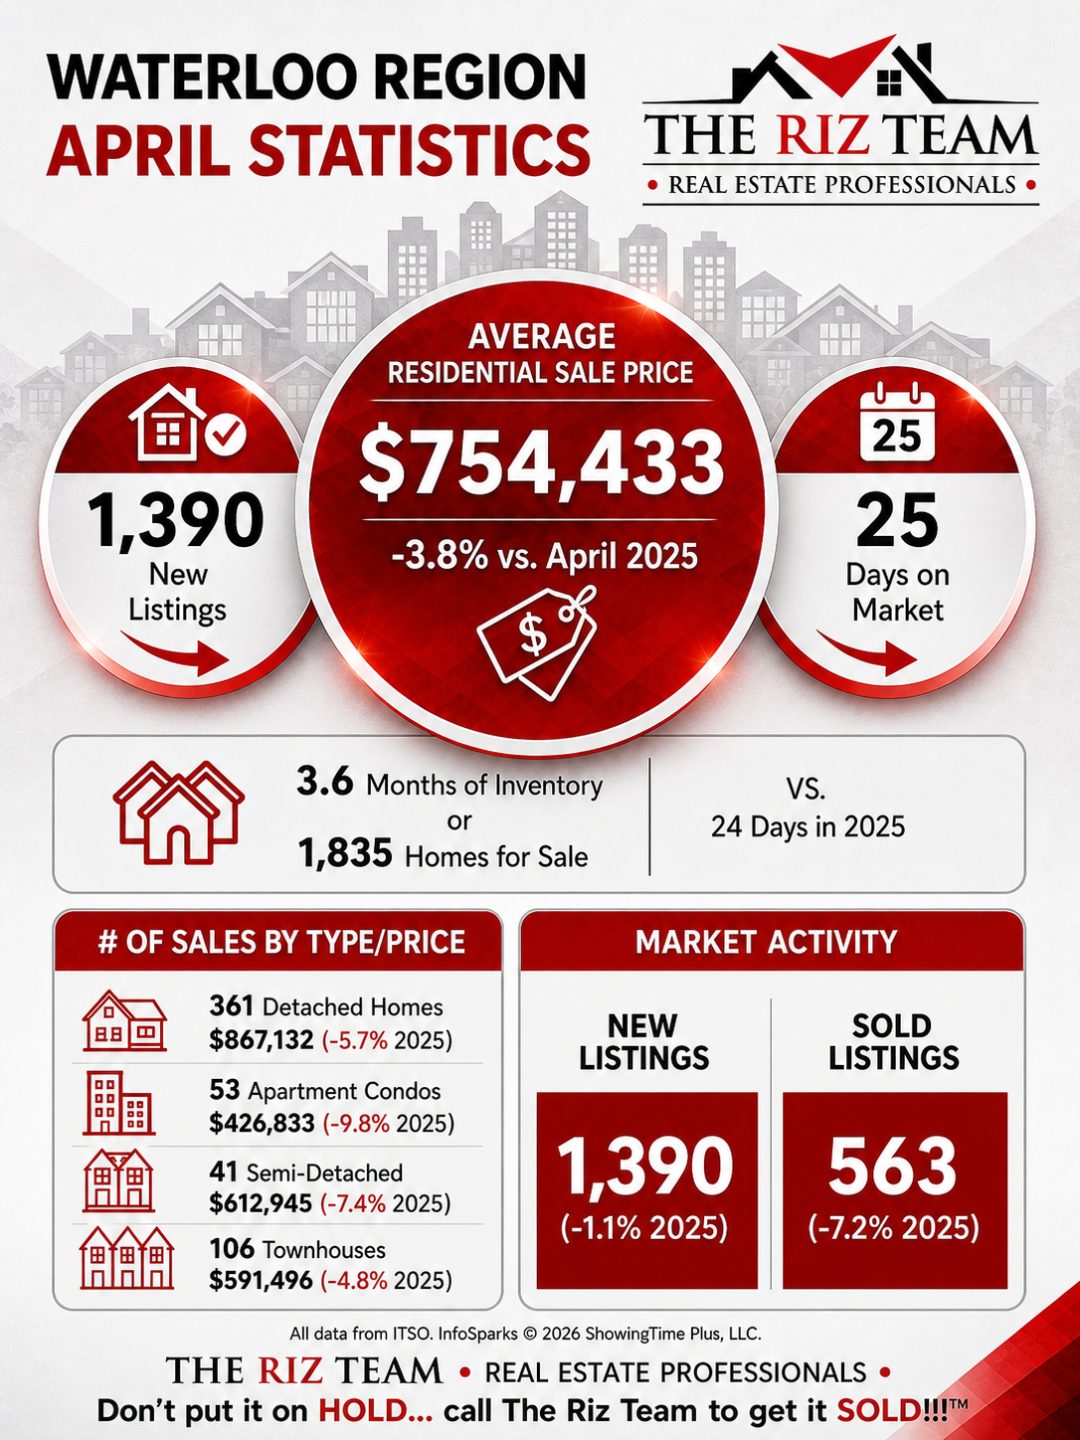
Waterloo Region April Statistics
“Waterloo Region is showing encouraging signs of spring vitality, with sales up 14.0 per cent and new listings surging nearly 28.0 per cent month-over-month. The HPI increased by 0.1 per cent and 1.5 per cent month-over-month in Kitchener-Waterloo and Cambridge, respectively. Inventory levels across the region indicate a 3.6-month supply, which is consistent with the same time last year. However, this supply is higher than the historical average. Each area within Waterloo Region performed differently in April, highlighting the importance of partnering with a local REALTOR® who understands the distinct dynamics across the region.” – Bill Duce, Cornerstone CEO
Waterloo Region Area Highlights:
- Waterloo Region home sales increased 14.0% month-over-month.
- The number of newly listed properties increased by 27.8% on a month-over-month basis.
- In Kitchener-Waterloo, the MLS® Home Price Index (HPI) increased by 0.1% month-over-month and declined 6.7% on a year-over-year basis. In Cambridge, the HPI increased by 1.5% month-over-month and was down 5.4% on a year-over-year basis.
- The supply of inventory across the market decreased 5.0% on a year-over-year basis, resulting in a 3.6-month supply of all property types by the end of April, which was similar to levels reported in April 2025.
Waterloo Region Housing Statistics
Analyze the thriving Waterloo Region real estate market, home to leading tech companies, prestigious universities, and diverse communities. Our comprehensive statistics track this dynamic market across cities, townships, and property types. click on the Cornerstone Image to access full report
Tags: buyers, home sales, Homes For Sale, Kitchener Buyers, kitchener real estate, kitchener-waterloo association of realtors, KW Market Update, rizsellskw, sales representative, Waterloo Buyers, waterloo for sale, waterloo real estate, waterloo realtor, Waterloo Sellers
Posted in Enhance Your Home, Kitchener Buyers, Kitchener Sellers, Market Stats, Market Update, Real Estate News, Realtor Tips, Uncategorized, Waterloo Buyers, Waterloo Sellers | Comments Off on Kitchener Waterloo Market Snapshot April 2026
Friday, September 5th, 2025
Waterloo Region Real Estate Market Shows Signs of Stabilization as Interest Rates Hold Steady
“The market is showing signs of stabilization, though we’re seeing a continued cooling trend compared to last year. While sales volumes have only slightly decreased year-over-year, the more notable change is in pricing, with most property types experiencing moderate downward pressure,” says Christal Moura, spokesperson for the Waterloo Region market.
If you are considering to SELL your home or BUY a home in the next short while,
it would be highly beneficial for you to connect with one of our Team Agents at
Do you want to know what your home is worth today? Click Below for our Online No Obligation Market Evaluation:

WATERLOO REGION, ON (September 5, 2025) —In August, a total of 536 homes were sold in the Waterloo Region via the Multiple Listing Service® (MLS®) System of the Cornerstone Association of REALTORS® (Cornerstone). This is a decrease of 1.3 per cent compared with the same period last year and a decline of 23.1 per cent compared to the average number of homes sold in the previous ten years for the same month.
Total residential sales in August included 320 detached homes (down 5.6 per cent from August 2024), and 101 townhouses (down 1.0 per cent). Sales also included 62 condominium units (up 1.6 per cent) and 50 semi-detached homes (up 25.0 per cent).
In August, the average sale price for all residential properties in Waterloo Region was $728,465. This represents a 5.5 per cent decrease compared to August 2024 and a 1.0 per cent decrease compared to July 2025.
- The average sale price of a detached home was $846,405. This represents a 4.6 per cent decrease from August 2024 and a decrease of 1.3 per cent compared to July 2025.
- The average sale price for a townhouse was $594,200. This represents a 3.2 percent decrease from August 2024 and a 1.7 percent decrease compared to July 2025.
- The average sale price for an apartment-style condominium was $433,113. This represents a 6.0 per cent decrease from August 2024 and an increase of 4.2 per cent compared to July 2025.
- The average sale price for a semi was $618,206. This represents a 5.5 per cent decrease from August 2024 and a 4.1 per cent decrease compared to July 2025.
CORNERSTONE cautions that average sale price information can help establish long-term trends but does not indicate specific properties have increased or decreased in value. The MLS® Home Price Index (HPI) provides the best way to gauge price trends because averages are strongly distorted by changes in the mix of sales activity from one month to the next.
MLS® Home Price Index Benchmark Price (HPI)
|
|
Kitchener-Waterloo |
Cambridge |
| Benchmark Type: |
August 2025 |
Monthly % Change |
Yr./Yr. % Change |
August 2025 |
Monthly % Change |
Yr./Yr. % Change |
| Composite |
$675,400 |
-0.4 |
-7.1 |
$701,100 |
-1.5 |
-5.6 |
| Single Family |
$795,400 |
-0.1 |
-5.2 |
$742,100 |
-1.7 |
-4.4 |
| Townhouse |
$555,400 |
-1.3 |
-8.5 |
$609,600 |
-0.2 |
-6.6 |
| Apartment |
$409,900 |
-0.2 |
-7.1 |
$455,200 |
-0.5 |
-5.7 |

There were 1,028 new listings added to the MLS® System in Waterloo Region last month, an increase of 3. per cent compared to August last year and a 11.0 per cent increase compared to the previous ten-year average for August.
The average time to sell a home in August was 32 days, which is the same as the previous month. In August 2024, it took 25 days for a home to sell, and the five-year average was 19 days.
“Despite the softer market conditions, we are encouraged by the healthy increase in new listings, which gives buyers more options,” says Moura. “While our local market statistics indicate signs of stabilization, we are operating in a complex economic environment. The Bank of Canada’s decision to maintain interest rates at 2.75% for the third consecutive time provides some predictability for both buyers and sellers. However, economic uncertainty and the Bank’s focus on inflation, especially regarding shelter costs, remind us that we are in a period where both buyers and sellers need to stay informed and collaborate closely with their REALTOR® to navigate current market conditions.”
Tags: buyers, for sale, kitchener for sale, kitchener real estate, kitchener realtor, kitchener-waterloo, KW Market Update, KW Real Estate, riz jadavji, Royal Lepage Wolle Realty, sales representative, waterloo for sale, waterloo real estate, www.rizsellskw.com
Posted in Kitchener Buyers, Kitchener Sellers, Market Stats, Market Update, Real Estate News, Waterloo Buyers, Waterloo Sellers | Comments Off on Kitchener Waterloo Market Snapshot August 2025
Thursday, August 7th, 2025
July Sees Stable Sales and Market Balance in Waterloo Region Housing
“While sales volumes remained stable compared to last year, we’re seeing continued price adjustments across all property types,” says Christal Moura, spokesperson for the Waterloo Region market. “The Bank of Canada’s decision to hold rates steady in July, combined with increased inventory and price moderation, is creating more opportunities for buyers who have been waiting to enter the market, though broader economic uncertainties surrounding the Canada-US trade war continue to impact consumer confidence.”
If you are considering to SELL your home or BUY a home in the next short while,
it would be highly beneficial for you to connect with one of our Team Agents at
Do you want to know what your home is worth today? Click Below for our Online No Obligation Market Evaluation:
WATERLOO REGION, ON (August 7, 2025) —In July, a total of 644 homes were sold in the Waterloo Region via the Multiple Listing Service® (MLS®) System of the Cornerstone Association of REALTORS® (Cornerstone). This is on par with the same period last year and a decline of 14.3 per cent compared to the average number of homes sold in the previous ten years for the same month.
“While sales volumes remained stable compared to last year, we’re seeing continued price adjustments across all property types,” says Christal Moura, spokesperson for the Waterloo Region market. “The Bank of Canada’s decision to hold rates steady in July, combined with increased inventory and price moderation, is creating more opportunities for buyers who have been waiting to enter the market, though broader economic uncertainties surrounding the Canada-US trade war continue to impact consumer confidence.”
Total residential sales in July included 383 detached homes (up 0.5 per cent from July 2024), and 123 townhouses (down 5.4 per cent). Sales also included 80 condominium units (down 3.6 per cent) and 55 semi-detached homes (up 14.6 per cent).
In July, the average sale price for all residential properties in Waterloo Region was $735,082. This represents a 6.0 per cent decrease compared to July 2024 and a 5.7 per cent decrease compared to June 2025.
- The average sale price of a detached home was $857,579. This represents a 6.2 per cent decrease from July 2024 and a decrease of 4.5 per cent compared to June 2025.
- The average sale price for a townhouse was $603,245. This represents a 2.8 percent decrease from July 2024 and a 3.5 percent decrease compared to June 2025.
- The average sale price for an apartment-style condominium was $415,559. This represents a 16.7 per cent decrease from July 2024 and a decrease of 4.4 per cent compared to June 2025.
- The average sale price for a semi was $644,930. This represents a 3.3 per cent decrease from July 2024 and a 0.6 per cent decrease compared to June 2025.
CORNERSTONE cautions that average sale price information can help establish long-term trends but does not indicate specific properties have increased or decreased in value. The MLS® Home Price Index (HPI) provides the best way to gauge price trends because averages are strongly distorted by changes in the mix of sales activity from one month to the next.
|
MLS® Home Price Index Benchmark Price (HPI)
|
| |
Kitchener-Waterloo |
Cambridge |
| Benchmark Type: |
July 2025 |
Monthly % Change |
Yr./Yr. % Change |
July 2025 |
Monthly % Change |
Yr./Yr. % Change |
| Composite |
$677,900 |
-1.2 |
-7.3 |
$711,600 |
-1.7 |
-4.2 |
| Single Family |
$796,000 |
-1.2 |
-5.1 |
$755,000 |
-1.6 |
-2.8 |
| Townhouse |
$562,600 |
-1.0 |
-9.0 |
$610,700 |
-2.1 |
-6.2 |
| Apartment |
$410,600 |
-1.7 |
-9.7 |
$457,600 |
-0.1 |
-7.8 |

There were 1,356 new listings added to the MLS® System in Waterloo Region last month, a decrease of 3.1 per cent compared to July last year and a 21.2 per cent increase compared to the previous ten-year average for July.
The average time to sell a home in July was 32 days, compared to 27 days in the previous month. In July 2024, it took 22 days for a home to sell, and the five-year average was 17 days.
“The longer average days on the market reflect that we’re in a more balanced market environment,” Moura says. “This means that buyers can take their time to make informed decisions, while sellers are adjusting their expectations to fit the current market conditions.”
View our HPI tool here to learn more: https://www.cornerstone.inc/stats/
Download PDF Version
Cornerstone Association of REALTORS® cautions that average sale price information can help identify long-term trends but should not indicate that specific properties have increased or decreased in value. The average sale price is calculated based on the total dollar volume of all properties sold. Months’ Supply is the inventory of homes for sale at the end of a given month, divided by the average monthly closed sales from the last 12 months. Those requiring specific information on property values should contact a Waterloo Region REALTOR®. REALTORS® have their fingers on the pulse of the market. They know the questions to ask, the areas to probe and what to look for to get a complete picture of the property and community you’re considering.
Tags: buyers, for sale, Homes For Sale, kitchener for sale, Kitchener Homes, kitchener realtor, Kitchener Sellers, kitchener-waterloo, KW Market Update, KW Real Estate, riz jadavji, Royal Lepage Wolle Realty, sales representative, the riz team, waterloo for sale, waterloo real estate, www.rizsellskw.com
Posted in Kitchener Buyers, Kitchener Sellers, Market Stats, Market Update, Real Estate News, Realtor Tips, Waterloo Buyers, Waterloo Sellers | Comments Off on Kitchener Waterloo Market Snapshot July 2025
Friday, July 4th, 2025
June Housing Stats Point to More Balanced Market in Waterloo Region
“While home sales in June were relatively stable year-over-year, we’re seeing a more balanced market emerge in Waterloo Region. What’s particularly notable is the increase in condominium sales – up over 34% – suggesting a cohort of buyers looking for more affordable housing options,” says Christal Moura, spokesperson for the Waterloo Region market. “While more listings are coming to market, properties are taking a little longer to sell, giving buyers more time to make informed decisions during their home search.
If you are considering to SELL your home or BUY a home in the next short while,
it would be highly beneficial for you to connect with one of our Team Agents at
Do you want to know what your home is worth today? Click Below for our Online No Obligation Market Evaluation: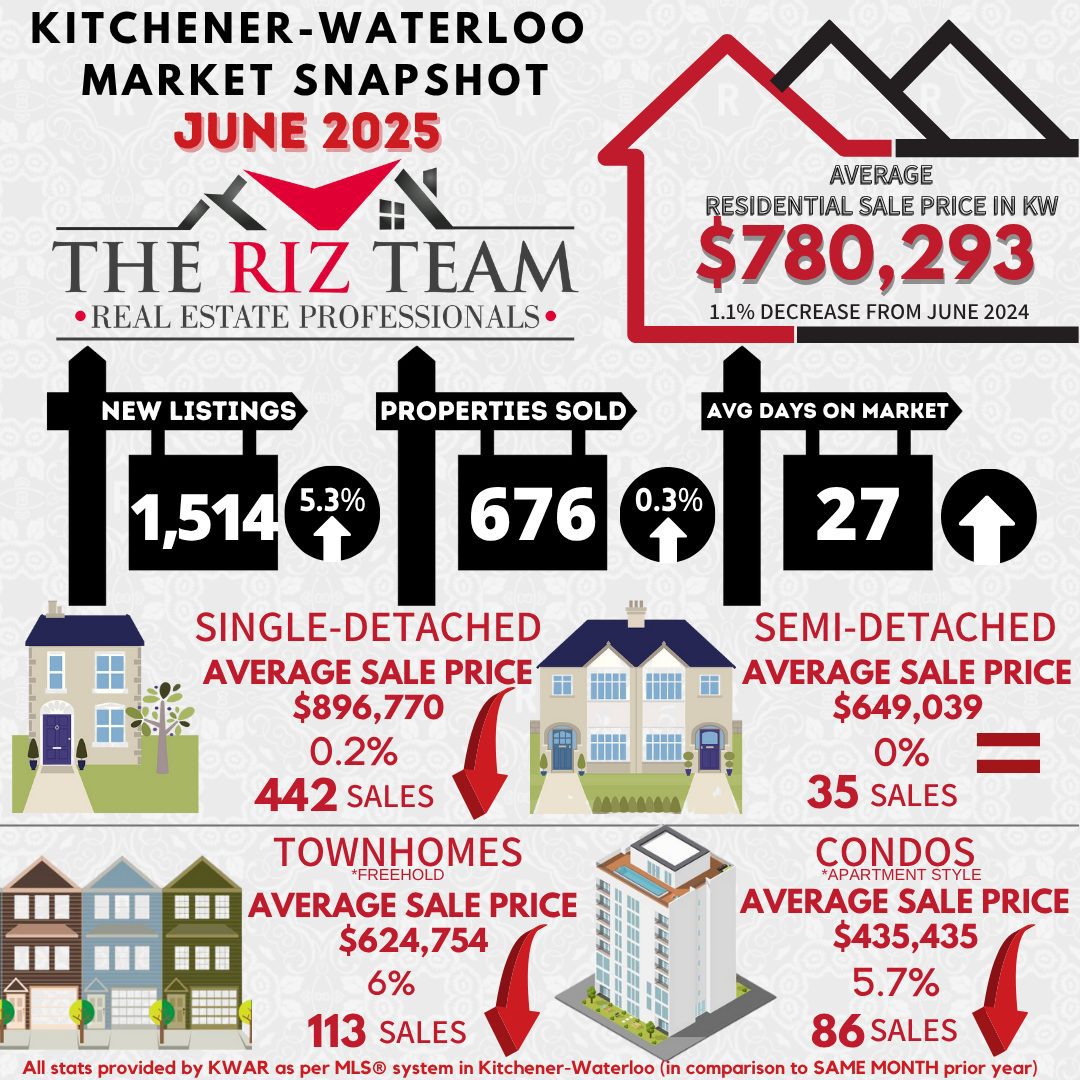
WATERLOO REGION, ON (July 4, 2025) —In June, a total of 676 homes were sold in the Waterloo Region via the Multiple Listing Service® (MLS®) System of the Cornerstone Association of REALTORS® (Cornerstone). This represents a 0.3 per cent increase compared to the same period last year and a decline of 21.7 per cent compared to the average number of homes sold in the previous ten years for the same month.
“While home sales in June were relatively stable year-over-year, we’re seeing a more balanced market emerge in Waterloo Region. What’s particularly notable is the increase in condominium sales – up over 34% – suggesting a cohort of buyers looking for more affordable housing options,” says Christal Moura, spokesperson for the Waterloo Region market. “While more listings are coming to market, properties are taking a little longer to sell, giving buyers more time to make informed decisions during their home search.
Total residential sales in June included 442 detached homes (up 5.6 per cent from June 2024), and 113 townhouses (down 17.4 per cent). Sales also included 86 condominium units (up 34.4 per cent) and 35 semi-detached homes (down 25.4 per cent).
In June, the average sale price for all residential properties in Waterloo Region was $780,293. This represents a 1.1 per cent decrease compared to June 2024 and a 1.2 per cent decrease compared to May 2025.
- The average price of a detached home was $896,770. This represents a 0.2 per cent decrease from June 2024 and a decrease of 1.4 per cent compared to May 2025.
- The average sale price for a townhouse was $624,754. This represents a 6.0 percent decrease from June 2024 and a 1.6 percent decrease compared to May 2025.
- The average sale price for an apartment-style condominium was $435,435. This represents a 5.7 per cent decrease from June 2024 and an increase of 0.7 per cent compared to May 2025.
- The average sale price for a semi was $649,039, on par with June 2024 and a 0.5 per cent decrease compared to May 2025.
CORNERSTONE cautions that average sale price information can help establish long-term trends but does not indicate specific properties have increased or decreased in value. The MLS® Home Price Index (HPI) provides the best way to gauge price trends because averages are strongly distorted by changes in the mix of sales activity from one month to the next.
| MLS® Home Price Index Benchmark Price (HPI) |
| |
Kitchener-Waterloo |
Cambridge |
| Benchmark Type: |
June 2025 |
Monthly % Change |
Yr./Yr. % Change |
June 2025 |
Monthly % Change |
Yr./Yr. % Change |
| Composite |
$686,100 |
-2.3 |
-7.5 |
$723,400 |
-1.5 |
-4.2 |
| Single Family |
$805,600 |
-2.7 |
-5.5 |
$767,300 |
-1.5 |
-3.1 |
| Townhouse |
$568,200 |
-2.7 |
-9.3 |
$623,400 |
-1.5 |
-4.5 |
| Apartment |
$417,900 |
1.5 |
-8.3 |
$458,200 |
-0.8 |
-6.6 |

“Looking at the HPI benchmark prices, we’re seeing a market that’s adjusting to changing economic conditions. While we’re experiencing some year-over-year price decreases, Waterloo Region’s market fundamentals remain strong, supported by a diversified economy and the region’s appeal as a place of residence for both families and businesses,” says Moura. “These market shifts underscore the importance of working with a professional REALTOR® who can provide crucial guidance on pricing strategies, market timing, and negotiation. Their expertise helps both buyers and sellers adjust their expectations and make informed decisions in this evolving market environment.”
There were 1,514 new listings added to the MLS® System in Waterloo Region last month, an increase 5.3 per cent compared to June last year and a 15.1 per cent increase compared to the previous ten-year average for June.
The average time to sell a home in June was 27 days, compared to 24 days in the previous month. In June 2024, it took 18 days for a home to sell, and the five-year average was 15 days.
View our HPI tool here to learn more: https://www.cornerstone.inc/stats/
Tags: buyers, Homes For Sale, kitchener for sale, kitchener-waterloo, kitchener-waterloo association of realtors, Market Update, rizsellskw, royal lepage, Royal Lepage Wolle Realty, sales representative, the riz team, waterloo for sale, waterloo real estate, Waterloo Sellers
Posted in Kitchener Buyers, Kitchener Sellers, Market Stats, Market Update, Real Estate News, Realtor Tips, Waterloo Buyers, Waterloo Sellers | Comments Off on Kitchener Waterloo Market Snapshot June 2025
Wednesday, July 24th, 2024
This decrease will assist buyers by offering a better affordability plan on their monthly payments, while also helping sellers within a more active marketplace as buyers start to re-enter. Be sure to connect with anyone from The Riz Team and let’s put a plan in place for your next move….

Do you want to know what your home is worth today? Click Below for our Online No Obligation Market Evaluation
Bank of Canada cuts key interest rate again, more cuts ‘reasonable’ if inflation keeps easing
For the second time in a row, Canada’s central bank has cut its overnight lending rate.
In its pre-scheduled July 2024 announcement, the Bank of Canada dropped the target for the overnight lending rate by 25 basis points to 4.50%.
While inflation remains above the Bank’s 2% target, it is expected that inflation will continue to ease as the global economy expands into 2026, bolstering the Bank’s decision to continue lowering rates.
In his opening remarks to reporters at a press conference following the announcement, Tiff Macklem, Governor of the Bank of Canada, cited that the risk that inflation continues to grow must be balanced against the risk that the economy and inflation could weaken.
“Looking ahead, we expect inflation to moderate further, though progress over the next year will likely be uneven. This forecast reflects the opposing forces affecting inflation. The overall weakness in the economy is pulling inflation down. At the same time, price pressures in shelter and some other services are holding inflation up,” said Macklem. “We are increasingly confident that the ingredients to bring inflation back to target are in place. But the push-pull of these opposing forces means the decline in inflation will likely be gradual, and there could be setbacks along the way.”

| Date* |
Target (%) |
Change (%) |
| July 24, 2024 |
4.5 |
-0.25 |
| June 5, 2024 |
4.75 |
-0.25 |
| April 10, 2024 |
5 |
— |
| March 6, 2024 |
5 |
— |
| January 24, 2024 |
5 |
— |
| December 6, 2023 |
5 |
— |
| October 25, 2023 |
5 |
— |
| September 6, 2023 |
5 |
— |
| July 12, 2023 |
5 |
0.25 |
| June 7, 2023 |
4.75 |
0.25 |
| April 12, 2023 |
4.5 |
— |
| March 8, 2023 |
4.5 |
— |
According to a recent Royal LePage survey, conducted by Leger,1 51% of Canadians who put their home buying plans on hold the last two years said they would return to the market when the Bank of Canada reduced its key lending rate. Eighteen percent said they would wait for a cut of 50 to 100 basis points, and 23% said they’d need to see a cut of more than 100 basis points before considering resuming their search.
“Our research shows that many buyer hopefuls have been waiting for a concrete signal from the Bank of Canada that the economy is moving in the right direction. A second cut to the overnight lending rate indicates just that, and with mortgage qualification thresholds continuing to come down, sidelined buyers may have the confidence they need to make their return to the housing market,” said Karen Yolevski, COO of Royal LePage Real Estate Services Ltd.
“We expect this will prompt a slight boost in activity in the short-term, followed by more robust buyer demand in the fall. In the meantime, some much-needed inventory has been building in major markets over the last few months, giving buyers more options to choose from. In addition to lower rates, this may also encourage more buyers to re-enter the market in the near future.”
The Bank of Canada will make its next announcement on Wednesday, September 4th.
Read the full July 24th report here.
Article excerpts brought to you by
Michelle McNally
Communications manager, Royal LePage
Tags: buyers, housing, kitchener-waterloo, KW Market Update, royal lepage, Royal Lepage Wolle Realty, sales representative, the riz team, TheRizTeam, waterloo, Waterloo Buyers, waterloo for sale, Waterloo Homes, waterloo real estate, waterloo realtor, Waterloo Sellers
Posted in Kitchener Buyers, Kitchener Sellers, Market Stats, Market Update, Real Estate News, Realtor Tips, Uncategorized, Waterloo Buyers, Waterloo Sellers | Comments Off on Bank of Canada makes second consecutive rate cut, lowers overnight lending rate to 4.50%
Thursday, April 4th, 2024
Waterloo Region Home Sales Sluggish in March, Prices Steady
Despite the challenging market conditions, the first quarter of 2024 saw an increase in home sales, marking an 8.0 per cent rise compared to the previous year. However, these figures still fall short of the first-quarter sales of the past decade.
“While home sales in Waterloo Region hit a record low for March in over two decades, we’re also witnessing a positive trend,” says Christal Moura, president of WRAR. Over the past three months, prices and activity have started to pick up, and I expect this momentum will continue into the spring.”
If you are considering to Sell your home or Buy a home in the next short while it would be highly beneficial for you to connect with one of our Team Agents at
Do you want to know what your home is worth today? Click Below for our Online No Obligation Market Evaluation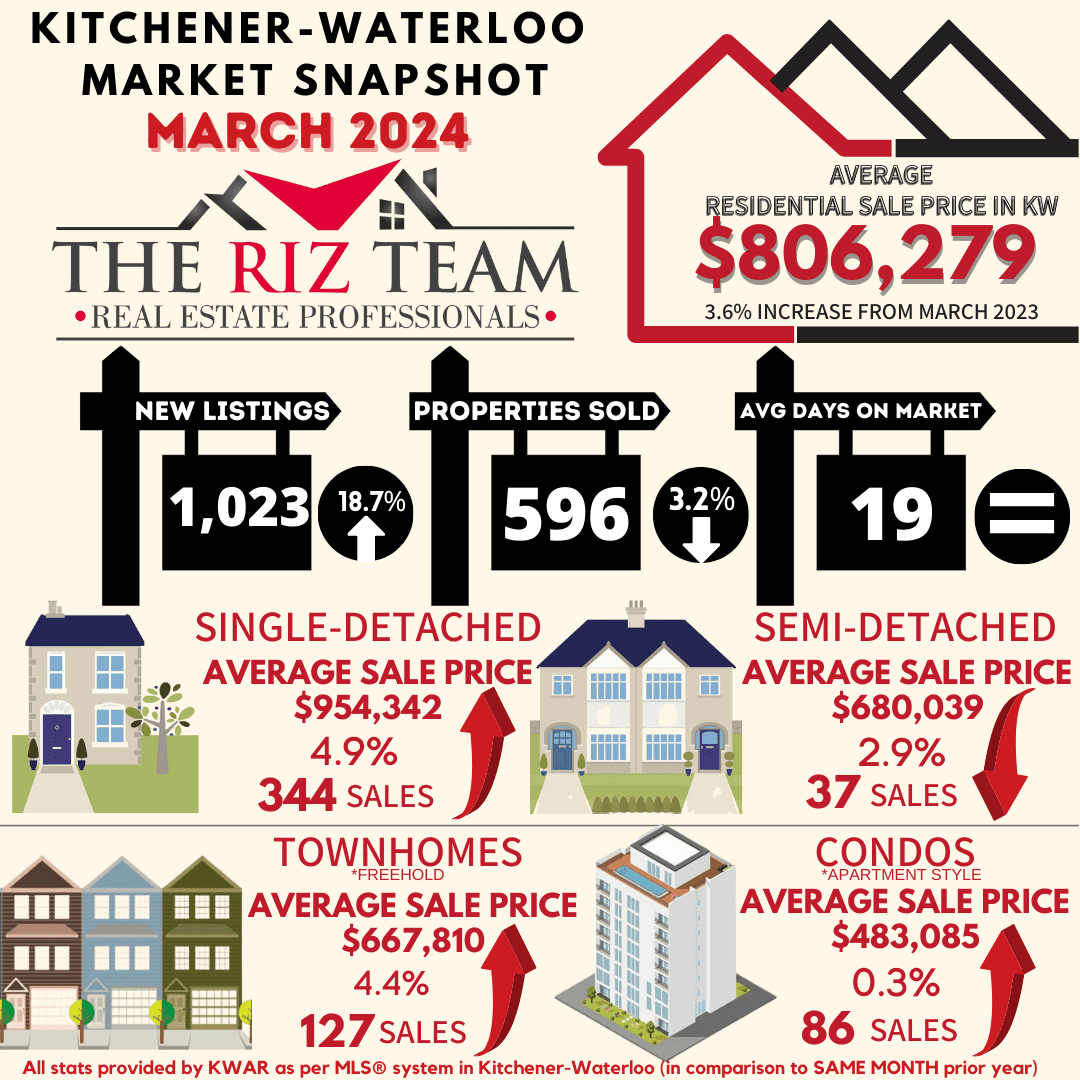
WATERLOO REGION, ON (April 4, 2024) —In March, a total of 596 homes were sold via the Multiple Listing Service® (MLS®) System of the Waterloo Region Association of REALTORS® (WRAR). This represents a decrease of 3.2% compared to the same period last year and a decline of 33.4% compared to the average number of homes sold in the previous 5 years for the same month.
Despite the challenging market conditions, the first quarter of 2024 saw an increase in home sales, marking an 8.0 per cent rise compared to the previous year. However, these figures still fall short of the first-quarter sales of the past decade.
“While home sales in Waterloo Region hit a record low for March in over two decades, we’re also witnessing a positive trend,” says Christal Moura, president of WRAR. Over the past three months, prices and activity have started to pick up, and I expect this momentum will continue into the spring.”
Total residential sales in March included 344 detached (down 3.9 per cent from March 2023), and 127 townhouses (down 0.8 per cent). Sales also included 86 condominium units (down 1.1 per cent) and 37 semi-detached homes (down 11.9 per cent).
In March, the average sale price for all residential properties in Waterloo Region was $806,279. This represents a 3.6 per cent increase compared to March 2023 and a 6.6 per cent increase compared to February 2024.
- The average price of a detached home was $954,342. This represents a 4.9 per cent increase from March 2023 and an increase of 7.3 per cent compared to February 2024.
- The average sale price for a townhouse was $667,810. This represents a 4.4 per cent increase from March 2023 and an increase of 6.0 per cent compared to February 2024.
- The average sale price for an apartment-style condominium was $483,085. This represents an increase of 0.3 per cent from March 2023 and an increase of 5.3 per cent compared to February 2024.
- The average sale price for a semi was $680,039. This represents a decrease of 2.9 per cent compared to March 2023 and an increase of 1.0 per cent compared to February 2024.

MLS® Home Price Index Benchmark Price
|
| |
Kitchener-Waterloo |
Cambridge |
| Benchmark Type: |
March 2024 |
Monthly % Change |
Yr./Yr. % Change |
March 2024 |
Monthly % Change |
Yr./Yr. % Change |
| Composite |
$740,900 |
1.6 |
0.0 |
$747,500 |
0.7 |
0.9 |
| Detached |
$853,800 |
1.5 |
1.3 |
$780,100 |
0.8 |
1.1 |
| Townhouse |
$614,900 |
2.3 |
1.3 |
$652,400 |
0.6 |
2.4 |
| Apartment |
$461,900 |
2.1 |
-0.7 |
$490,500 |
2.8 |
3.4 |

“Home prices have been gradually increasing since December, which is a typical trend,” explains Moura. “The rate and extent of further increases will depend on the willingness and patience of potential home buyers who have been waiting for lower interest rates before making their purchase. With the Bank of Canada not anticipated to make any rate changes before its June meeting, some potential home buyers may feel stuck in limbo.”
The president of WRAR recommends that anyone interested in buying or selling a property in Waterloo Region seek advice from a local REALTOR® regarding the current market conditions. This will enable them to make an informed decision that aligns with their goals and priorities.
There were 1,023 new listings added to the MLS® System in Waterloo Region last month, an increase of 18.7 per cent compared to March last year and a 15.9 per cent decrease compared to the previous ten-year average for March.
The total number of homes available for sale in active status at the end of March was 1,081 an increase of 54.0 per cent compared to March of last year and 1.1 per cent below the previous ten-year average of 1,093 listings for March.
At the end of March, there were 1.9 months of inventory, a 58.3 percent increase compared to last year and 18.8 percent above the previous 10-year average. The number of months of inventory represents how long it would take to sell off current inventories at the current sales rate.
The average number of days to sell in March was 19, the same number as March 2023. The previous 5-year average is 18 days.
These statistics provide a snapshot of the real estate market in the Waterloo Region in March, showing both positive and challenging aspects for buyers and sellers. WRAR encourages buyers to reach out to local Realtors for valuable insights about the current state of the local market and to receive tailored advice based on their specific needs.
View our HPI tool here to learn more: https://wrar.ca/hpi/


WRAR cautions that average sale price information can help identify long-term trends but should not be to indicate that specific properties have increased or decreased in value. The average sale price is calculated based on the total dollar volume of all properties sold. Months Supply is the inventory of homes for sale at the end of a given month, divided by the average monthly closed sales from the last 12 months. Those requiring specific information on property values should contact a Waterloo Region REALTOR®. REALTORS® have their fingers on the pulse of the market. They know the questions to ask, the areas to probe and what to look for so that you get a complete picture of the property and community you’re considering.
Tags: for sale, Homes For Sale, Kitchener Buyers, Kitchener Homes, kitchener-waterloo, kitchener-waterloo association of realtors, KW Market Update, Market Update, real estate, Royal Lepage Wolle Realty, the riz team, waterloo for sale, waterloo real estate, waterloo realtor, Waterloo Sellers
Posted in Enhance Your Home, Kitchener Buyers, Kitchener Sellers, Market Stats, Market Update, Real Estate News, Realtor Tips, Uncategorized, Waterloo Buyers, Waterloo Sellers | Comments Off on Kitchener Waterloo Market Snapshot March 2024
Wednesday, September 6th, 2023
Soft Home Sales in August Coupled with Strong Listing Activity
If you are considering to Sell your home or Buy a home in the next short while it would be highly beneficial for you to connect with one of our Team Agents at
Do you want to know what your home is worth today? Click Below for our Online No Obligation Market Evaluation

“Home buyers had the advantage of strong listing activity in August, which helped to provide a little more choice and temper prices,” says Bell. “But affordability remains a top concern for many who are looking to get into the market and finding it a challenge to resolve what they want with what they can afford.”
WRAR’s president points out that while market-wide, inventory levels were up 7.6 per cent in August, this was mainly due to the Townhouse/Condo segment, where inventory increased by 35.3 per cent. The property type with the most supply in the market is the condo segment with 3.3 months supply, compared to 1.8 months supply in the detached home category.
“Right now, buyers may find it easier to get into a condominium, which can be a great choice for both first time buyers, and anyone looking for a lifestyle change.”
There were 1,025 new listings added to the MLS® System in Waterloo Region last month, an increase of 9.7 per cent compared to August of last year and a 11.7 per cent increase compared to the previous ten-year average for August.
The total number of homes available for sale in active status at the end of August was 1,094, an increase of 7.6 per cent compared to August of last year and 14.9 per cent below the previous ten-year average of 1431 listings for August.
There were 2.0 months of inventory at the end of August, unchanged from the end of July and in line with the previous 10-year average. The number of months of inventory represents how long it would take to sell off current inventories at the current sales rate.
The average number of days to sell in August was 19, compared to 23 days in August 2022. The previous 5-year average is 21 days.
View our HPI tool here to learn more: https://wrar.ca/hpi/
Tags: for sale, home sales, Kitchener Buyers, kitchener real estate, kitchener-waterloo, Royal Lepage Wolle Realty, the riz team, waterloo, Waterloo Buyers, waterloo for sale, Waterloo Homes, waterloo real estate, waterloo realtor, Waterloo Sellers
Posted in Kitchener Buyers, Kitchener Sellers, Market Stats, Market Update, Real Estate News, Realtor Tips, Waterloo Buyers, Waterloo Sellers | Comments Off on Kitchener Waterloo Market Snapshot August 2023
Thursday, July 6th, 2023
Waterloo Region Real Estate Market Shows Resilience With Increase in Home Sales and Average Prices
If you are considering to Sell your home or Buy a home in the next short while it would be highly beneficial for you to connect with one of our Team Agents at
Do you want to know what your home is worth today? Click Below for our Online No Obligation Market Evaluation
Tags: buyers, for sale, Homes For Sale, Kitchener Buyers, kitchener real estate, kitchener-waterloo, Market Update, real estate market, sales representative, sellers, the riz team, waterloo for sale, Waterloo Homes, Waterloo Sellers
Posted in Kitchener Buyers, Kitchener Sellers, Market Stats, Market Update, Real Estate News, Waterloo Buyers, Waterloo Sellers | Comments Off on Kitchener Waterloo Market Snapshot June 2023