Posts Tagged ‘real estate market’
Tuesday, June 9th, 2026
“Waterloo Region is navigating one of its slowest Mays for sales in the past 15 years, yet the steady month-over-month progress since the start of the year is encouraging. A 9.8 per cent increase in sales from April, combined with a modest uptick in new listings, speaks to a market that is gradually finding its footing,” says Bill Duce, CEO of Cornerstone.
If you are considering to SELL your home or BUY a home in the next short while,
it would be highly beneficial for you to connect with one of our Team Agents at
Do you want to know what your home is worth today? Click Below for our Online No Obligation Market Evaluation:

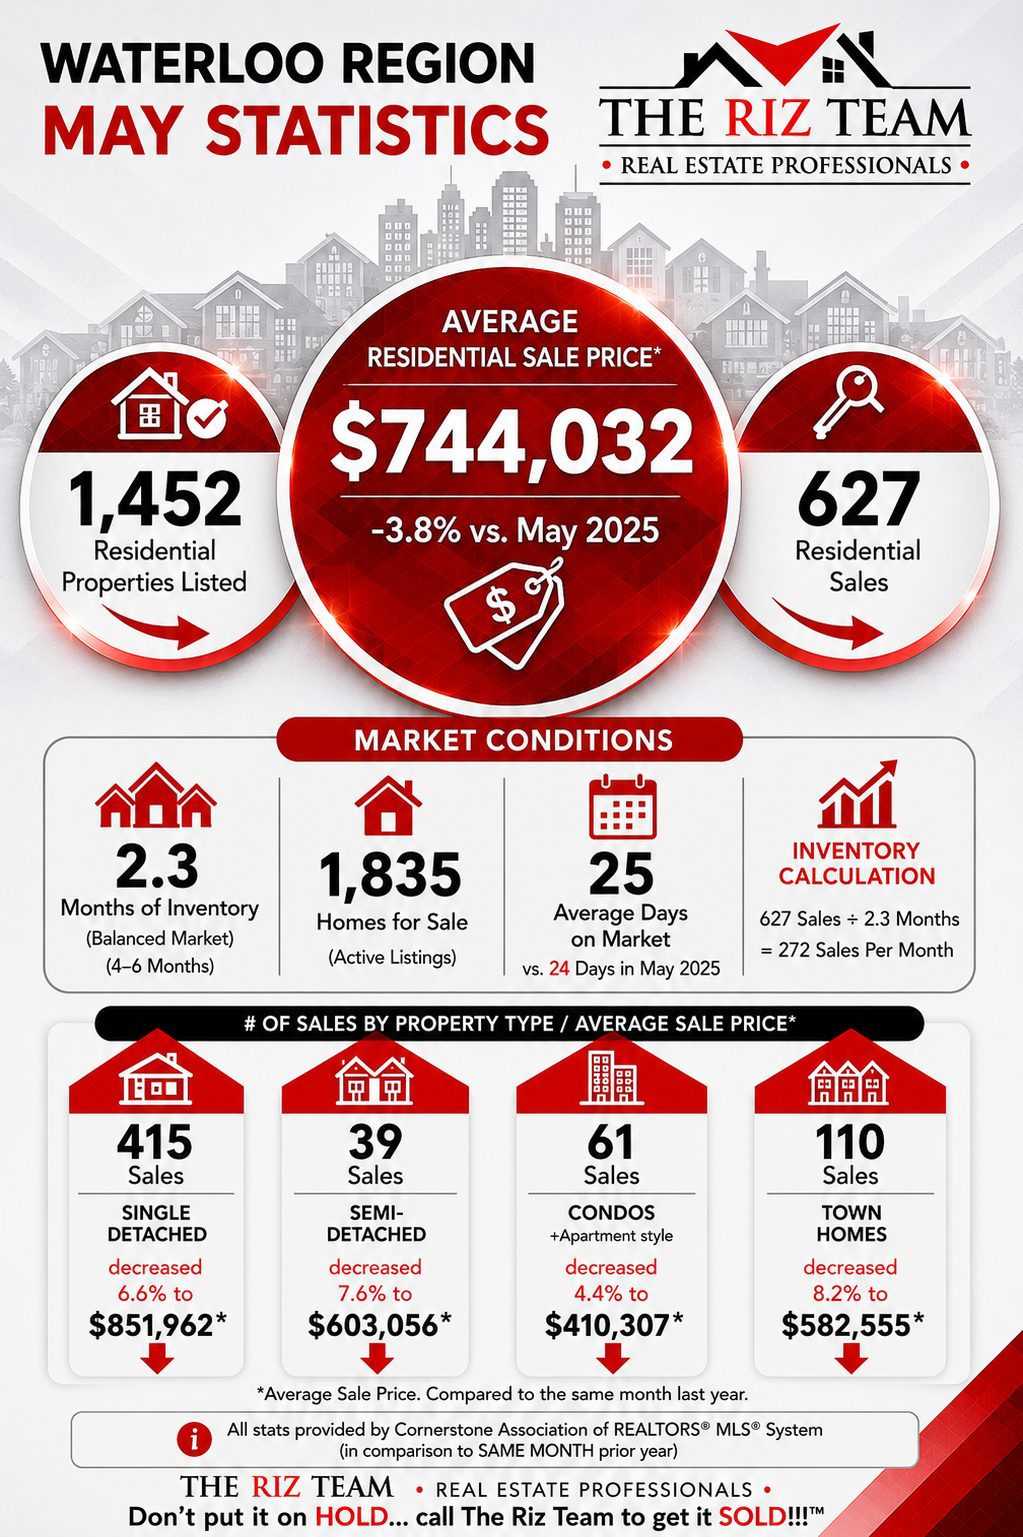
Waterloo Region May Statistics
“Waterloo Region is showing encouraging signs of spring vitality, with sales up 14.0 per cent and new listings surging nearly 28.0 per cent month-over-month. The HPI increased by 0.1 per cent and 1.5 per cent month-over-month in Kitchener-Waterloo and Cambridge, respectively. Inventory levels across the region indicate a 3.6-month supply, which is consistent with the same time last year. However, this supply is higher than the historical average. Each area within Waterloo Region performed differently in April, highlighting the importance of partnering with a local REALTOR® who understands the distinct dynamics across the region.” – Bill Duce, Cornerstone CEO
Waterloo Region Area Highlights:
- Waterloo Region home sales increased 14.0% month-over-month.
- The number of newly listed properties increased by 27.8% on a month-over-month basis.
- In Kitchener-Waterloo, the MLS® Home Price Index (HPI) increased by 0.1% month-over-month and declined 6.7% on a year-over-year basis. In Cambridge, the HPI increased by 1.5% month-over-month and was down 5.4% on a year-over-year basis.
- The supply of inventory across the market decreased 5.0% on a year-over-year basis, resulting in a 3.6-month supply of all property types by the end of April, which was similar to levels reported in April 2025.
Waterloo Region Housing Statistics
Analyze the thriving Waterloo Region real estate market, home to leading tech companies, prestigious universities, and diverse communities. Our comprehensive statistics track this dynamic market across cities, townships, and property types. click on the Cornerstone Image to access full report
Tags: buyers, for sale, Homes For Sale, Kitchener Sellers, kitchener-waterloo association of realtors, KW Market Update, Market Update, real estate, real estate market, Royal Lepage Wolle Realty, the riz team, waterloo for sale, Waterloo Sellers
Posted in Enhance Your Home, Kitchener Buyers, Market Stats, Market Update, Real Estate News, Realtor Tips, Uncategorized, Waterloo Buyers, Waterloo Sellers | Comments Off on Kitchener Waterloo Market Snapshot May 2026
Saturday, April 11th, 2026
“Sales activity in March continued to rebound month-over-month but dipped slightly on a year-over-year basis. The month of March also saw important announcements from the Federal and Ontario governments to remove the HST from most new homes, reduce development charges, and simplify the approvals process. These measures should encourage buyers to consider the new home market and support long-term supply,” says Bill Duce, CEO of Cornerstone. “Removing these fees will help more buyers enter the market, but further solutions, such as a down payment assistance program or increasing the provincial land transfer tax rebate, are needed to get more first-time buyers into the market.”
If you are considering to SELL your home or BUY a home in the next short while,
it would be highly beneficial for you to connect with one of our Team Agents at
Do you want to know what your home is worth today? Click Below for our Online No Obligation Market Evaluation:

Waterloo Region February Statistics
“Waterloo Region is showing resilience with a significant monthly increase in sales, potentially renewing seller confidence. The stable prices from January to February in Kitchener-Waterloo and a slight uptick in Cambridge HPI could signal the bottoming out of price declines we’ve seen over the past year and reflect a market adapting and finding its footing despite broader economic pressure.” – Bill Duce, Cornerstone CEO
Waterloo Region Area Highlights:
- Waterloo Region home sales increased 25.5% month-over-month.
- The number of newly listed properties decreased 1.6% on a month-over-month basis.
- In Kitchener-Waterloo, the MLS® Home Price Index (HPI) did not change month-over-month and declined 9.3% on a year-over-year basis. In Cambridge, the HPI increased 1.0% month-over-month and was down 8.2% on a year-over-year basis.
- The supply of inventory across the market decreased 8.0% on a year-over-year basis, resulting in a 2.6-month supply of all property types by the end of February, which was the same level compared to February 2025.
Waterloo Region Housing Statistics
Analyze the thriving Waterloo Region real estate market, home to leading tech companies, prestigious universities, and diverse communities. Our comprehensive statistics track this dynamic market across cities, townships, and property types. click on the Cornerstone Image to access full report
Tags: buyers, Homes For Sale, Kitchener Buyers, Kitchener Homes, kitchener-waterloo, KW Real Estate, real estate market, riz jadavji, the riz team, waterloo, Waterloo Buyers, Waterloo Homes, waterloo real estate, Waterloo Sellers
Posted in Kitchener Buyers, Kitchener Sellers, Market Stats, Market Update, Real Estate News, Realtor Tips, Uncategorized, Waterloo Buyers, Waterloo Sellers | Comments Off on Kitchener Waterloo Market Snapshot March 2026
Wednesday, June 5th, 2024
Waterloo Region Sees Dip in Home Sales Due to Sluggish Condo Market
“May saw a dip in the number of sales across all categories, with condo apartments experiencing the largest drop,” says Christal Moura, president of WRAR. “The Condo market also had the greatest supply level, posing a challenge for sellers, especially for units with one or fewer bedrooms, where the current inventory level exceeds buyer demand.”
If you are considering to Sell your home or Buy a home in the next short while it would be highly beneficial for you to connect with one of our Team Agents at
Do you want to know what your home is worth today? Click Below for our Online No Obligation Market Evaluation
WATERLOO REGION, ON (June 5, 2024) —In May, a total of 742 homes were sold via the Multiple Listing Service® (MLS®) System of the Waterloo Region Association of REALTORS® (WRAR). This represents a decrease of 8.1 per cent compared to the same period last year and a decline of 20.0 per cent compared to the average number of homes sold in the previous ten years for the same month.
“May saw a dip in the number of sales across all categories, with condo apartments experiencing the largest drop,” says Christal Moura, president of WRAR. “The Condo market also had the greatest supply level, posing a challenge for sellers, especially for units with one or fewer bedrooms, where the current inventory level exceeds buyer demand.”
Total residential sales in May included 467 detached (down 1.3 per cent from May 2023), and 134 townhouses (down 3.6 per cent). Sales also included 82 condominium units (down 34.4 per cent) and 59 semi-detached homes (down 13.2 per cent).
In May, the average sale price for all residential properties in Waterloo Region was $818,507. This represents a 0.3 per cent decrease compared to May 2023 and a 2.3 per cent increase compared to April 2024.
- The average price of a detached home was $943,859. This represents a 1.9 per cent decrease from May 2023 and an increase of 0.4 per cent compared to April 2024.
- The average sale price for a townhouse was $653,761. This represents a 6.1 per cent decrease from May 2023 and a decrease of 0.9 per cent compared to April 2024.
- The average sale price for an apartment-style condominium was $459,260. This represents a decrease of 5.6 per cent from May 2023 and a decrease of 5.6 per cent compared to April 2024.
- The average sale price for a semi was $699,780. This represents a decrease of 3.9 per cent compared to May 2023 and an increase of 5.1 per cent compared to April 2024.


“This spring, we are witnessing a significant increase in the availability of apartment-style condos, with a record high number of units on the market,” stated Moura. “At the same time, we are observing a shift in demand away from smaller-sized condo units, potentially influenced by the higher interest rates impacting investor market activity for this property type.”
There were 1,644 new listings added to the MLS® System in Waterloo Region last month, an increase of 28.9 per cent compared to May last year and a 15.8 per cent increase compared to the previous ten-year average for May.
The total number of homes available for sale in active status at the end of May was 1,741, an increase of 95.8 per cent compared to May of last year and 27.9 per cent above the previous ten-year average of 1,361 listings for May.
Market-wide inventory levels were up 93.8 per cent, with 3.1 months’ supply for all property types at the end of May. The property type that gained the most inventory was the condo apartment segment, which increased by 100 percent. That amounts to 6.0 months’ supply for condo apartments, 2.4 months for detached homes, and 3.6 months for Townhouses. The number of months of inventory represents the amount of time it would take to sell off current inventories at the current sales rate.
The average number of days to sell in May was 16, compared to 14 days in May 2023. The previous 5-year average is 15 days.
The President of WRAR emphasizes the importance of consulting a local REALTOR® when considering buying or selling property in the Waterloo Region. Their expertise can provide valuable insights into the current market conditions, enabling individuals to make well-informed decisions aligned with their goals and preferences.


WRAR cautions that average sale price information can help identify long-term trends but should not be to indicate that specific properties have increased or decreased in value. The average sale price is calculated based on the total dollar volume of all properties sold. Months Supply is the inventory of homes for sale at the end of a given month, divided by the average monthly closed sales from the last 12 months. Those requiring specific information on property values should contact a Waterloo Region REALTOR®. REALTORS® have their fingers on the pulse of the market. They know the questions to ask, the areas to probe and what to look for so that you get a complete picture of the property and community you’re considering.
Tags: buyers, for sale, home sales, Homes For Sale, kitchener real estate, KW Market Update, Market Update, real estate, real estate market, riz jadavji, rizsellskw.com, Royal Lepage Wolle Realty, sales representative, the riz team, Waterloo Buyers, waterloo real estate, Waterloo Sellers
Posted in Kitchener Buyers, Kitchener Sellers, Market Stats, Market Update, Real Estate News, Waterloo Buyers, Waterloo Sellers | Comments Off on Kitchener Waterloo Market Snapshot May 2024
Friday, May 3rd, 2024
Waterloo Region Sees Slight Sales Growth in April Alongside a Strong Increase in Homes for Sale
“The real estate market appeared to be well-balanced last month,” says Christal Moura, president of WRAR. “The market experienced a slight increase in home sales and moderate price fluctuations. Additionally, the number of homes for sale reached an eight-year high for the month of April, which translates to more available options for potential buyers.” read more below
If you are considering to Sell your home or Buy a home in the next short while it would be highly beneficial for you to connect with one of our Team Agents at
Do you want to know what your home is worth today? Click Below for our Online No Obligation Market Evaluation
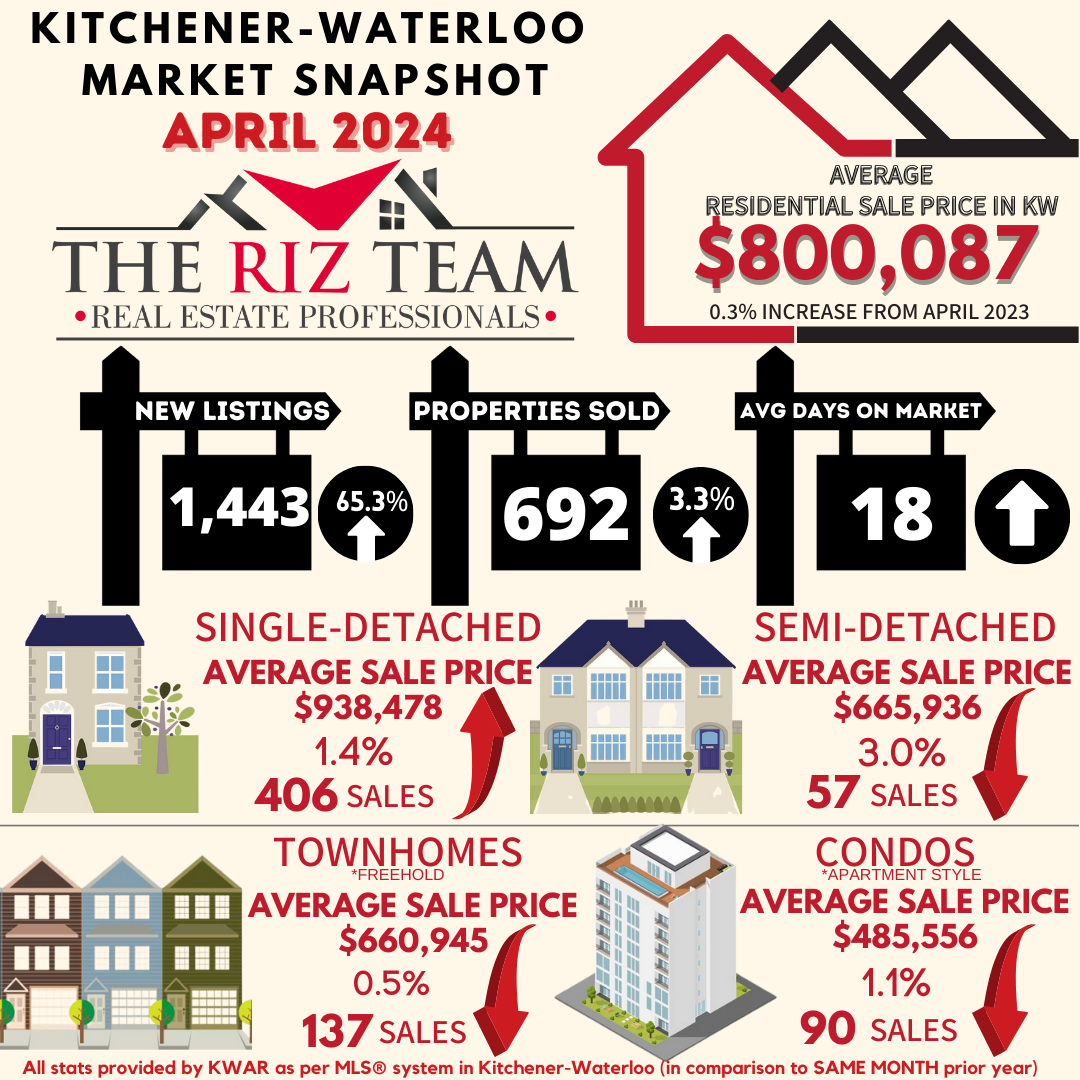
WATERLOO REGION, ON (May 3, 2024) —In April, a total of 692 homes were sold via the Multiple Listing Service® (MLS®) System of the Waterloo Region Association of REALTORS® (WRAR). This represents an increase of 3.3% compared to the same period last year and a decline of 12.3% compared to the average number of homes sold in the previous 5 years for the same month.
“The real estate market appeared to be well-balanced last month,” says Christal Moura, president of WRAR. “The market experienced a slight increase in home sales and moderate price fluctuations. Additionally, the number of homes for sale reached an eight-year high for the month of April, which translates to more available options for potential buyers.”
Total residential sales in April included 406 detached (up 0.5 per cent from April 2023), and 137 townhouses (up 15.1 per cent). Sales also included 90 condominium units (down 5.3 per cent) and 57 semi-detached homes (up 11.8 per cent).
In April, the average sale price for all residential properties in Waterloo Region was $800,087. This represents a 0.3 per cent increase compared to April 2023 and a 0.7 per cent decrease compared to March 2024.
- The average price of a detached home was $938,478. This represents a 1.4 per cent increase from April 2023 and a decrease of 1.8 per cent compared to March 2024.
- The average sale price for a townhouse was $660,945. This represents a 0.5 per cent decrease from April 2023 and a decrease of 0.8 per cent compared to March 2024.
- The average sale price for an apartment-style condominium was $485,556. This represents a decrease of 1.1 per cent from April 2023 and an increase of 0.5 per cent compared to March 2024.
- The average sale price for a semi was $665,936. This represents a decrease of 3.0 per cent compared to April 2023 and a decrease of 2.1 per cent compared to March 2024.


WRAR cautions that average sale price information can help identify long-term trends but should not be to indicate that specific properties have increased or decreased in value. The average sale price is calculated based on the total dollar volume of all properties sold. Months Supply is the inventory of homes for sale at the end of a given month, divided by the average monthly closed sales from the last 12 months. Those requiring specific information on property values should contact a Waterloo Region REALTOR®. REALTORS® have their fingers on the pulse of the market. They know the questions to ask, the areas to probe and what to look for so that you get a complete picture of the property and community you’re considering.
Tags: buyers, for sale, home for sale, KW Market Update, Market Update, real estate, real estate market, riz jadavji, rizsellskw.com, Royal Lepage Wolle Realty, sales representative, the riz team, Waterloo Buyers, waterloo real estate, Waterloo Sellers
Posted in Kitchener Buyers, Kitchener Sellers, Market Stats, Market Update, Real Estate News, Waterloo Buyers, Waterloo Sellers | Comments Off on Kitchener Waterloo Market Snapshot April 2024
Tuesday, March 5th, 2024
Waterloo Region Home Sales Sluggish in February, Prices Steady
If you are considering to Sell your home or Buy a home in the next short while it would be highly beneficial for you to connect with one of our Team Agents at
Do you want to know what your home is worth today? Click Below for our Online No Obligation Market Evaluation
Tags: buyers, for sale, Homes For Sale, KW Market Update, Market Update, real estate, real estate market, realtor, riz jadavji, rizsellskw.com, Royal Lepage Wolle Realty, sales representative, the riz team, Waterloo Buyers, waterloo real estate, Waterloo Sellers
Posted in Kitchener Buyers, Kitchener Sellers, Market Stats, Market Update, Real Estate News, Realtor Tips, Waterloo Buyers, Waterloo Sellers | Comments Off on Kitchener Waterloo Market Snapshot February 2024
Friday, February 2nd, 2024
Waterloo Region’s Housing Market Shows Signs of Improvement in January
If you are considering to Sell your home or Buy a home in the next short while it would be highly beneficial for you to connect with one of our Team Agents at
Do you want to know what your home is worth today? Click Below for our Online No Obligation Market Evaluation
“We are optimistic that this year will have more stability than last,” says Moura. “With the Bank of Canada holding steady at a 5.0% benchmark interest rate, they recognize the overall economy has slowed down. However, housing is a key metric, and we expect the Bank to maintain a balanced response so long as housing continues with moderate growth in 2024 rather than any dramatic increases.”
President Moura points out that navigating shifting markets is a challenge and encourages consumers to work with a local REALTOR to ensure they receive the depth of local market knowledge required to protect their interests.
There was 720 new listings added to the MLS® System in Waterloo Region last month, an increase of 23.5 per cent compared to January last year and a 3.9 per cent decrease compared to the previous ten-year average for January.
The total number of homes available for sale in active status at the end of January was 855 an increase of 33.4 per cent compared to January of last year and 1.2 per cent below the previous ten-year average of 865 listings for January.
At the end of January, there were 1.5 months of inventory, a 50.0 percent increase compared to last year and 15.4 percent above the previous 10-year average. The number of months of inventory represents how long it would take to sell off current inventories at the current sales rate.
“With the exception of condo apartment property types, we saw mostly yearly and monthly price gains across the housing types,” says Moura. “This is because there is more supply in the condo segment (2.8 months) compared to the other property types.”
The average number of days to sell in January was 33, compared to 25 days in January 2023. The previous 5-year average is 20 days.
These statistics provide a snapshot of the real estate market in the Waterloo Region in January, showing both positive and challenging aspects for buyers and sellers. WRAR encourages buyers to reach out to local Realtors for valuable insights about the current state of the local market and to receive tailored advice based on their specific needs.
View our HPI tool here to learn more: https://wrar.ca/hpi/
WRAR cautions that average sale price information can help identify long-term trends but should not be to indicate that specific properties have increased or decreased in value. The average sale price is calculated based on the total dollar volume of all properties sold. Months Supply is the inventory of homes for sale at the end of a given month, divided by the average monthly closed sales from the last 12 months. Those requiring specific information on property values should contact a Waterloo Region REALTOR®. REALTORS® have their fingers on the pulse of the market. They know the questions to ask, the areas to probe and what to look for so that you get a complete picture of the property and community you’re considering.
Tags: buyers, for sale, kitchener for sale, kitchener real estate, kitchener-waterloo, kitchener-waterloo association of realtors, real estate market, riz jadavji, Royal Lepage Wolle Realty, sales representative, the riz team, Waterloo Buyers, Waterloo Homes, waterloo real estate, Waterloo Sellers
Posted in Kitchener Buyers, Kitchener Sellers, Market Stats, Market Update, Real Estate News, Realtor Tips, Waterloo Buyers, Waterloo Sellers | Comments Off on Kitchener Waterloo Market Snapshot January 2024
Thursday, July 6th, 2023
Waterloo Region Real Estate Market Shows Resilience With Increase in Home Sales and Average Prices
If you are considering to Sell your home or Buy a home in the next short while it would be highly beneficial for you to connect with one of our Team Agents at
Do you want to know what your home is worth today? Click Below for our Online No Obligation Market Evaluation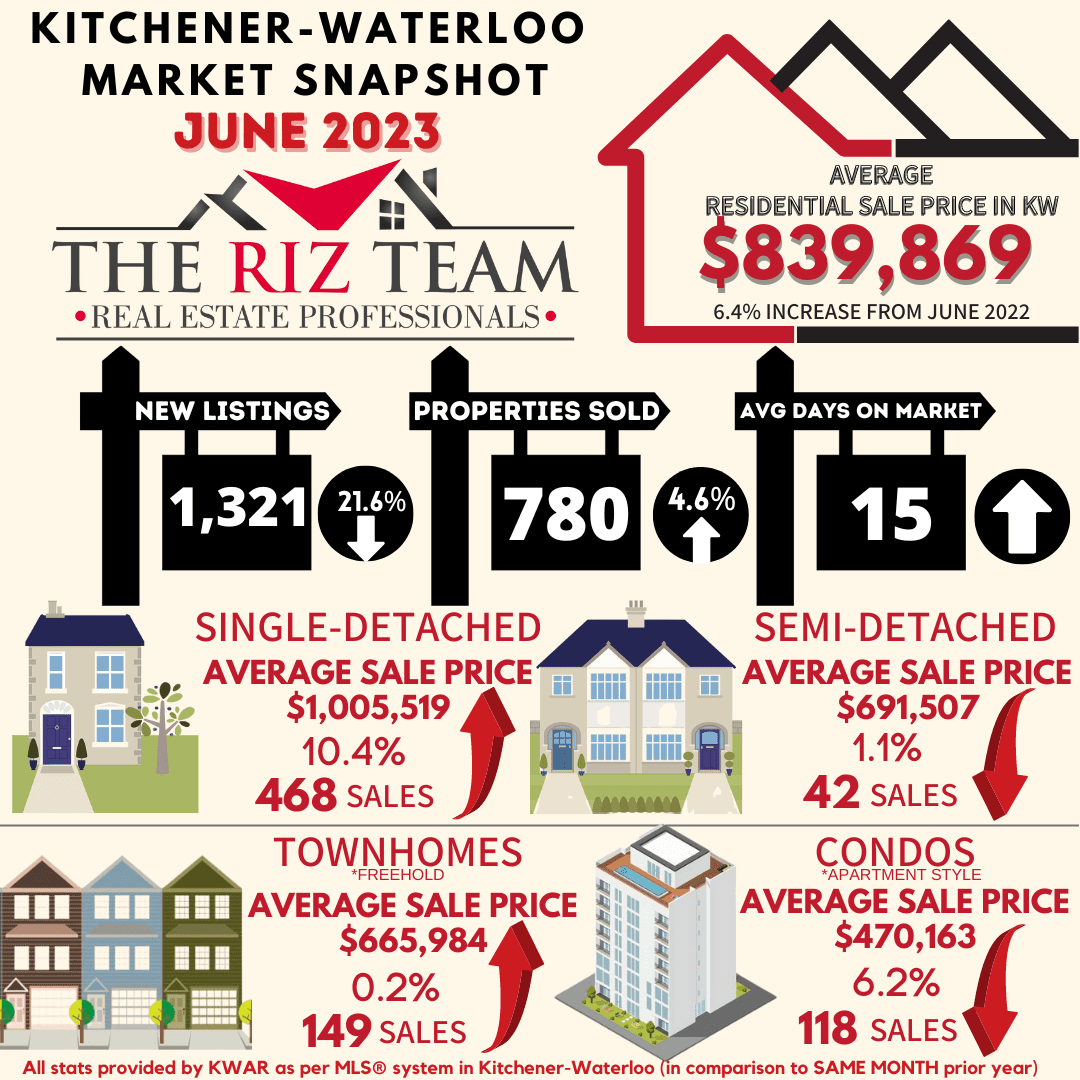
Tags: buyers, for sale, Homes For Sale, Kitchener Buyers, kitchener real estate, kitchener-waterloo, Market Update, real estate market, sales representative, sellers, the riz team, waterloo for sale, Waterloo Homes, Waterloo Sellers
Posted in Kitchener Buyers, Kitchener Sellers, Market Stats, Market Update, Real Estate News, Waterloo Buyers, Waterloo Sellers | Comments Off on Kitchener Waterloo Market Snapshot June 2023
Wednesday, April 5th, 2023
Home Prices Inch Up in March as We Enter the Spring Market
If you are considering to Sell your home or Buy a home in the next short while it would be highly beneficial for you to connect with one of our Team Agents at
Do you want to know what your home is worth today? Click Below for our Online No Obligation Market Evaluation
WATERLOO REGION, ON (April 5, 2023) — Sales volume through the Multiple Listing Service® (MLS®) System of the Waterloo Region Association of REALTORS® (WRAR) set another low last month, with 611 homes sold in March, representing a decrease of 38.4 per cent compared to March 2022 and 33.6 per cent below the previous 5-year average for the month.
Tags: buyers, Homes For Sale, kitchener-waterloo association of realtors, KW Market Update, real estate market, Royal Lepage Wolle Realty, sales representative, the riz team, Waterloo Buyers, waterloo for sale, Waterloo Homes, waterloo realtor, Waterloo Sellers
Posted in Kitchener Buyers, Kitchener Sellers, Market Stats, Market Update, Real Estate News, Waterloo Buyers, Waterloo Sellers | Comments Off on Kitchener Waterloo Market Snapshot March 2023
Friday, March 3rd, 2023
Home Sales Down, Prices Stabilizing in February
If you are considering to Sell your home or Buy a home in the next short while it would be highly beneficial for you to connect with one of our Team Agents at
Do you want to know what your home is worth today? Click Below for our Online No Obligation Market Evaluation
Tags: buyers, Kitchener Buyers, Kitchener Sellers, kitchener-waterloo, Market Update, real estate market, riz jadavji, royal lepage, Royal Lepage Wolle Realty, the riz team, Waterloo Buyers, waterloo real estate, Waterloo Sellers
Posted in Kitchener Buyers, Kitchener Sellers, Market Stats, Market Update, Real Estate News, Realtor Tips, Waterloo Buyers, Waterloo Sellers | Comments Off on Kitchener Waterloo Market Snapshot February 2023
Friday, December 2nd, 2022
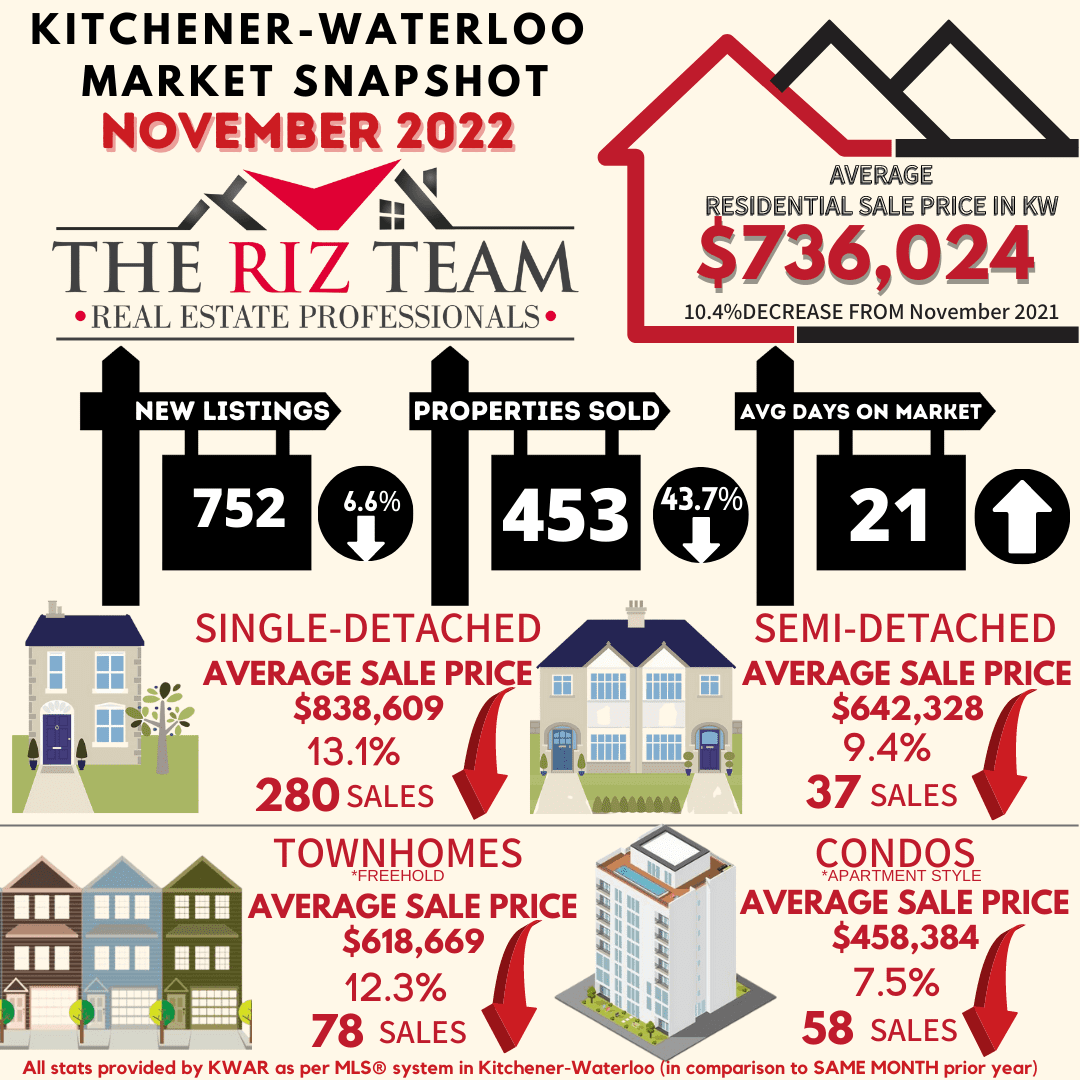
Waterloo Region Home Prices Continue to Cool in November
“Home sales continued to decrease in November, as they traditionally do at this time of year,” “At the same time, we know ever-increasing homeownership costs are contributing to the decline and putting downward pressure on sales prices which have plateaued since July.”
If you are considering to Sell your home or Buy a home in the next short while it would be highly beneficial for you to connect with one of our Team Agents at
Do you want to know what your home is worth today? Click Below for our Online No Obligation Market Evaluation
“The Waterloo Region market has been moving towards more of a balanced market throughout the latter part of the year, and November followed that trend,” says Bell. “We have a long way to go before the pendulum swings into it being a buyer’s market. However, if the Bank of Canada yet again raises its key interest rate on December 7, it is likely to result in fewer buyers competing for more inventory.”
There were 752 new listings added to the MLS® System in the Waterloo Region last month, a decrease of 6.6 per cent compared to November of last year and a 1.3 per cent increase compared to the previous ten-year average for November.
The total number of homes available for sale in active status at the end of November was 860, an increase of 209.4 per cent compared to November of last year and 29.9 per cent below the previous ten-year average of 1227 listings for November.
The number of months of inventory is up 333.3 per cent compared to November of last year, but still historically low at 1.3 months. Between 2009 and 2015, November’s average months of inventory was 3.2 months. The number of months of inventory represents how long it would take to sell off current inventories at the current sales rate.
The average number of days to sell in November was 21, compared to 10 days in November 2021. The previous 5-year average is 21 days.
WRAR’s president says, “It has never been more important for both buyers and sellers to work with a REALTOR® to help provide expertise during the homebuying and selling process. Affordability, combined with ongoing supply constraints, are making it difficult for buyers to navigate the continuous market changes while sellers are also having to adjust in concurrence with the evolving circumstances”.
Those requiring specific information on property values should contact a local REALTOR®. Working with a Realtor is the best way to get a complete picture of the property and community you are considering.
View our HPI tool here to learn more: https://wrar.ca/hpi/
Tags: buyers, for sale, Homes For Sale, Kitchener Buyers, kitchener for sale, kitchener real estate, kitchener-waterloo, kitchener-waterloo association of realtors, real estate market, Royal Lepage Wolle Realty, sales representative, Waterloo Buyers, waterloo real estate, waterloo realtor, Waterloo Sellers
Posted in Kitchener Buyers, Kitchener Sellers, Market Stats, Market Update, Real Estate News, Waterloo Buyers, Waterloo Sellers | Comments Off on Kitchener Waterloo Market Snapshot November 2022