Kitchener Waterloo Market Snapshot November 2022
Friday, December 2nd, 2022Waterloo Region Home Prices Continue to Cool in November
“Home sales continued to decrease in November, as they traditionally do at this time of year,” “At the same time, we know ever-increasing homeownership costs are contributing to the decline and putting downward pressure on sales prices which have plateaued since July.”
If you are considering to Sell your home or Buy a home in the next short while it would be highly beneficial for you to connect with one of our Team Agents at
The Riz Team
Do you want to know what your home is worth today? Click Below for our Online No Obligation Market Evaluation
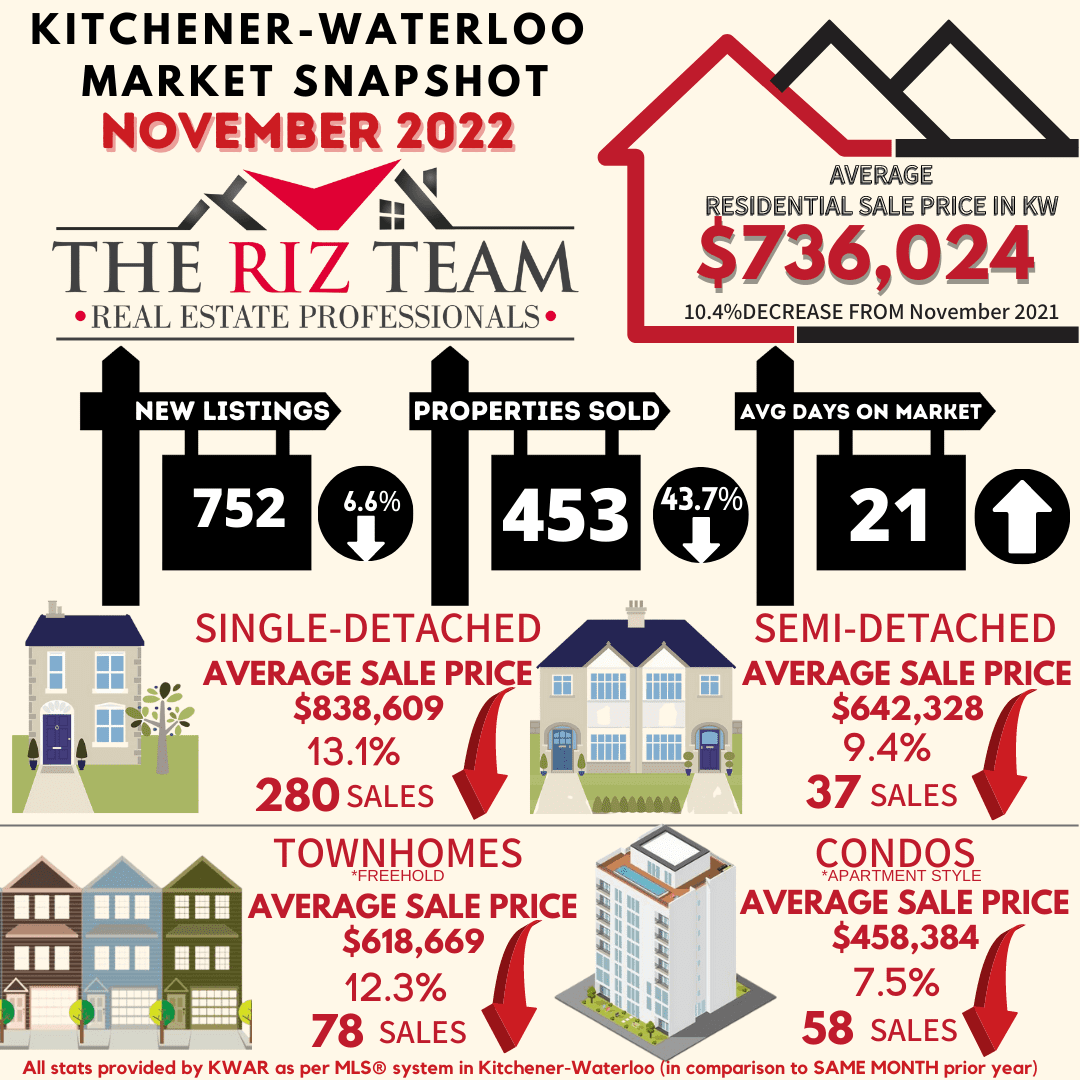
WATERLOO REGION, ON (December 2, 2022) —The number of homes sold through the Multiple Listing Service® (MLS®) System of the Waterloo Region Association of REALTORS® (WRAR) totaled 453 units, a decrease of 43.7 per cent compared to November 2021 and 34.2 per cent below the previous 5-year average for the month.
Total residential sales in November included 280 detached (down 38.3 per cent from November 2021), and 78 townhouses (down 57.1 per cent). Sales also included 58 condominium units (down 49.6 per cent) and 37 semi-detached homes (down 28.8 per cent).
“Home sales continued to decrease in November, as they traditionally do at this time of year,” says Megan Bell, President of WRAR. “At the same time, we know ever-increasing homeownership costs are contributing to the decline and putting downward pressure on sales prices which have plateaued since July.”
In November, the average sale price for all residential properties in Waterloo Region was $736,024. This represents a 10.4 per cent decrease compared to November 2021 and a 3.6 per cent decrease compared to October 2022.
- The average price of a detached home was $838,609. This represents a 13.1 per cent decrease from November 2021 and a decrease of 3.5 per cent compared to October 2022.
- The average sale price for a townhouse was $618,669. This represents a 12.3 per cent decrease from November 2021 and a decrease of 2.6 per cent compared to October 2022.
- The average sale price for an apartment-style condominium was $458,384. This represents a decrease of 7.5 per cent from November 2021 and a decrease of 6.2 per cent compared to October 2022.
- The average sale price for a semi was $642,328. This represents a decrease of 9.4 per cent compared to November 2021 and an increase of 3.2 per cent compared to October 2022.
WRAR cautions that average sale price information can be useful in establishing long-term trends but should not be used as an indicator that specific properties have increased or decreased in value. The MLS® Home Price Index (HPI) provides the best way to gauge price trends because averages are strongly distorted by changes in the mix of sales activity from one month to the next.

| MLS® Home Price Index Benchmark Price | ||||||
| Kitchener-Waterloo | Cambridge | |||||
| Benchmark Type: | November 2022 | Monthly % Change | Yr./Yr. % Change | November 2022 |
Monthly % Change |
Yr./Yr. % Change |
| Composite | $711,200 | -1.7 | -12.8 | $744,200 | 1.8 | -10.6 |
| Detached | $791,000 | -2.1 | -14.8 | $770,600 | 2.5 | -12.0 |
| Townhouse | $602,200 | -0.2 | -7.0 | $652,000 | -1.7 | -2.0 |
| Apartment | $492,600 | -0.4 | 8.0 | $504,100 | -3.1 | 3.7 |

“The Waterloo Region market has been moving towards more of a balanced market throughout the latter part of the year, and November followed that trend,” says Bell. “We have a long way to go before the pendulum swings into it being a buyer’s market. However, if the Bank of Canada yet again raises its key interest rate on December 7, it is likely to result in fewer buyers competing for more inventory.”
There were 752 new listings added to the MLS® System in the Waterloo Region last month, a decrease of 6.6 per cent compared to November of last year and a 1.3 per cent increase compared to the previous ten-year average for November.
The total number of homes available for sale in active status at the end of November was 860, an increase of 209.4 per cent compared to November of last year and 29.9 per cent below the previous ten-year average of 1227 listings for November.
The number of months of inventory is up 333.3 per cent compared to November of last year, but still historically low at 1.3 months. Between 2009 and 2015, November’s average months of inventory was 3.2 months. The number of months of inventory represents how long it would take to sell off current inventories at the current sales rate.
The average number of days to sell in November was 21, compared to 10 days in November 2021. The previous 5-year average is 21 days.
WRAR’s president says, “It has never been more important for both buyers and sellers to work with a REALTOR® to help provide expertise during the homebuying and selling process. Affordability, combined with ongoing supply constraints, are making it difficult for buyers to navigate the continuous market changes while sellers are also having to adjust in concurrence with the evolving circumstances”.
Those requiring specific information on property values should contact a local REALTOR®. Working with a Realtor is the best way to get a complete picture of the property and community you are considering.
View our HPI tool here to learn more: https://wrar.ca/hpi/
Click on any of the graphs below for an interactive view.


WRAR cautions that average sale price information can help identify long-term trends but should not be to indicate that specific properties have increased or decreased in value. The average sale price is calculated based on the total dollar volume of all properties sold. Months Supply is the inventory of homes for sale at the end of a given month, divided by the average monthly closed sales from the last 12 months. Those requiring specific information on property values should contact a Waterloo Region REALTOR®. REALTORS® have their fingers on the pulse of the market. They know the questions to ask, the areas to probe and what to look for so that you get a complete picture of the property and community you’re considering.
Tags: buyers, for sale, Homes For Sale, Kitchener Buyers, kitchener for sale, kitchener real estate, kitchener-waterloo, kitchener-waterloo association of realtors, real estate market, Royal Lepage Wolle Realty, sales representative, Waterloo Buyers, waterloo real estate, waterloo realtor, Waterloo Sellers
Posted in Kitchener Buyers, Kitchener Sellers, Market Stats, Market Update, Real Estate News, Waterloo Buyers, Waterloo Sellers | Comments Off on Kitchener Waterloo Market Snapshot November 2022