Kitchener-Waterloo Market Snapshot June 2021
Tuesday, July 6th, 2021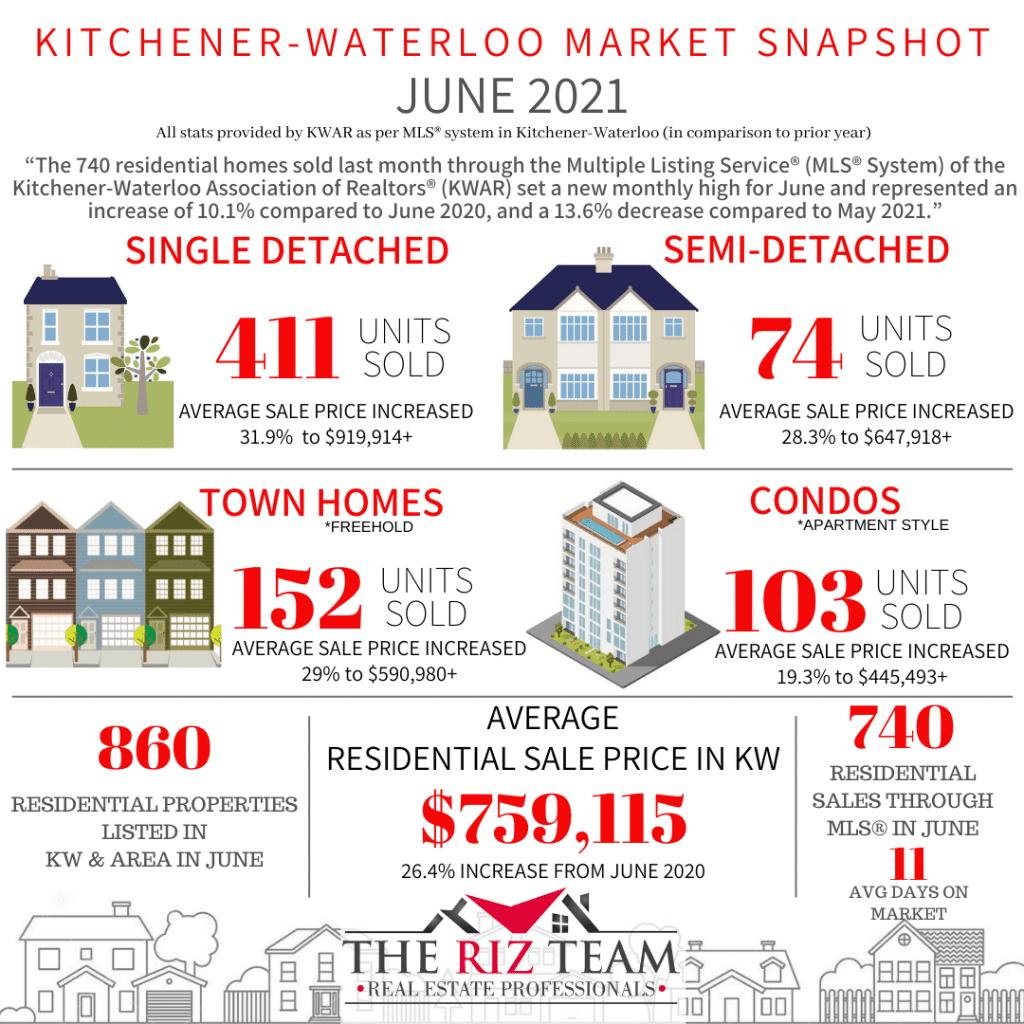
Number of Home Sales Set New June Record
KITCHENER-WATERLOO, ON (July 6, 2021) –– The 740 residential homes sold last month through the Multiple Listing Service® (MLS® System) of the Kitchener-Waterloo Association of REALTORS® (KWAR) set a new monthly high for June and represented an increase of 10.1 per cent compared to June 2020, and a 13.6 per cent decrease compared to May 2021.
“The number of homes sold in the Kitchener-Waterloo area these past 6 months surpasses any previous 6 months of activity through our MLS® System,” says Nicole Pohl, President of KWAR. “Since the beginning of the year, we have reported 4,393 home sales in Kitchener-Waterloo and area, which is remarkable.”
Total residential sales during this second quarter (April, May, June) are up 83.7 per cent compared to last year. On a year-to-date basis, they are up 65.7 per cent.
Total residential sales in June included 411 detached (down 0.2 per cent from June 2020), and 103 condominium units (up 51.5 per cent). Sales also included 74 semi-detached homes (on par) and 152 townhouses (up 14.3 per cent).
In June, the average sale price for all residential properties in the Kitchener-Waterloo area was $759,115. This represents a 26.4 per cent increase over June 2020 and a 2.6 per cent increase compared to May 2021.
-
-
- The average price of a detached home was $919,914. This represents a 31.9 per cent increase from June 2020 and an increase of 5.9 per cent compared to May 2021.
- The average sale price for an apartment-style condominium was $445,493. This represents an increase of 19.3 per cent from June 2020 and a decrease of 2.3 per cent compared to May 2021.
- The average sale price for a townhouse was $590,980. This represents a 29 per cent increase from June 2020 and a decrease of 1.9 per cent compared to May 2021.
- The average sale price for a semi was $647,918. This represents an increase of 28.3 per cent compared to June 2020 and a decrease of 1.8 per cent compared to May 2021.
-

KWAR cautions that average sale price information can be useful in establishing long-term trends but should not be used as an indicator that specific properties have increased or decreased in value. The MLS® Home Price Index (HPI) provides the best way to gauge price trends because averages are strongly distorted by changes in the mix of sales activity from one month to the next.
The MLS® HPI composite benchmark price for all residential properties in Kitchener-Waterloo was $745,800 in June. This represents a 32.1 per cent increase over June 2020 and a 0.4 per cent decrease compared to May 2021.
The benchmark price for a detached home was $820,800. This represents a 32.7 per cent increase from June 2020 and 0.6 per cent increase compared to May 2021.
-
-
- The benchmark price for an apartment-style condominium was $373,400. This represents a 17 per cent increase from June 2020 and a 0.1 per cent decrease compared to May 2021.
- The benchmark price for a townhouse is $566,900. This represents a 45 per cent increase from June 2020 and a 1.4 per cent decrease compared to May 2021.
-

“The greatest challenge of the housing market continues to be the limited supply of existing homes to purchase,” says Pohl. “What we could use right now is for more homes to get built to help meet the robust buyer demand which continues to exceed supply.”
There were 860 new listings added to the MLS® System in KW and area last month, a decrease of 6.6 per cent compared to June of last year, and a 5.4 per cent decrease compared to the previous ten-year average for June.
The total number of homes available for sale in active status at the end of June was 365, a decrease of 43 per cent compared to June of last year, and 73.9 per cent below the previous ten-year average of 1,400 listings for June.
The number of months of inventory was 0.5 in June, a decline from 0.7 months in May. Inventory has numbered less than 1 month since October. The number of months of inventory represents how long it would take to sell off current inventories at the current rate of sales.
The average number of days to sell in June was 11 days, compared to 17 days in June 2020 and a previous 5-year average of 20 days.
Those requiring specific information on property values should contact a local REALTOR®. Working with a Realtor is the best way to get a complete picture of the property and community you are considering.
View our HPI tool here to learn more: https://kwar.ca/hpi-dashboard
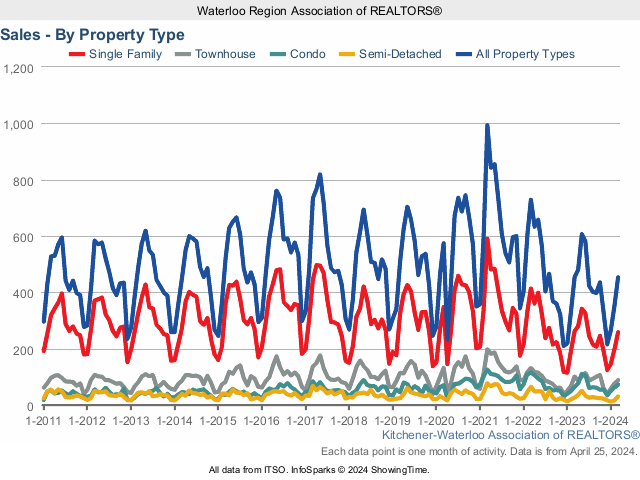
Historical Sales By Property Type
Months Supply of Homes for Sale

Historical Median Sales Price – By Property Type

Historical Average Sales Price – By Property Type