Kitchener-Waterloo Market Snapshot July 2021
Thursday, August 5th, 2021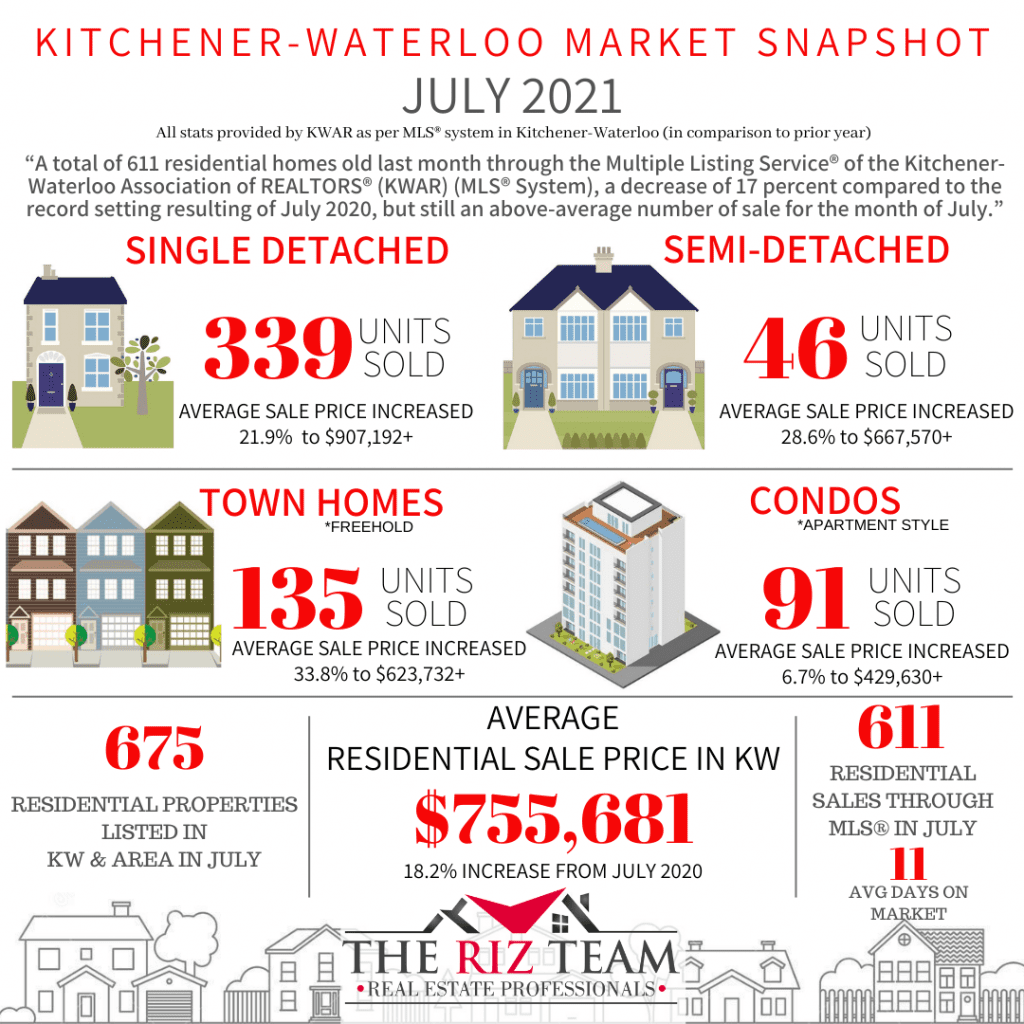
VERY LOW INVENTORY COMBINED WITH STRONG DEMAND KEEPS HOME PRICES HUMMING IN JULY
“Although home sales slowed down to some degree in July compared to June, overall demand remains very strong,” says Nicole Pohl, President of KWAR. “The current inventory of homes available for sale in the Kitchener-Waterloo and area is extremely low, making Waterloo Region one of the most competitive markets in Ontario.”
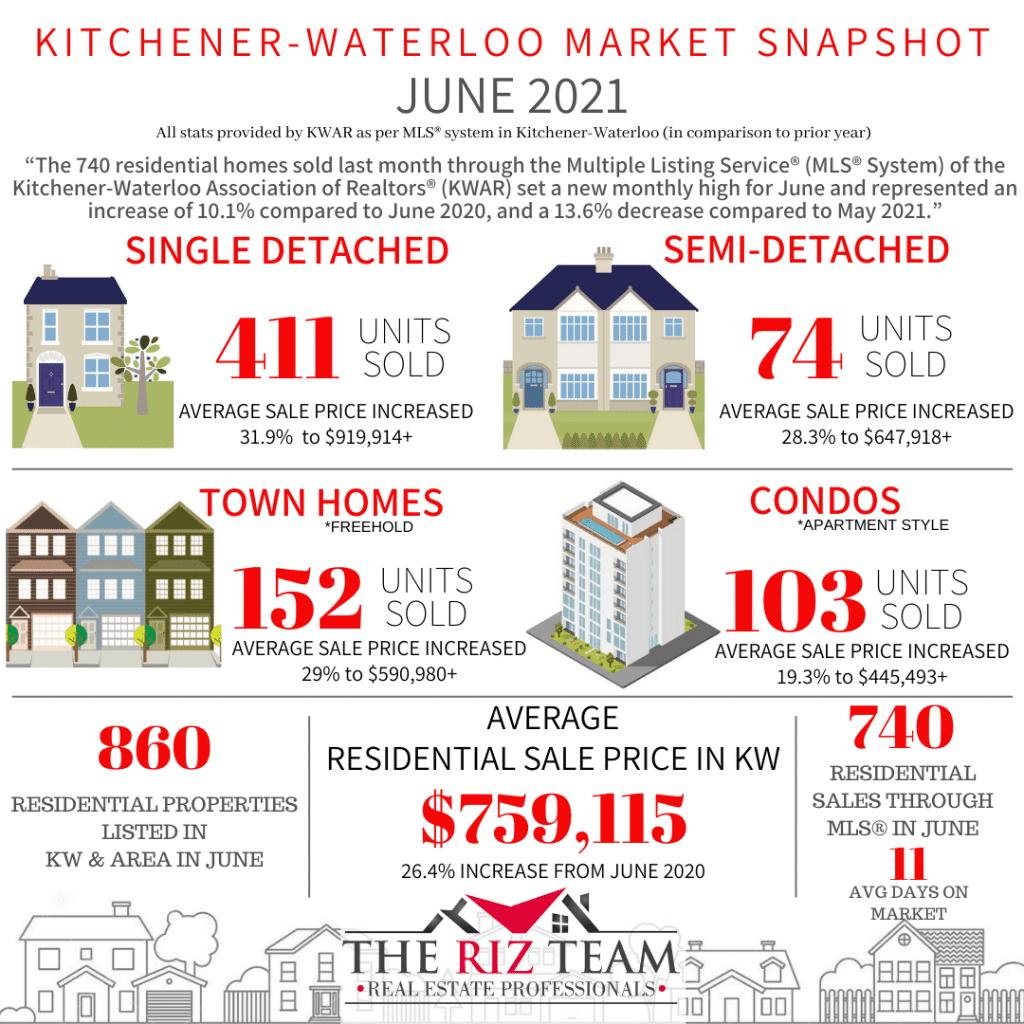
Total residential sales in July included 339 detached (down 27.1 per cent from July 2020), and 91 condominium units (up 30 per cent). Sales also included 46 semi-detached homes (down 4.2) and 135 townhouses (down 11.8 per cent).
In July, the average sale price for all residential properties in the Kitchener-Waterloo area was $755,681. This represents a 18.2 per cent increase over July 2020 and a 0.6 per cent decrease compared to June 2021.
-
-
- The average price of a detached home was $907,192. This represents a 21.9 per cent increase from July 2020 and a decrease of 1.4 per cent compared to June 2021.
-
- The average sale price for an apartment-style condominium was $429,630. This represents an increase of 6.7 per cent from July 2020 and a decrease of 3.6 per cent compared to June 2021.
-
- The average sale price for a townhouse was $623,732. This represents a 33.8 per cent increase from July 2020 and an increase of 5.4 per cent compared to June 2021.
-
- The average sale price for a semi was $667,570. This represents an increase of 28.6 per cent compared to July 2020 and an increase of 2.9 per cent compared to June 2021.
-

KWAR cautions that average sale price information can be useful in establishing long-term trends but should not be used as an indicator that specific properties have increased or decreased in value. The MLS® Home Price Index (HPI) provides the best way to gauge price trends because averages are strongly distorted by changes in the mix of sales activity from one month to the next.
The MLS® HPI composite benchmark price for all residential properties in Kitchener-Waterloo was $748,700 in July. This represents a 30.5 per cent increase over July 2020 and a 0.4 per cent increase compared to June 2021.
- The benchmark price for a detached home was $822,300. This represents a 31.1 per cent increase from July 2020 and 0.2 per cent increase compared to June 2021.
- The benchmark price for an apartment-style condominium was $385,900. This represents a 19.5 per cent increase from July 2020 and a 3.3 per cent increase compared to June 2021.
- The benchmark price for a townhouse is $564,500. This represents a 40 per cent increase from July 2020 and a 0.4 per cent decrease compared to June 2021.

“The housing market took a bit of a breather last month,” notes Pohl. “July is typically a quieter month with families taking vacation, and with the region coming out of lockdown there were certainly more staycations happening. But we do anticipate the market will pick up steam again and it will be another busy fall.”
There were 675 new listings added to the MLS® System in KW and area last month, a decrease of 24 per cent compared to July of last year, and a 14.4 per cent decrease compared to the previous ten-year average for July.
The total number of homes available for sale in active status at the end of July was 281, a decrease of 52.7 per cent compared to July of last year, and 79.1 per cent below the previous ten-year average of 1,346 listings for July.
The number of months of inventory was 0.4 in July, a decline from 0.5 months in June. Inventory has numbered less than 1 month since October. The number of months of inventory represents how long it would take to sell off current inventories at the current rate of sales.
The average number of days to sell in July was 11 days, compared to 17 days in July 2020 and a previous 5-year average of 22 days.
Those requiring specific information on property values should contact a local REALTOR®. Working with a Realtor is the best way to get a complete picture of the property and community you are considering.
View our HPI tool here to learn more: https://kwar.ca/hpi-dashboard
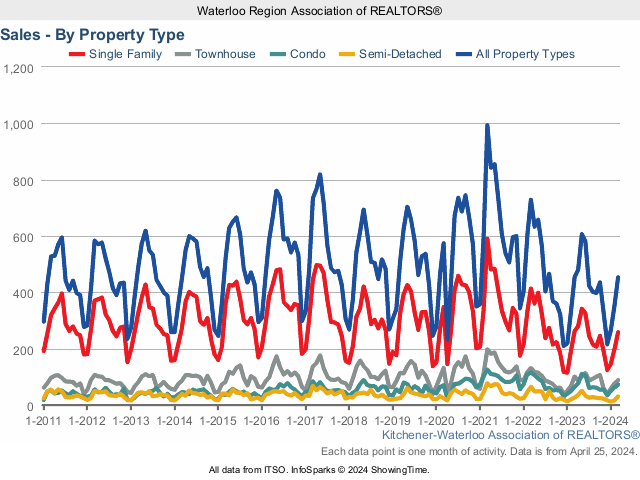
Historical Sales By Property Type

Months Supply of Homes for Sale

Historical Median Sales Price – By Property Type

Historical Average Sales Price – By Property Type


KWAR cautions that average sale price information can be useful in establishing long-term trends but should not be used as an indicator that specific properties have increased or decreased in value. The average sale price is calculated based on the total dollar volume of all properties sold. Months Supply is the inventory of homes for sale at the end of a given month, divided by the average monthly closed sales from the last 12 months Those requiring specific information on property values should contact a local REALTOR®. REALTORS® have their fingers on the pulse of the market. They know the questions to ask, the areas to probe and what to look for so that you get a complete picture of the property and community you’re considering.