Kitchener-Waterloo Market Snapshot November 2021
Friday, December 3rd, 2021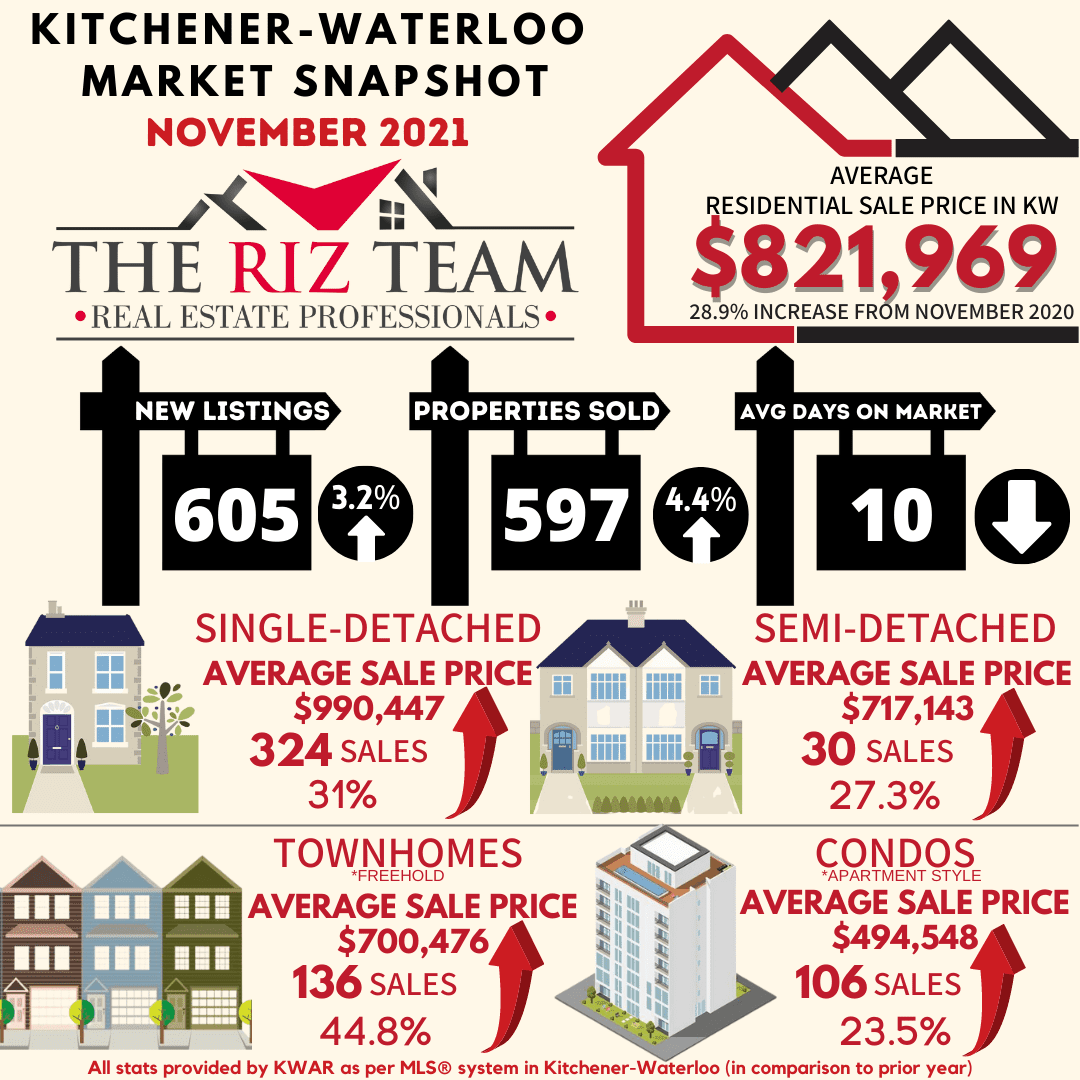
A NEW RECORD HIGH FOR NUMBER OF HOME SALES IN NOVEMBER AND AN ALL-TIME RECORD LOW SUPPLY READING
KITCHENER-WATERLOO, ON (December 3, 2021) –– There were 597 residential homes sold last month through the Multiple Listing Service® (MLS® System) of the Kitchener-Waterloo Association of REALTORS® (KWAR) setting a new record high for November. Compared to the same month last year, November sales were up 4.4% and on par with last month. The previous ten-year average number of residential sales for November is 446.
“The elevated pace of home sales we’ve seen for the past year and a half showed no sign of slowing down in November,” says KWAR’s president, Megan Bell. “Despite some speculation of there being a housing market correction in store for Waterloo Region, sustained homebuying demand combined with a record low level of inventory in November produced continued price growth in the MLS® HPI benchmark price.”
Total residential sales in November included 324 detached (down 3.9 per cent from November 2020), and 106 condominium units (up 27.7 per cent). Sales also included 30 semi-detached homes (down 25 per cent) and 136 townhouses (up 21.4 per cent).
In November, the average sale price for all residential properties in the Kitchener-Waterloo area was $821,969. This represents a 28.9 per cent increase over November 2020 and a 2 per cent decrease compared to October 2021.
- The average price of a detached home was $990,447. This represents a 31 per cent increase from November 2020 and a decrease of 0.6 per cent compared to October 2021.
- The average sale price for an apartment-style condominium was $494,548. This represents an increase of 23.5 per cent from November 2020 and an increase of 7.1 per cent compared to October 2021.
- The average sale price for a townhouse was $700,476. This represents a 44.8 per cent increase from November 2020 and an increase of 0.9 per cent compared to October 2021.
- The average sale price for a semi was $717,143. This represents an increase of 27.3 per cent compared to November 2020 and a decrease of 1.3 per cent compared to October 2021.

KWAR cautions that average sale price information can be useful in establishing long-term trends but should not be used as an indicator that specific properties have increased or decreased in value. The MLS® Home Price Index (HPI) provides the best way to gauge price trends because averages are strongly distorted by changes in the mix of sales activity from one month to the next.
The MLS® HPI composite benchmark price for all residential properties in Kitchener-Waterloo was $825,000 in November. This represents a 34.1 per cent increase over November 2020 and a 2.6 per cent increase compared to October 2021.
- The benchmark price for a detached home was $915,800. This represents a 35.8 per cent increase from November 2020 and 3.2 per cent increase compared to October 2021.
- The benchmark price for an apartment-style condominium was $398,000. This represents a 16.7 per cent increase from November 2020 and a 2.1 per cent decrease compared to October 2021.
- The benchmark price for a townhouse is $627,900. This represents a 45.5 per cent increase from November 2020 and a 4.0 per cent increase compared to October 2021.

“Lack of supply continues to be the refrain in November,” says Bell. “With inventory hitting an all time low it is a tough time to be house hunting right now.”
There were 605 new listings added to the MLS® System in KW and area last month, an increase of 3.2 per cent compared to November of last year, and a 14.6 per cent decrease compared to the previous ten-year average for November.
The total number of homes available for sale in active status at the end of November was 207, a decrease of 40.2 per cent compared to November of last year, and 80.7 per cent below the previous ten-year average of 1,071 listings for November.
The number of months of inventory reached an all time low of 0.3 in November. Inventory has settled at under 1 month for thirteen consecutive months. The number of months of inventory represents how long it would take to sell off current inventories at the current rate of sales.
The average number of days to sell in November stayed at 10 days, compared to 14 days in November 2020 and a previous 5-year average of 24 days.
Bell notes that while the housing market typically slows down around the holiday season, she still expects to see a busier than normal December. “There is growing anxiety out there among buyers caused by the fear of missing out against rumblings of interest rates eventually going up in the year ahead.”
Those requiring specific information on property values should contact a local REALTOR®. Working with a Realtor is the best way to get a complete picture of the property and community you are considering.
View our HPI tool here to learn more: https://kwar.ca/hpi-dashboard
Historical Sales by Property Type

Months Supply of Homes for Sale

Historical Median Sales Price – By Property Type

Historical Average Sales Price – By Property Type


KWAR cautions that average sale price information can be useful in establishing long term trends but should not be used as an indicator that specific properties have increased or decreased in value. The average sale price is calculated based on the total dollar volume of all properties sold. Months Supply is the inventory of homes for sale at the end of a given month, divided by the average monthly closed sales from the last 12 months Those requiring specific information on property values should contact a local REALTOR®. REALTORS® have their fingers on the pulse of the market. They know the questions to ask, the areas to probe and what to look for so that you get a complete picture of the property and community you’re considering.