Posts Tagged ‘housing’
Tuesday, March 4th, 2025

The introduction of new tariffs between the USA and Canada could have several implications for the Canadian housing market, particularly in Ontario, which is one of the most populous and economically significant provinces in Canada. Here are some thoughts on how these tariffs, along with other economic factors like interest rates and stock market performance, might impact the housing market:
1. Impact of Tariffs on the Housing Market
- Construction Costs: Tariffs on imported construction materials (e.g., steel, aluminum, lumber) could increase the cost of building new homes. This would likely be passed on to consumers in the form of higher home prices, particularly in markets like Ontario where demand for housing remains strong.
- Consumer Confidence: If tariffs lead to broader economic uncertainty or a slowdown in trade-dependent industries, consumer confidence could weaken. This might reduce the willingness of potential buyers to enter the housing market, particularly for higher-priced homes.
- Regional Effects: Ontario, being a major manufacturing hub, could feel the impact of tariffs more acutely than other provinces. If businesses face higher costs or reduced access to U.S. markets, job losses or reduced wage growth could dampen housing demand in certain areas.
2. Proposed Interest Rates
- Bank of Canada (BoC) Response: The BoC typically considers both domestic and global economic conditions when setting interest rates. If tariffs lead to slower economic growth or inflationary pressures (due to higher import costs), the BoC may adjust its monetary policy accordingly.
- Scenario 1: If tariffs cause inflation to rise, the BoC might increase interest rates to curb inflationary pressures. Higher interest rates would make mortgages more expensive, potentially cooling the housing market.
- Scenario 2: If tariffs lead to economic slowdown or uncertainty, the BoC might hold off on raising rates or even cut them to stimulate the economy. This could support housing demand by keeping borrowing costs low.
- Current Trends: As of late 2023, the BoC has been cautious about raising rates too quickly as we went up with 12 interest rate hikes and we have a downward trend now into 2025 with the last 5 interest rate reductions, given concerns about household debt levels and housing affordability. Tariffs could add another layer of complexity to their decision-making process.
3. Stock Market Downturn and S&P 500 Decline
- Wealth Effect: A decline in the stock market, particularly in the S&P 500, could reduce the wealth of Canadian investors who hold U.S. equities. This might lead to decreased consumer confidence and spending, including in the housing market.
- Investor Behavior: A downturn in the stock market could make real estate a more attractive investment option for some investors, potentially increasing demand for housing. However, this effect might be offset by broader economic uncertainty.
- Mortgage Rates: While the stock market and housing market are not directly linked, a significant decline in the S&P 500 could signal broader economic concerns. This might lead to lower bond yields, which could, in turn, result in lower fixed mortgage rates. However, variable rates would still be influenced by the BoC’s policy decisions.
4. Overall Housing Market Outlook in Canada
- Short-Term: In the short term, the combination of tariffs, potential interest rate changes, and stock market volatility could create uncertainty in the housing market. This might lead to slower price growth or even price declines in some regions, particularly if buyer confidence wanes.
- Long-Term: Over the longer term, the impact of tariffs on the housing market will depend on how they affect the broader economy. If tariffs lead to sustained economic weakness, the housing market could face headwinds. However, if the economy adjusts and growth resumes, the housing market could stabilize or even rebound.
- Regional Variations: Ontario, particularly the Greater Toronto Area (GTA), may experience different effects compared to other regions. The GTA’s housing market is influenced by factors like immigration, foreign investment, and local economic conditions, which could mitigate or amplify the impact of tariffs and other economic factors.
Conclusion
The new USA/Canada tariffs, combined with potential changes in interest rates and stock market performance, create a complex environment for the Canadian housing market. In Ontario, the impact could be significant, particularly if tariffs lead to higher construction costs or economic uncertainty. However, the housing market’s resilience will depend on a range of factors, including the BoC’s monetary policy, consumer confidence, and broader economic conditions. While there may be short-term challenges, the long-term outlook will depend on how these factors evolve and interact over time.
Want to sit down on a one-on-one and talk about the market feel free to connect with us. Fill out the form here: https://www.therizteam.com/contact
Tags: buyers, cambridge, for sale, Homes For Sale, housing, kitchener, kitchener for sale, kitchener real estate, kitchener-waterloo, kitchener-waterloo association of realtors, Market Update, real estate, rizsellskw, sales representative, Selling more homes, talk to us, tariffs, the riz team, waterloo, waterloo real estate, waterloo realtor
Posted in Enhance Your Home, Kitchener Buyers, Kitchener Sellers, Market Stats, Market Update, Real Estate News, Realtor Tips, Uncategorized, Waterloo Buyers, Waterloo Sellers | Comments Off on Impact of Tariffs on the Housing Market
Wednesday, July 24th, 2024
This decrease will assist buyers by offering a better affordability plan on their monthly payments, while also helping sellers within a more active marketplace as buyers start to re-enter. Be sure to connect with anyone from The Riz Team and let’s put a plan in place for your next move….

Do you want to know what your home is worth today? Click Below for our Online No Obligation Market Evaluation
Bank of Canada cuts key interest rate again, more cuts ‘reasonable’ if inflation keeps easing
For the second time in a row, Canada’s central bank has cut its overnight lending rate.
In its pre-scheduled July 2024 announcement, the Bank of Canada dropped the target for the overnight lending rate by 25 basis points to 4.50%.
While inflation remains above the Bank’s 2% target, it is expected that inflation will continue to ease as the global economy expands into 2026, bolstering the Bank’s decision to continue lowering rates.
In his opening remarks to reporters at a press conference following the announcement, Tiff Macklem, Governor of the Bank of Canada, cited that the risk that inflation continues to grow must be balanced against the risk that the economy and inflation could weaken.
“Looking ahead, we expect inflation to moderate further, though progress over the next year will likely be uneven. This forecast reflects the opposing forces affecting inflation. The overall weakness in the economy is pulling inflation down. At the same time, price pressures in shelter and some other services are holding inflation up,” said Macklem. “We are increasingly confident that the ingredients to bring inflation back to target are in place. But the push-pull of these opposing forces means the decline in inflation will likely be gradual, and there could be setbacks along the way.”

| Date* |
Target (%) |
Change (%) |
| July 24, 2024 |
4.5 |
-0.25 |
| June 5, 2024 |
4.75 |
-0.25 |
| April 10, 2024 |
5 |
— |
| March 6, 2024 |
5 |
— |
| January 24, 2024 |
5 |
— |
| December 6, 2023 |
5 |
— |
| October 25, 2023 |
5 |
— |
| September 6, 2023 |
5 |
— |
| July 12, 2023 |
5 |
0.25 |
| June 7, 2023 |
4.75 |
0.25 |
| April 12, 2023 |
4.5 |
— |
| March 8, 2023 |
4.5 |
— |
According to a recent Royal LePage survey, conducted by Leger,1 51% of Canadians who put their home buying plans on hold the last two years said they would return to the market when the Bank of Canada reduced its key lending rate. Eighteen percent said they would wait for a cut of 50 to 100 basis points, and 23% said they’d need to see a cut of more than 100 basis points before considering resuming their search.
“Our research shows that many buyer hopefuls have been waiting for a concrete signal from the Bank of Canada that the economy is moving in the right direction. A second cut to the overnight lending rate indicates just that, and with mortgage qualification thresholds continuing to come down, sidelined buyers may have the confidence they need to make their return to the housing market,” said Karen Yolevski, COO of Royal LePage Real Estate Services Ltd.
“We expect this will prompt a slight boost in activity in the short-term, followed by more robust buyer demand in the fall. In the meantime, some much-needed inventory has been building in major markets over the last few months, giving buyers more options to choose from. In addition to lower rates, this may also encourage more buyers to re-enter the market in the near future.”
The Bank of Canada will make its next announcement on Wednesday, September 4th.
Read the full July 24th report here.
Article excerpts brought to you by
Michelle McNally
Communications manager, Royal LePage
Tags: buyers, housing, kitchener-waterloo, KW Market Update, royal lepage, Royal Lepage Wolle Realty, sales representative, the riz team, TheRizTeam, waterloo, Waterloo Buyers, waterloo for sale, Waterloo Homes, waterloo real estate, waterloo realtor, Waterloo Sellers
Posted in Kitchener Buyers, Kitchener Sellers, Market Stats, Market Update, Real Estate News, Realtor Tips, Uncategorized, Waterloo Buyers, Waterloo Sellers | Comments Off on Bank of Canada makes second consecutive rate cut, lowers overnight lending rate to 4.50%
Thursday, July 4th, 2024
Waterloo Region Housing Market Sees Cooling Trend: Increased Inventory and Lower Prices Provide Opportunities for Buyers
“The Waterloo Region housing market is cooling, with a year-over-year decrease in home sales in June, while the number of homes for sale is rising, offering more inventory to buyers,” says Christal Moura, Cornerstone spokesperson for the Waterloo Region market area.”
If you are considering to Sell your home or Buy a home in the next short while it would be highly beneficial for you to connect with one of our Team Agents at
Do you want to know what your home is worth today? Click Below for our Online No Obligation Market Evaluation
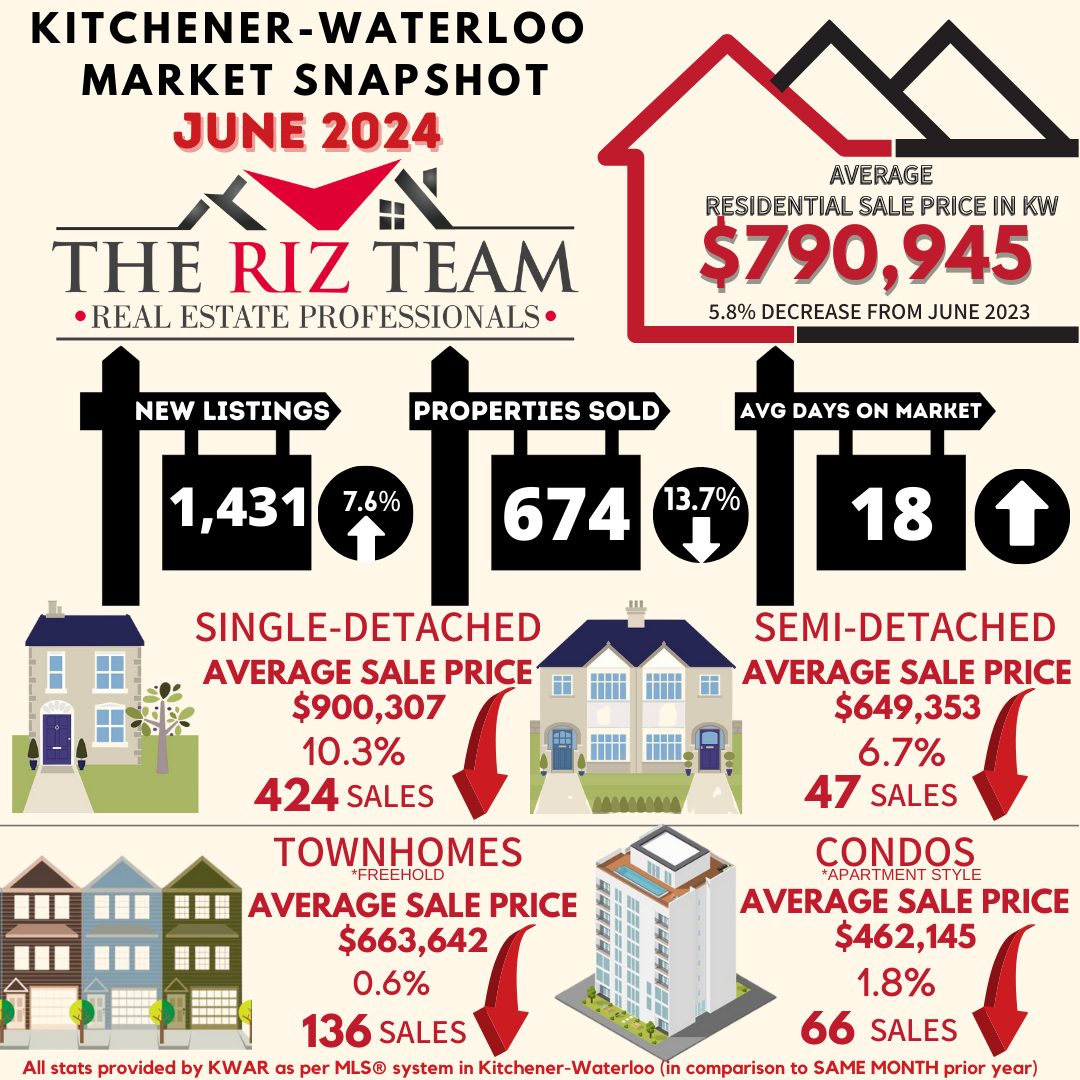
WATERLOO REGION, ON (July 4, 2024) —In June, a total of 674 homes were sold in the Waterloo Region via the Multiple Listing Service® (MLS®) System of the Cornerstone Association of REALTORS® (Cornerstone). This represents a decrease of 13.7 per cent compared to the same period last year and a decline of 24.8 per cent compared to the average number of homes sold in the previous ten years for the same month.
“The Waterloo Region housing market is cooling, with a year-over-year decrease in home sales in June, while the number of homes for sale is rising, offering more inventory to buyers,” says Christal Moura, Cornerstone spokesperson for the Waterloo Region market area.”
Total residential sales in June included 424 detached (down 9.6 per cent from June 2023), and 136 townhouses (down 8.7 per cent). Sales also included 66 condominium units (down 44.5 per cent) and 47 semi-detached homes (up 14.6 per cent).
In June, the average sale price for all residential properties in Waterloo Region was $790,945. This represents a 5.8 per cent decrease compared to June 2023 and a 3.3 per cent decrease compared to May 2024.
- The average price of a detached home was $900,307. This represents a 10.3 per cent decrease from June 2023 and a decrease of 4.6 per cent compared to May 2024.
- The average sale price for a townhouse was $663,642. This represents a 0.6 per cent decrease from June 2023 and an increase of 2.0 per cent compared to May 2024.
- The average sale price for an apartment-style condominium was $462,145. This represents a decrease of 1.8 per cent from June 2023 and an increase of 0.5 per cent compared to May 2024.
- The average sale price for a semi was $649,353. This represents a decrease of 6.7 per cent compared to June 2023 and a decrease of 7.2 per cent compared to May 2024.

MLS® Home Price Index Benchmark Price
|
|
Kitchener-Waterloo |
Cambridge |
| Benchmark Type: |
June 2024 |
Monthly % Change |
Yr./Yr. % Change |
June 2024 |
Monthly % Change |
Yr./Yr. % Change |
| Composite |
$741,500 |
-1.4 |
-5.6 |
$755,200 |
-0.7 |
-3.1 |
| Detached |
$852,900 |
-1.6 |
-5.1 |
$791,900 |
-0.6 |
-3.1 |
| Townhouse |
$626,400 |
-1.2 |
-3.9 |
$652,600 |
-0.7 |
-0.6 |
| Apartment |
$455,800 |
-0.5 |
-4.7 |
$490,600 |
-1.1 |
1.6 |

“The average selling price for residential properties has decreased by 5.8 per cent since June 2023, with detached homes showing the most significant drop at 10.3 percent. This indicates a broader softness in the market,” says Moura. “The silver lining is this presents a more favourable pricing environment for buyers, with more choices, greater flexibility, and the potential to negotiate better deals.”
There were 1,431 new listings added to the MLS® System in Waterloo Region last month, an increase of 7.6 per cent compared to June last year and a 10.6 per cent increase compared to the previous ten-year average for June.
The total number of homes available for sale in active status at the end of June was 1,790, an increase of 75.5 per cent compared to June of last year and 31.9 per cent above the previous ten-year average of 1,357 listings for June.
Market-wide inventory levels were up 73.7 per cent, with 3.3 months’ supply for all property types at the end of June. The property type that gained the most inventory was the condo apartment segment, which increased by 103.1 percent. That amounts to 6.5 months’ supply for condo apartments, 2.8 months for detached homes, and 3.2 months for townhouses. The number of months of inventory represents the amount of time it would take to sell off current inventories at the current sales rate.
The average number of days to sell in June was 18, compared to 15 days in June 2023. The previous 5-year average is 15 days.
Cornerstone emphasizes the importance of consulting a local REALTOR® when considering buying or selling property in the Waterloo Region. Their expertise can provide valuable insights into the current market conditions, enabling individuals to make well-informed decisions aligned with their goals and preferences.


ABOUT CORNERSTONE
Cornerstone Association of REALTORS® (Cornerstone) is a brand-new, novel association formed on July 1, 2024. Representing REALTORS® serving in the markets of Mississauga, Burlington, Hamilton, Waterloo Region, Niagara North, Haldimand County, Norfolk County and surrounding areas, it will become Ontario’s second-largest real estate board comprised of nearly 9,000 REALTORS®.
Established to better serve and represent REALTORS®, its vision is to establish a new, more influential, capable, and member-centric organization designed to meet the evolving needs of REALTORS® and help them thrive in the marketplace.
Cornerstone stands for transparency, honesty, and integrity. By taking a proactive stance toward the future and not being afraid to question some of the long-standing assumptions, Cornerstone offers a unique value proposition, paving the way for members’ brighter future.
We are Cornerstone. REALTORS® Together, Stronger Together.
More information at www.cornerstone.inc
Tags: buyers, for sale, home sales, housing, kitchener, Kitchener Buyers, kitchener-waterloo, kitchener-waterloo association of realtors, KW Market Update, Market Update, real estate, riz jadavji, rizsellskw, rizsellskw.com, Royal Lepage Wolle Realty, sales representative, the riz team, Waterloo Buyers, waterloo real estate, Waterloo Sellers, www.rizsellskw.com
Posted in Kitchener Buyers, Kitchener Sellers, Market Stats, Market Update, Real Estate News, Realtor Tips, Waterloo Buyers, Waterloo Sellers | Comments Off on Kitchener Waterloo Market Snapshot June 2024
Friday, December 3rd, 2021
A NEW RECORD HIGH FOR NUMBER OF HOME SALES IN NOVEMBER AND AN ALL-TIME RECORD LOW SUPPLY READING
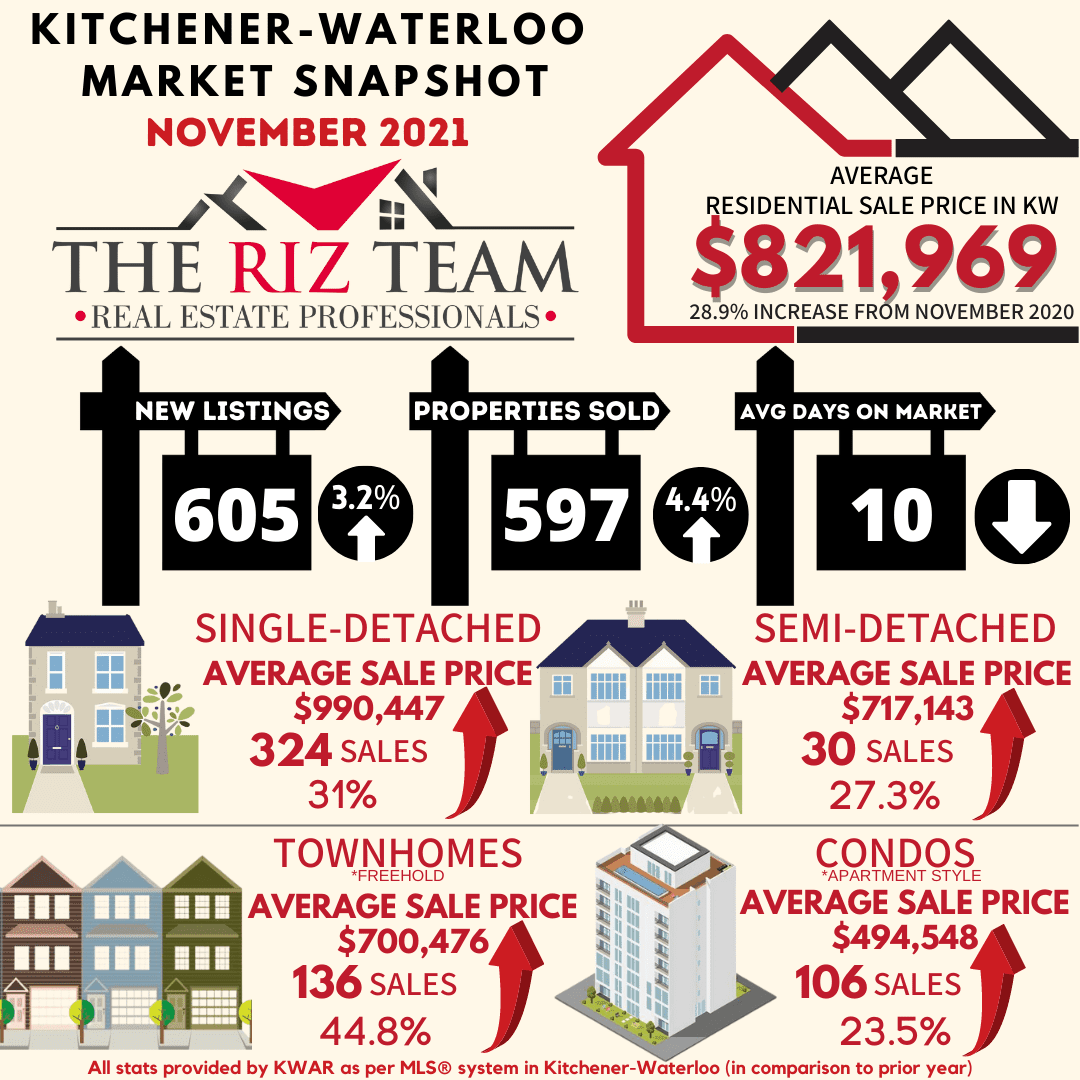
KITCHENER-WATERLOO, ON (December 3, 2021) –– There were 597 residential homes sold last month through the Multiple Listing Service® (MLS® System) of the Kitchener-Waterloo Association of REALTORS® (KWAR) setting a new record high for November. Compared to the same month last year, November sales were up 4.4% and on par with last month. The previous ten-year average number of residential sales for November is 446.
“The elevated pace of home sales we’ve seen for the past year and a half showed no sign of slowing down in November,” says KWAR’s president, Megan Bell. “Despite some speculation of there being a housing market correction in store for Waterloo Region, sustained homebuying demand combined with a record low level of inventory in November produced continued price growth in the MLS® HPI benchmark price.”
Total residential sales in November included 324 detached (down 3.9 per cent from November 2020), and 106 condominium units (up 27.7 per cent). Sales also included 30 semi-detached homes (down 25 per cent) and 136 townhouses (up 21.4 per cent).
In November, the average sale price for all residential properties in the Kitchener-Waterloo area was $821,969. This represents a 28.9 per cent increase over November 2020 and a 2 per cent decrease compared to October 2021.
- The average price of a detached home was $990,447. This represents a 31 per cent increase from November 2020 and a decrease of 0.6 per cent compared to October 2021.
- The average sale price for an apartment-style condominium was $494,548. This represents an increase of 23.5 per cent from November 2020 and an increase of 7.1 per cent compared to October 2021.
- The average sale price for a townhouse was $700,476. This represents a 44.8 per cent increase from November 2020 and an increase of 0.9 per cent compared to October 2021.
- The average sale price for a semi was $717,143. This represents an increase of 27.3 per cent compared to November 2020 and a decrease of 1.3 per cent compared to October 2021.

KWAR cautions that average sale price information can be useful in establishing long-term trends but should not be used as an indicator that specific properties have increased or decreased in value. The MLS® Home Price Index (HPI) provides the best way to gauge price trends because averages are strongly distorted by changes in the mix of sales activity from one month to the next.
The MLS® HPI composite benchmark price for all residential properties in Kitchener-Waterloo was $825,000 in November. This represents a 34.1 per cent increase over November 2020 and a 2.6 per cent increase compared to October 2021.
- The benchmark price for a detached home was $915,800. This represents a 35.8 per cent increase from November 2020 and 3.2 per cent increase compared to October 2021.
- The benchmark price for an apartment-style condominium was $398,000. This represents a 16.7 per cent increase from November 2020 and a 2.1 per cent decrease compared to October 2021.
- The benchmark price for a townhouse is $627,900. This represents a 45.5 per cent increase from November 2020 and a 4.0 per cent increase compared to October 2021.

“Lack of supply continues to be the refrain in November,” says Bell. “With inventory hitting an all time low it is a tough time to be house hunting right now.”
There were 605 new listings added to the MLS® System in KW and area last month, an increase of 3.2 per cent compared to November of last year, and a 14.6 per cent decrease compared to the previous ten-year average for November.
The total number of homes available for sale in active status at the end of November was 207, a decrease of 40.2 per cent compared to November of last year, and 80.7 per cent below the previous ten-year average of 1,071 listings for November.
The number of months of inventory reached an all time low of 0.3 in November. Inventory has settled at under 1 month for thirteen consecutive months. The number of months of inventory represents how long it would take to sell off current inventories at the current rate of sales.
The average number of days to sell in November stayed at 10 days, compared to 14 days in November 2020 and a previous 5-year average of 24 days.
Bell notes that while the housing market typically slows down around the holiday season, she still expects to see a busier than normal December. “There is growing anxiety out there among buyers caused by the fear of missing out against rumblings of interest rates eventually going up in the year ahead.”
Those requiring specific information on property values should contact a local REALTOR®. Working with a Realtor is the best way to get a complete picture of the property and community you are considering.
View our HPI tool here to learn more: https://kwar.ca/hpi-dashboard
Historical Sales by Property Type

Months Supply of Homes for Sale

Historical Median Sales Price – By Property Type

Historical Average Sales Price – By Property Type

Average Days on Market

KWAR cautions that average sale price information can be useful in establishing long term trends but should not be used as an indicator that specific properties have increased or decreased in value. The average sale price is calculated based on the total dollar volume of all properties sold. Months Supply is the inventory of homes for sale at the end of a given month, divided by the average monthly closed sales from the last 12 months Those requiring specific information on property values should contact a local REALTOR®. REALTORS® have their fingers on the pulse of the market. They know the questions to ask, the areas to probe and what to look for so that you get a complete picture of the property and community you’re considering.
Tags: buyers, for sale, Homes For Sale, house, housing, Kitchener Buyers, Kitchener Sellers, kitchener-waterloo, kitchener-waterloo association of realtors, KW Market Update, real estate market, the riz team, waterloo, Waterloo Homes, waterloo real estate, Waterloo Sellers
Posted in Kitchener Buyers, Kitchener Sellers, Market Stats, Market Update, Real Estate News, Realtor Tips, Waterloo Buyers, Waterloo Sellers | Comments Off on Kitchener-Waterloo Market Snapshot November 2021
Friday, September 3rd, 2021
HOMEBUYING DEMAND CONTINUES TO OVERWHELM HOUSING SUPPLY
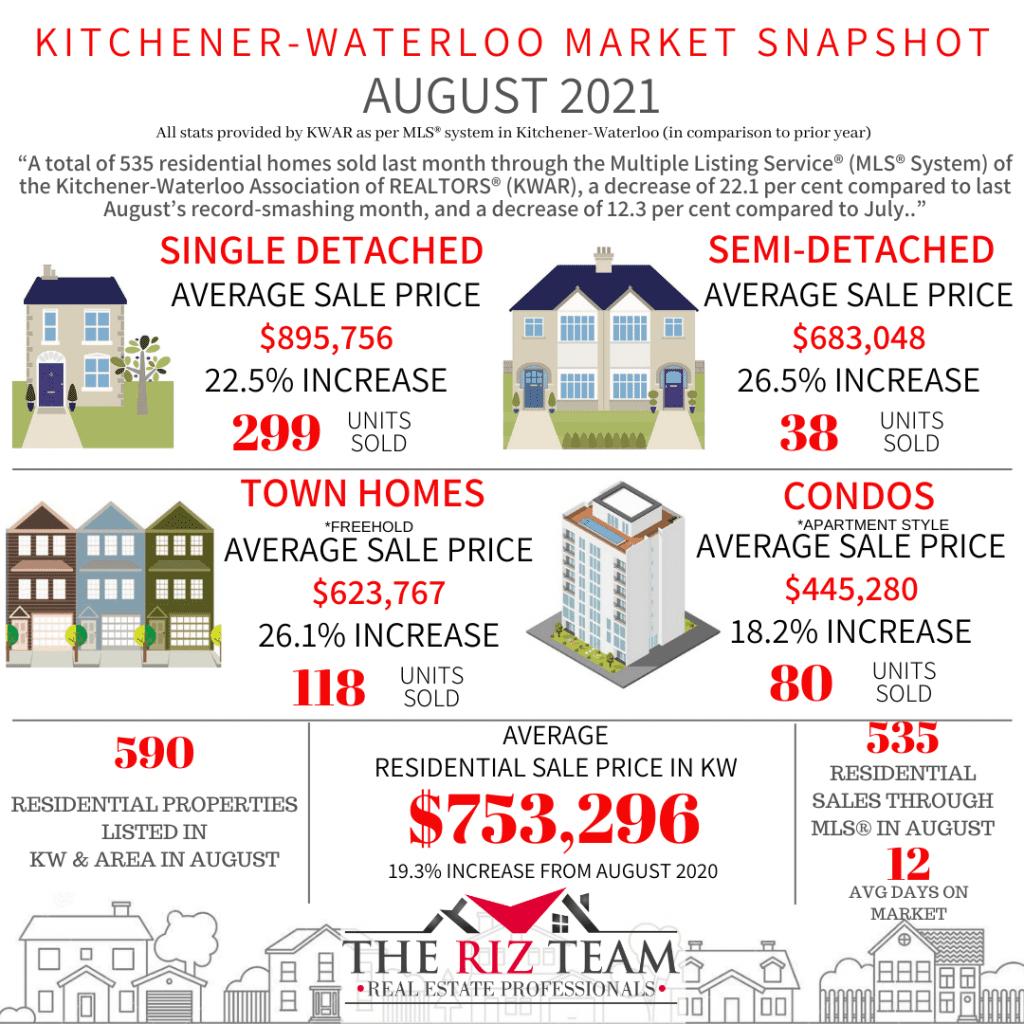
KITCHENER-WATERLOO, ON (September 3, 2021) –– A total of 535 residential homes sold last month through the Multiple Listing Service® (MLS® System) of the Kitchener-Waterloo Association of REALTORS® (KWAR), a decrease of 22.1 per cent compared to last August’s record-smashing month, and a decrease of 12.3 per cent compared to July.
While sales were down relative to last month and last August, they remained well above average notes KWAR’s president, Nicole Pohl. “The main reason for the decrease is simply that last month was the first full month in Step 3 of the reopening, and people were tired of the lockdown,” says Pohl. “They got out and enjoyed their summer and shifted their real estate needs to the back burner for a much-needed change of focus.”
Total residential sales in August included 299 detached (down 30.6 per cent from August 2020), and 80 condominium units (down 1.2 per cent). Sales also included 38 semi-detached homes (down 2.6) and 118 townhouses (down 13.2 per cent).
In August, the average sale price for all residential properties in the Kitchener-Waterloo area was $753,296. This represents a 19.3 per cent increase over August 2020 and a 0.3 per cent decrease compared to July 2021
- The average price of a detached home was $895,756. This represents a 22.5 per cent increase from August 2020 and a decrease of 1.3 per cent compared to July 2021.
- The average sale price for an apartment-style condominium was $445,280. This represents an increase of 18.2 per cent from August 2020 and an increase of 3.7 per cent compared to July 2021.
- The average sale price for a townhouse was $623,767. This represents a 26.1 per cent increase from August 2020 and an increase of 0.1 per cent compared to July 2021.
- The average sale price for a semi was $683,048. This represents an increase of 26.5 per cent compared to August 2020 and an increase of 2.3 per cent compared to July 2021.

KWAR cautions that average sale price information can be useful in establishing long-term trends but should not be used as an indicator that specific properties have increased or decreased in value. The MLS® Home Price Index (HPI) provides the best way to gauge price trends because averages are strongly distorted by changes in the mix of sales activity from one month to the next.
The MLS® HPI composite benchmark price for all residential properties in Kitchener-Waterloo was $757,900 in August. This represents a 29.5 per cent increase over August 2020 and a 1.2 per cent increase compared to July 2021.
- The benchmark price for a detached home was $837,100. This represents a 31.5 per cent increase from August 2020 and 1.8 per cent increase compared to July 2021.
- The benchmark price for an apartment-style condominium was $380,700. This represents a 11.7 per cent increase from August 2020 and a 1.3 per cent decrease compared to July 2021.
- The benchmark price for a townhouse is $568,000. This represents a 37.3 per cent increase from August 2020 and a 0.6 per cent increase compared to July 2021.

There were 590 new listings added to the MLS® System in KW and area last month, a decrease of 27.6 per cent compared to August of last year, and a 13 per cent decrease compared to the previous ten-year average for August.
The total number of homes available for sale in active status at the end of August was 255, a decrease of 53.6 per cent compared to August of last year, and 79.5 per cent below the previous ten-year average of 1,252 listings for August.
“The number of homes coming to market continues to be overwhelmed by the number of homebuyers we have wanting to purchase in Waterloo Region,” says Pohl.
The number of months of inventory persisted from the July level of 0.4 months in August. Inventory has numbered less than 1 month since October. The number of months of inventory represents how long it would take to sell off current inventories at the current rate of sales.
The average number of days to sell in August was 12 days, compared to 17 days in August 2020 and a previous 5-year average of 26 days.
Those requiring specific information on property values should contact a local REALTOR®. Working with a Realtor is the best way to get a complete picture of the property and community you are considering.
View our HPI tool here to learn more: https://kwar.ca/hpi-dashboard
Historical Sales By Property Type

Months Supply of Homes for Sale

Historical Median Sales Price – By Property Type

Historical Average Sales Price – By Property Type

Average Days on Market

Tags: buyers, for sale, home sales, housing, Kitchener Buyers, kitchener for sale, kitchener-waterloo, kitchener-waterloo association of realtors, KW Market Update, KW Real Estate, real estate market, Waterloo Buyers, Waterloo Homes
Posted in Kitchener Buyers, Kitchener Sellers, Market Stats, Market Update, Real Estate News, Waterloo Buyers, Waterloo Sellers | Comments Off on Kitchener-Waterloo Market Snapshot August 2021
Friday, April 3rd, 2020
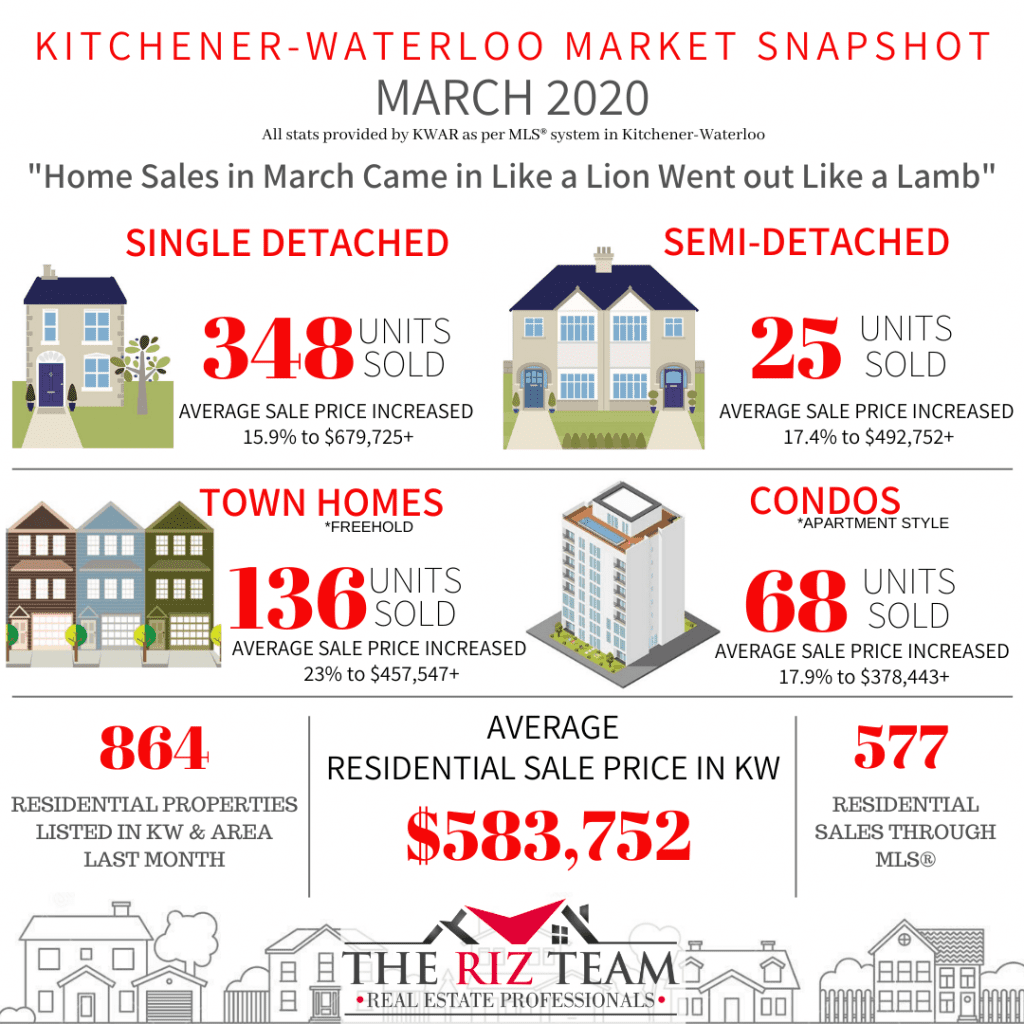
Home Sales in March Came in Like a Lion Went out Like a Lamb
KITCHENER-WATERLOO, ON (April 3, 2020) ––There were 577 residential homes sold through the Multiple Listing System (MLS® System) of the Kitchener-Waterloo Association of REALTORS® in March, an increase of 13.1 per cent compared to the same month last year, and 0.2 per cent below the previous 5-year average.
“We had a very strong start to the month which carried through right up until the province declared its COVID-19 related state of emergency on March 17th,” says Colleen Koehler, President of KWAR. “Before the pandemic hit our region, I believe we were on pace to set a record number of sales for March with the continuance of high demand, low inventory, and a strong seller’s market.
During the first quarter of 2020, there were 1,327 home sales, 14.6 per cent above last year’s result for the same period and 4 per cent above the previous 5-year average.
Total residential sales in March included 348 detached homes (up 7.1 per cent), and 68 condominium apartments (up 5.1 per cent). Sales also included 136 townhouses (up 17.2 per cent) and 25 semi-detached homes (up 4.2 per cent).
The average sale price of all residential properties sold in March increased 15.3 per cent to $583,752 compared to the same month last year, while detached homes sold for an average price of $679,728 an increase of 15.9 per cent. During this same period, the average sale price for an apartment-style condominium was $378,443 for an increase of 17.9 per cent. Townhomes and semis sold for an average of $457,547 (up 23 per cent) and $492,752 (up 17.4 per cent) respectively.
The median price of all residential properties sold in March increased 14.6 per cent to $544,500 and the median price of a detached home during the same period increased 16.2 per cent to $628,500.
“Of course, what is on everyone’s mind is the Coronavirus, and how this global pandemic is impacting every facet of our lives. The Ontario government included real estate services, legal and land registry as an essential service, but by no means is this business as usual for Realtors or their clients,” says Koehler. “As people everywhere follow instructions to only leave their homes for essential reasons, this is impacting the number of showings, and how properties are shown. Not everyone is in the position to postpone the purchase or sale of their home, and Realtors are adapting the technology we already use to serve our clients in this new environment and rigidly following Health Canada’s guidelines.”
REALTORS® listed a higher than average number of homes during the Month of March. There were 864 new listings added to the MLS® System in KW and area last month, an increase of 7.6 per cent compared to March of 2019, and the greatest number since 2015. The number of new residential listings was also 3.7 per cent higher than the previous ten-year average for March.
The total number of homes available for sale in active status at the end of March was 535, a decrease of 35.9 per cent compared to March of last year.
Despite the much-needed addition of new inventory coming to the market, the number of Months Supply (also known as absorption rate) continues to be very low at just 1.1 months for the month of March, 35.3 per cent below the same period last year. The previous ten-year average supply of homes for March was 2.73 months, and in the past 5 years, the average supply for March was 1.94 months.
KWAR’s president wishes to emphasize that while real estate continues to be an essential service in Ontario, consumers can expect that a REALTOR® will be taking all the necessary protections to ensure we’re doing our part to flatten the curve.
Koehler notes last month 51 listings were suspended on KWAR’s MLS® System, which means the listing is temporarily “off-market,” and there can be no marketing showings or offers during this period. KWAR’s president encourages buyers and sellers to discuss the current situation with their REALTOR®, to find out what they are doing to ensure the safety of everyone involved in the transaction and to make the best and safest decision on how to move forward or hold your real estate decisions during this unprecedented time.
Trying to sell your home while in quarantine, self-isolating or worse yet, while someone in the house is sick, is not going to be in anyone’s best interest. We know many people are postponing their plans to list their home for the time being.
The average days to sell in March was 15 days, compared to 21 days in March 2019.
Media Contact: Tania Benninger, Stakeholder Relations, 519-584-1141
Read Online: https://kwar.ca/home-sales-march-2020
Historical Sales By Property Type

Months Supply of Homes for Sale

Tags: buyers, for sale, home sales, Homes For Sale, house, housing, Kitchener Buyers, kitchener for sale, kitchener realtor, kitchener-waterloo, kitchener-waterloo association of realtors, KW Market Update, KW Real Estate, real estate, realtor, riz jadavji, Royal Lepage Wolle Realty, sales representative, the riz team, waterloo, Waterloo Buyers, Waterloo Homes, waterloo realtor
Posted in Market Stats, Market Update | Comments Off on Kitchener Market Snapshot for March 2020
Tuesday, July 7th, 2015
What goes under foot is seldom an easy decision. Colour, surface texture, room usage and price all come into play. Today, greener options abound, adding to the myriad of choices already available.
Increasing interest in incorporating renewable resources into the home has resulted in many beautiful eco-friendly flooring options.
For homeowners looking on the greener side, it’s worth a look at the many sustainable products available today:
• Give a tree another lease on life with salvaged wood flooring. A rustic look can be created with reclaimed wood. Buying reclaimed lumber continues to get easier, and in some instances, less expensive relative to the cost of new hardwoods.
• Bamboo is a good option for rooms with low humidity. High abundance and a natural look make sustainable bamboo an attractive flooring option. Bamboo grows to maturity in three to five years, about a quarter of the time it takes to grow trees used for hardwood.
• Linoleum flooring has retained its popularity over decades. Unlike vinyl flooring, which is a synthetic product made of chlorinated petrochemicals, linoleum is manufactured from natural compounds including linseed oil, cork dust, tree resins and ground limestone. With natural, renewable elements used in its manufacturing, this eco-friendly flooring option continues to remain a popular option.
• Cork flooring has many eco-friendly attributes. Like bamboo, cork is quickly renewable. It is harvested from the bark of the cork oak tree and grows back every three years. Cork has anti-microbial properties to reduce allergens, is fire retardant and provides a comfortable feel under foot. Cork flooring can be finished in a variety of paints and stains to complement any room setting.
• Polyester (P.E.T.) Berber carpet is a sustainable option made of recycled plastic bottles. Anytime we can reuse these materials, we reduce the amount of new materials being manufactured and we reduce non-biodegradable materials in our landfills. Polyester Berber is spill resistant and comes in a variety of aesthetically – pleasing colours and patterns.
Whatever your home’s style or design, an eco-friendly flooring option exists to complement the desired look and existing patterns.
Tags: buyers, easy home improvement tips, for sale, home, home sales, home staging, Homes For Sale, house, housing, kitchener, Kitchener Buyers, kitchener for sale, Kitchener Homes, kitchener real estate, kitchener realtor, Kitchener Sellers, kitchener-waterloo, kitchener-waterloo association of realtors, kw, MLS, preparing to sell, real estate, real estate market, realtor, riz jadavji, Riz Sells KW, rizsellskw.com, royal lepage, Royal Lepage Wolle Realty, seller's tips, waterloo, waterloo real estate, waterloo realtor, Waterloo Sellers, www.rizsellskw.com
Posted in Enhance Your Home, For Sale, From The Riz Team, Kitchener Buyers, Kitchener Sellers, Real Estate Listings, Real Estate News, Realtor Tips, Uncategorized, Waterloo Buyers, Waterloo Sellers | Comments Off on Flooring choices on the greener side!
Monday, June 22nd, 2015
Helpful hints in making a small room appear bigger!
Small rooms are the bane of the home decorator. How do you achieve a pleasing look that doesn’t feel cramped and claustrophobic? Short of building an addition or knocking down walls, you are limited to a few, but effective, decorating tricks that create the illusion of space.
The strategic use of colour and light is the best way to achieve this. Choose light shades of paint or wallpaper for the walls. Lighter colours reflect light making for a brighter room. Use an even lighter shade of the same colour or white for ceilings and floors. A darker colour on the ceiling will make the ceiling look lower and tends to make the walls look as though they are closing in.
Avoid harshly contrasting colours. In fact, a monochromatic colour scheme that carries throughout the room into fabrics and accessories is very effective. Steer away from too many patterned items. The goal here is to blur perspective.
Anything you can do to bring light into the room will also give the effect of increased space. A corner wall sconce that casts light up onto the wall works well. Try to vary lighting effects for interest. A skylight is a great way to add light to a room, but isn’t always practical or affordable. Mirrors are a great solution for small rooms. Place mirrors directly across from another for maximum impact. A mirror placed across from a window is also effective. Place a lamp in front of a mirror to add more light to your room.
If you have wood or patterned flooring, have it installed so that the lines run diagonally across the room. This makes for longer lines, which give the appearance of a larger space. When furnishing the room, pick objects that are proportioned to the size of the room. For example, opt for a loveseat over a full-sized sofa. Lastly, keep the clutter to a minimum. Avoid using a lot of knick-knacks and keep the room tidy and well organized.
Tags: buyers, easy home improvement tips, for sale, home, home sales, home staging, Homes For Sale, house, housing, Kitchener Buyers, kitchener for sale, kitchener real estate, kitchener realtor, kitchener-waterloo association of realtors, preparing to sell, real estate market, riz jadavji, Riz Sells KW, rizsellskw, rizsellskw.com, royal lepage, Royal Lepage Wolle Realty, sales, sales representative, seller's tips, waterloo, waterloo for sale, Waterloo Homes, waterloo real estate, waterloo realtor, Waterloo Sellers, www.rizsellskw.com
Posted in Enhance Your Home, From The Riz Team, Kitchener Buyers, Kitchener Sellers, Real Estate Listings, Real Estate News, Realtor Tips, Uncategorized, Waterloo Buyers, Waterloo Sellers | Comments Off on Looking to Make a Small Room Appear Bigger??
Wednesday, June 17th, 2015

Remaining objective can be a difficult task when viewing an open house. It is easy to fall in love with a home’s appearance, blind to problems that may make it unsuitable. While aesthetics can be an important consideration, it is necessary to look beyond window-dressing.
Aqualified home inspector should be hired before purchasing a home, but there are areas that consumers can examine on their own. This will shorten your list of potential homes and reduce the likelihood that a home inspector will reject it as unsafe or unsuitable. Here are some considerations and common problem areas to look for when touring an open house:
General Upkeep
Much can be surmised from the general state of the home. Is the home clean? Are lawns left uncut? Are the walls chipped and in need of paint? If smaller chores have been ignored it may be an indication of a broader disregard for home maintenance.
Water Leaks
Check ceilings and drywall for stains, bulges and other signs of water damage. Water that works its way inside via a leaky roof or a cracked foundation can rot wood, create mildew and mold, destroy possessions and can be expensive to repair.
Does it Work?
Test lights, faucets, the heater, air conditioning, major appliances (that are to be included with the home) – even flush the toilets to ensure everything is working as it should.
Floors
As you walk across the floors be aware of spongy (soft or springy) sections. Excessive squeaking and uneven, bumpy floors may also be indicative of expensive forthcoming repairs.
Doors & Windows
Check that doors and windows fit snugly in their jambs and operate smoothly. Look for flaked paint and loose caulking. If the wood around windows and doors is not protected from moisture, it can rot away. Feel for drafts in these areas too.
Poor Drainage
On a wet day walk around the yard and look for areas where water collects. This can be an especially bad sign if there are soggy areas near the home’s foundation.
Grout & Caulking
If the grout and caulking around bathroom and kitchen tiles is loose and crumbly, there is a good chance that water is finding its way into the wall or under the floor.
Structural
Although this is definitely an area where you want the services of a qualified home inspector, you can get an idea about possible structural problems if you see deep cracks in the foundations or loose mortar and bricks.
Miscellaneous Concerns
Naturally, one the most important factors will be determining if the house suits your family’s needs. If you do not want to replace all of your furniture, make sure it will fit into the rooms of the new house. This is difficult to do by eye, so be sure to bring a measuring tape. Also, take note of storage space. If you are moving from a home with large closets and a shed, make sure your new house is able to store an equivalent amount of belongings.
Tags: buyers, easy home improvement tips, for sale, home, home sales, home staging, Homes For Sale, house, housing, kitchener, Kitchener Buyers, kitchener realtor, Kitchener Sellers, kitchener-waterloo, kitchener-waterloo association of realtors, preparing to sell, real estate, real estate market, realtor, riz jadavji, rizsellskw, rizsellskw.com, Royal Lepage Wolle Realty, sales representative, waterloo, Waterloo Buyers, Waterloo Homes, waterloo realtor, Waterloo Sellers, www.rizsellskw.com
Posted in Enhance Your Home, For Sale, From The Riz Team, Kitchener Buyers, Kitchener Sellers, Real Estate Listings, Realtor Tips, Uncategorized, Waterloo Buyers, Waterloo Sellers | Comments Off on Viewing an Open House with Open Eyes
Thursday, June 11th, 2015
Are you ready?
When you have decided that the time is right to sell, the first step in preparing for the sale of a home is finding out its worth. Contact me for a comparative market analysis, an informal estimate of value based on the recent selling price of similar neighborhood properties.
Working to ensure your home is in the best condition possible for showing to prospective buyers will position you to receive top dollar. This includes repairing or improving any trouble spots that could deter a buyer, such as squeaky doors, a leaky roof, dirty carpet and walls, and broken windows.
The first impression that potential buyers form of your property as they drive or walk up should not be underestimated. The “curb appeal” of your home is extremely important. You can create a positive first impression by making sure the lawn is pristine – the grass cut, debris removed, garden beds free of weeds, and hedges trimmed.
However, the trick is not to overspend on pre-sale repairs and fix-ups. This is especially important if there are few homes on the market but many buyers competing for them. On the other hand, making such repairs may be the key to selling your home in a down market.
Don’t Put it on HOLD…..Call RIZ to get it SOLD!!!
Tags: buyers, for sale, home, home sales, Homes For Sale, house, housing, kitchener, Kitchener Buyers, kitchener for sale, Kitchener Homes, kitchener real estate, Kitchener Sellers, kitchener-waterloo, kitchener-waterloo association of realtors, kw, preparing to sell, real estate, real estate market, realtor, riz jadavji, rizsellskw, rizsellskw.com, Royal Lepage Wolle Realty, sales representative, waterloo, www.rizsellskw.com
Posted in From The Riz Team, Kitchener Buyers, Kitchener Sellers, Real Estate Listings, Real Estate News, Realtor Tips, Uncategorized, Waterloo Buyers, Waterloo Sellers | Comments Off on Preparing your home for a sale!