Waterloo Region Home Sales Moderate in September as Market Continues to Balance
“The September housing market continues to reflect broader economic conditions, with sales remaining below both last year’s levels and the ten-year average,” says Christal Moura, spokesperson for the Waterloo Region market. “While sales volumes have moderated from last year, this shift has created a more balanced market where buyers can take time with their decisions. Well-priced properties continue to attract attention, and experienced REALTORS® are helping both buyers and sellers navigate these changing conditions successfully.”
If you are considering to SELL your home or BUY a home in the next short while,
it would be highly beneficial for you to connect with one of our Team Agents at
Do you want to know what your home is worth today? Click Below for our Online No Obligation Market Evaluation:
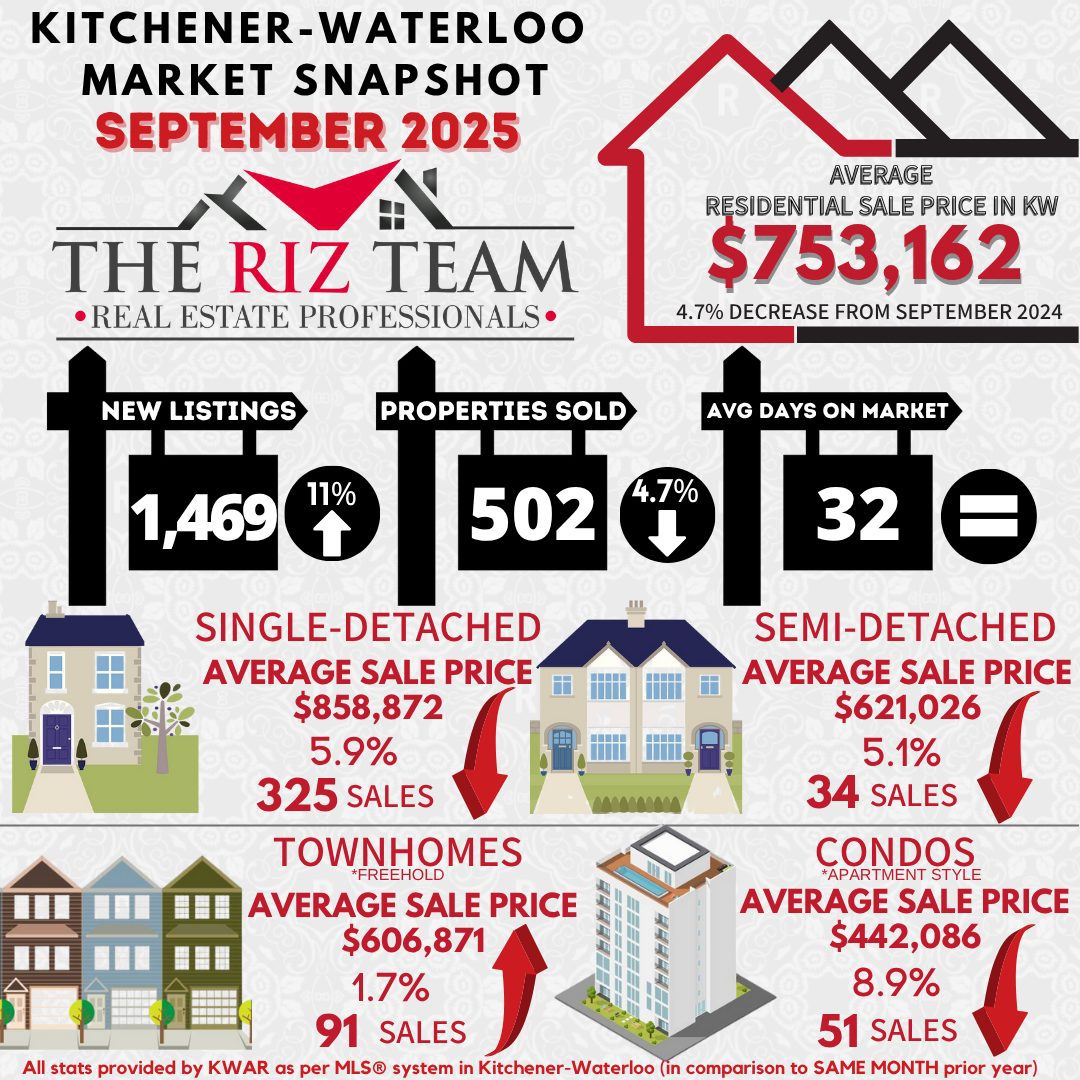
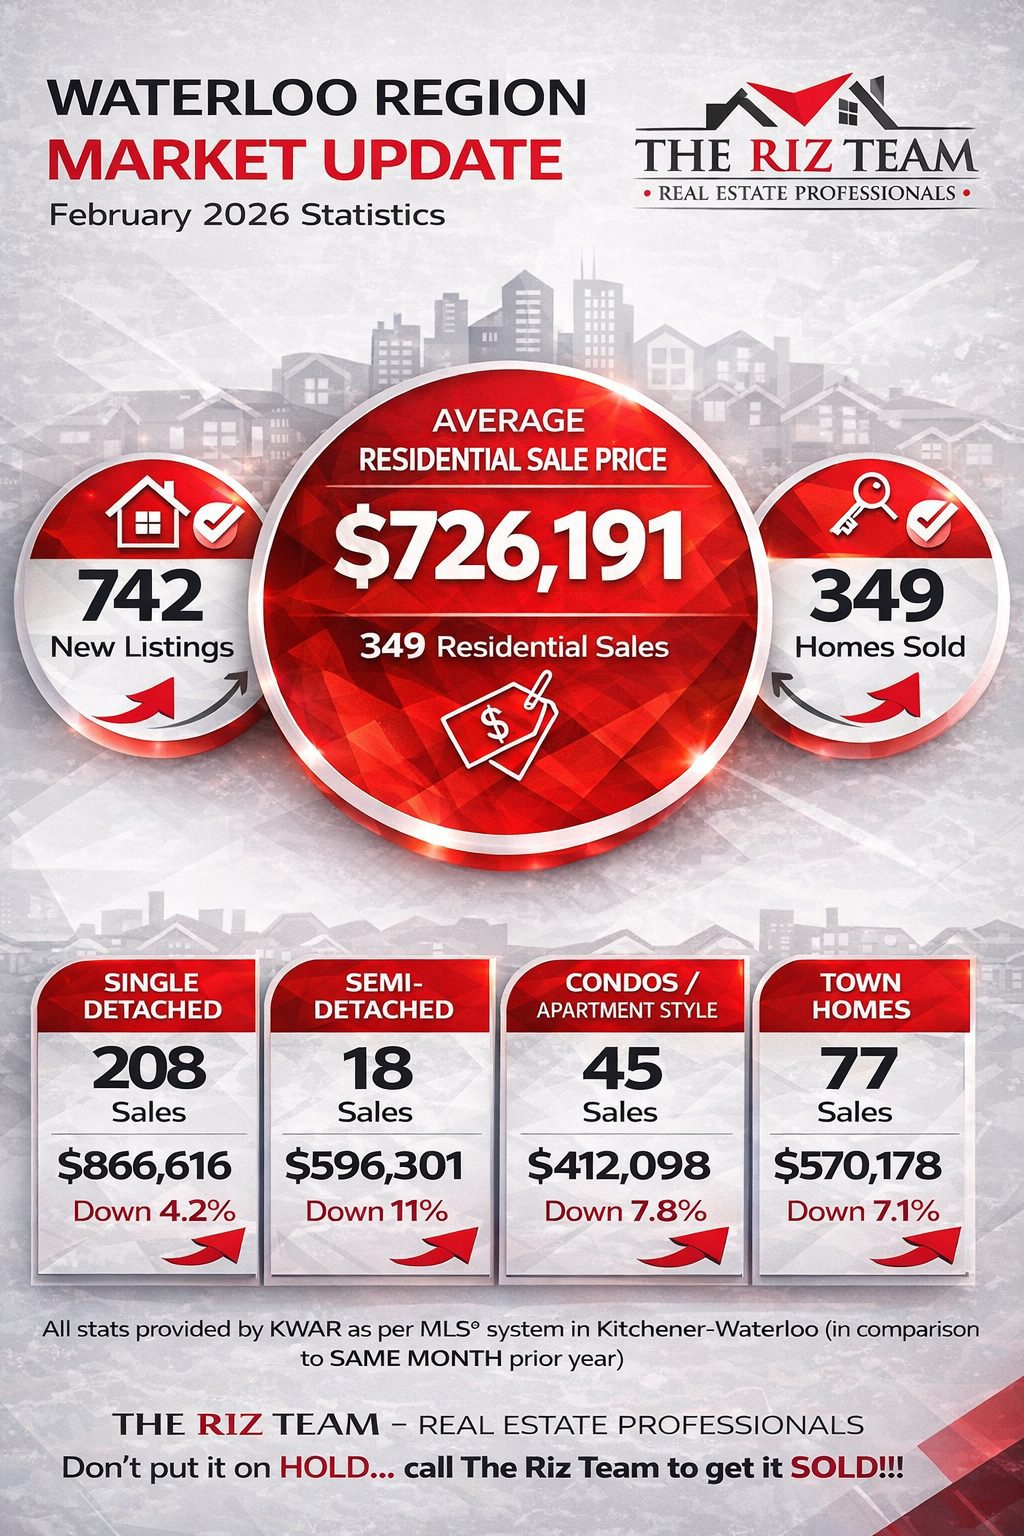
WATERLOO REGION, ON (October 3, 2025) —In September, a total of 502 homes were sold in the Waterloo Region via the Multiple Listing Service® (MLS®) System of the Cornerstone Association of REALTORS® (Cornerstone). This represents a 4.7 per cent decrease compared to the same period last year and a decline of 25.0 per cent compared to the average number of homes sold in the previous ten years for the same month.
Total residential sales in September included 325 detached homes (down 4.1 per cent from September 2024), and 91 townhouses (down 5.2 per cent). Sales also included 51 condominium units (down 13.6 per cent) and 34 semi-detached homes (up 6.3 per cent).
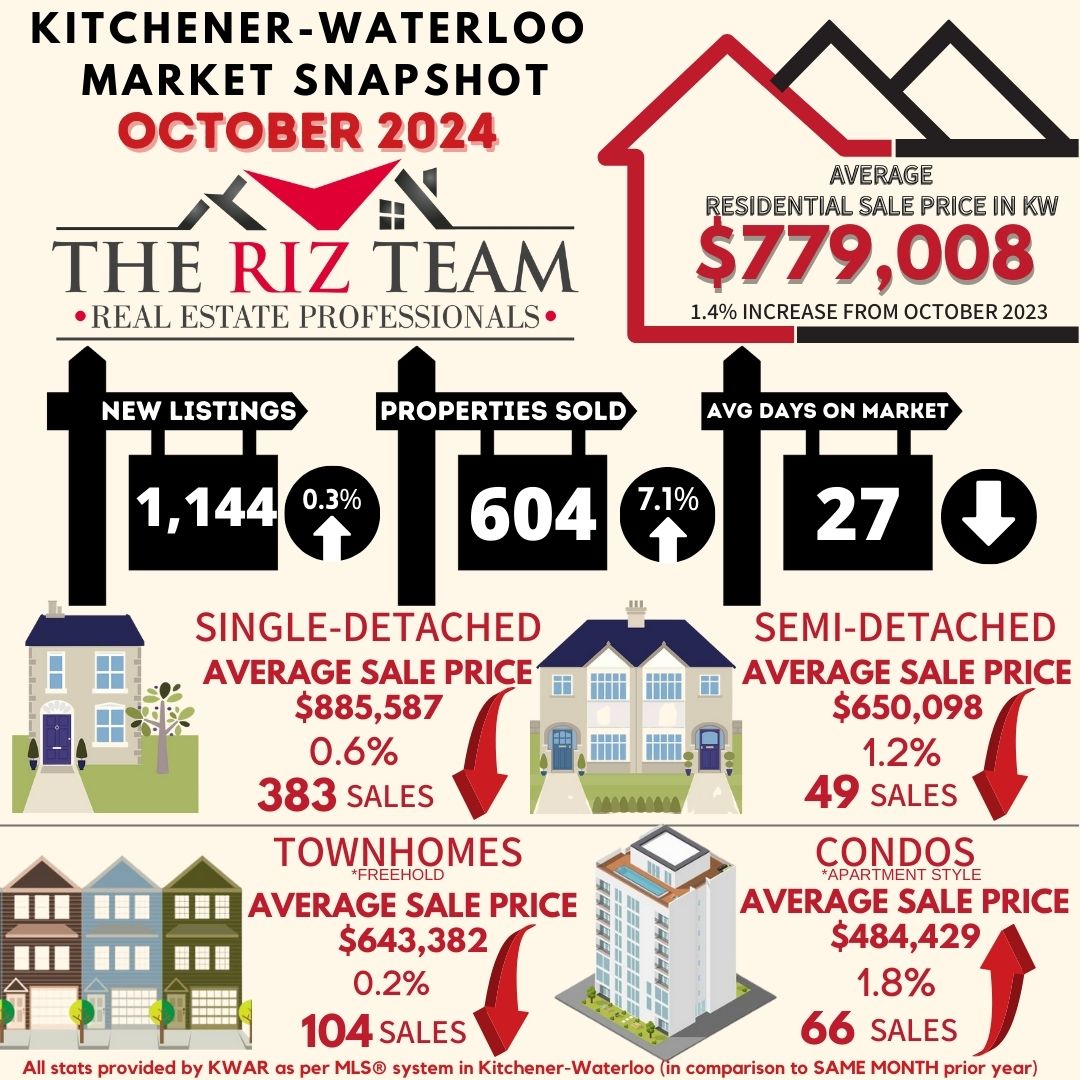
In September, the average sale price for all residential properties in Waterloo Region was $753,162. This represents a 4.7 per cent decrease compared to September 2024 and a 3.2 per cent increase compared to August 2025.
- The average sale price of a detached home was $858,872. This represents a 5.9 per cent decrease from September 2024 and an increase of 1.4 per cent compared to August 2025.
- The average sale price for a townhouse was $606,871. This represents a 1.7 per cent increase from September 2024 and an increase of 1.8 per cent compared to August 2025.
- The average sale price for an apartment-style condominium was $442,086. This represents a 8.9 per cent decrease from September 2024 and an increase of 2.0 per cent compared to August 2025.
- The average sale price for a semi was $621,026. This represents a decrease of 5.1 per cent compared to September 2024 and an increase of 0.5 per cent compared to August 2025.

CORNERSTONE cautions that average sale price information can help establish long-term trends but does not indicate specific properties have increased or decreased in value. The MLS® Home Price Index (HPI) provides the best way to gauge price trends because averages are strongly distorted by changes in the mix of sales activity from one month to the next.
|
MLS® Home Price Index Benchmark Price (HPI)
|
| |
Kitchener-Waterloo |
Cambridge |
| Benchmark Type: |
September 2025 |
Monthly % Change |
Yr./Yr. % Change |
September 2025 |
Monthly % Change |
Yr./Yr. % Change |
| Composite |
$673,100 |
-0.3 |
-7.6 |
$701,700 |
0.1 |
-5.4 |
| Single Family |
$794,600 |
-0.1 |
-5.9 |
$742,700 |
0.1 |
-4.5 |
| Townhouse |
$548,300 |
-1.3 |
-9.0 |
$611,500 |
0.3 |
-4.7 |
| Apartment |
$406,200 |
-0.9 |
-6.8 |
$453,100 |
-0.4 |
-5.9 |

While prices have softened compared to last year, the market is finding its balance. Buyers now have more choice due to inventory levels well above the ten-year average. Moura believes that the fundamentals of our region—its diverse economy, dynamic technology ecosystem, and strong talent base—remain solid foundations of our housing market.
There were 1,469 new listings added to the MLS® System in Waterloo Region last month, an increase 11.0 per cent compared to September last year and a 32.9 per cent increase compared to the previous ten-year average for September.
The total number of homes available for sale in active status at the end of September was 2,094, an increase of 22.2 per cent compared to September of last year and 79.5 per cent above the previous ten-year average of 1,167 listings for September.
The total inventory across the market increased by 29.0 percent, resulting in a 4.0-month supply of all property types by the end of September. Condominium apartments had the highest inventory, with 7.3 months’ supply, followed by townhouses with 4.8 months’ supply and detached homes with 3.3 months’ supply. The number of months of inventory represents the time it would take to sell all current inventories at the current sales rate.
The average time to sell a home in September was 32 days, which was the same in the previous month. In September 2024, it took 28 days for a home to sell, and the five-year average was 19 days.


Cornerstone Association of REALTORS® cautions that average sale price information can help identify long-term trends but should not indicate that specific properties have increased or decreased in value. The average sale price is calculated based on the total dollar volume of all properties sold. Months’ Supply is the inventory of homes for sale at the end of a given month, divided by the average monthly closed sales from the last 12 months. Those requiring specific information on property values should contact a Waterloo Region REALTOR®. REALTORS® have their fingers on the pulse of the market. They know the questions to ask, the areas to probe and what to look for to get a complete picture of the property and community you’re considering.
Media Contact: Crystal Henderson, Chief Stakeholder Officer, 905-529-8101 x 242
ABOUT CORNERSTONE
Cornerstone Association of REALTORS® (Cornerstone) is a not-for-profit organization with over 325 years of collective service from its founding associations.
Established on July 1, 2024, Cornerstone leads with purpose, advocates boldly, and creates positive change for the success of our members throughout Mississauga, Burlington, Hamilton, Waterloo Region, Niagara North, Haldimand County, Norfolk County, and surrounding areas.
With approximately 8,000 members, Cornerstone is the second-largest REALTOR® association in Ontario, dedicated to promoting the greater good of the real estate community.
More information at www.cornerstone.inc
The trademarks REALTOR®, REALTORS®, and the REALTOR® logo are controlled by The Canadian Real Estate Association (CREA) and identify real estate professionals who are members of CREA.
The trademarks MLS®, Multiple Listing Service® and the associated logos are owned by The Canadian Real Estate Association (CREA) and identify the quality of services provided by real estate professionals who are members of CREA. Used under license.