Kitchener-Waterloo Market Snapshot May 2021
Thursday, June 3rd, 2021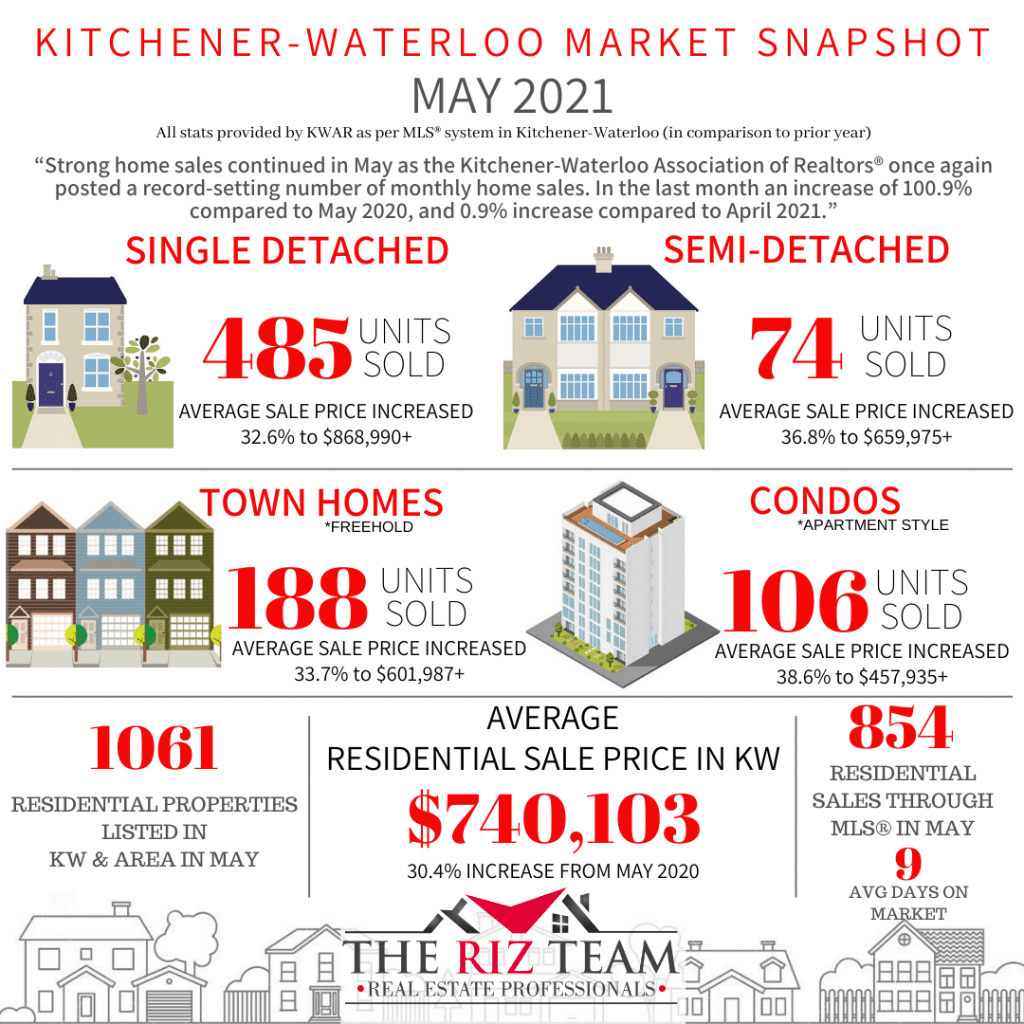
HOMES SALES CONTINUE TO SMASH RECORDS
KITCHENER-WATERLOO, ON (June 3, 2021) –– Strong home sales continued in May as the Kitchener-Waterloo Association of REALTORS® (KWAR) once again posted a record-setting number of monthly home sales. There were 854 residential homes sold through the Multiple Listing Service® (MLS® System) of KWAR last month, an increase of 100.9 per cent compared to May 2020, and a 0.9 per cent increase compared to April 2021.
“While last May home sales were restrained due to the pandemic, May 2021 was another extraordinary month of home buying and selling activity,” says Nicole Pohl, President of KWAR. “Prior to 2020, the previous 10-year average number of residential sales for May was 656.”
Total residential sales in May included 485 detached (up 85.8 per cent from May 2020), and 106 condominium units (up 152.4 per cent). Sales also included 74 semi-detached homes (up 72.1 per cent) and 188 townhouses (up 138 per cent).
In May, the average sale price for all residential properties in the Kitchener-Waterloo area was $740,103. This represents a 30.4 per cent increase over May 2020 and a 2.4 per cent decrease compared to April 2021.
-
-
- The average price of a detached home was $868,990. This represents a 32.6 per cent increase from May 2020 and a decrease of 3.4 per cent compared to April 2021.
- The average sale price for an apartment-style condominium was $457,935. This represents an increase of 38.6 per cent from May 2020 and an increase of 3.1 per cent compared to April 2021.
- The average sale price for a townhouse was $601,987. This represents a 33.7 per cent increase from May 2020 and a decrease of 1.8 per cent compared to April 2021.
- The average sale price for a semi was $659,975. This represents an increase of 36.8 per cent compared to May 2020 and an increase of 1.2 per cent compared to April 2021.
-
“Last month the market took a breath and calmed a bit, but there is still very strong demand throughout our region,” says Pohl. “This started prior to the new mortgage stress test that came into effect on June 1. While these changes will impact the affordability for some, I do not expect it to be very impactful due to the sheer number of buyers in our market.”
Average Sales Price – By Property Type

KWAR cautions that average sale price information can be useful in establishing long-term trends but should not be used as an indicator that specific properties have increased or decreased in value. The MLS® Home Price Index (HPI) provides the best way to gauge price trends because averages are strongly distorted by changes in the mix of sales activity from one month to the next.
The MLS® HPI composite benchmark price for all residential properties in Kitchener-Waterloo was $749,100 in May. This represents a 35.8 per cent increase over May 2020 and a 0.4 per cent increase compared to April 2021.
-
-
- The benchmark price for a detached home was $815,800. This represents a 35.8 per cent increase from May 2020 and 0.8 per cent decrease compared to April 2021.
- The benchmark price for an apartment-style condominium was $373,700. This represents a 16.9 per cent increase from May 2020 and a 2.1 per cent decrease compared to April 2021.
- The benchmark price for a townhouse is $574,900. This represents a 49 per cent increase from May 2020 and a 0.5 per cent decrease compared to April 2021.
-

There were 1,061 new listings added to the MLS® System in KW and area last month, an increase of 83.2 per cent compared to May of last year, and a 2.6 per cent increase compared to the previous ten-year average for May* (*calculated from 2010 to 2019 to adjust for the impact of the state of emergency on activity in May 2020).
The total number of homes available for sale in active status at the end of May was 448, a decrease of 20. per cent compared to May of last year, and 70.5 per cent below the previous ten-year average of 1,520 listings for May* (*calculated from 2010 to 2019 to adjust for the impact of the state of emergency on activity in May 2020).
The number of months of inventory was 0.7 in May, which is unchanged from April. Inventory has numbered less than 1 month since October. The number of months of inventory represents how long it would take to sell off current inventories at the current rate of sales.
The average number of days to sell in May was 9 days, compared to 21 days in May 2020 and a previous 5-year average of 20 days.
Those requiring specific information on property values should contact a local REALTOR®. Working with a Realtor is the best way to get a complete picture of the property and community you are considering.
View our HPI tool here to learn more: https://kwar.ca/hpi-dashboard
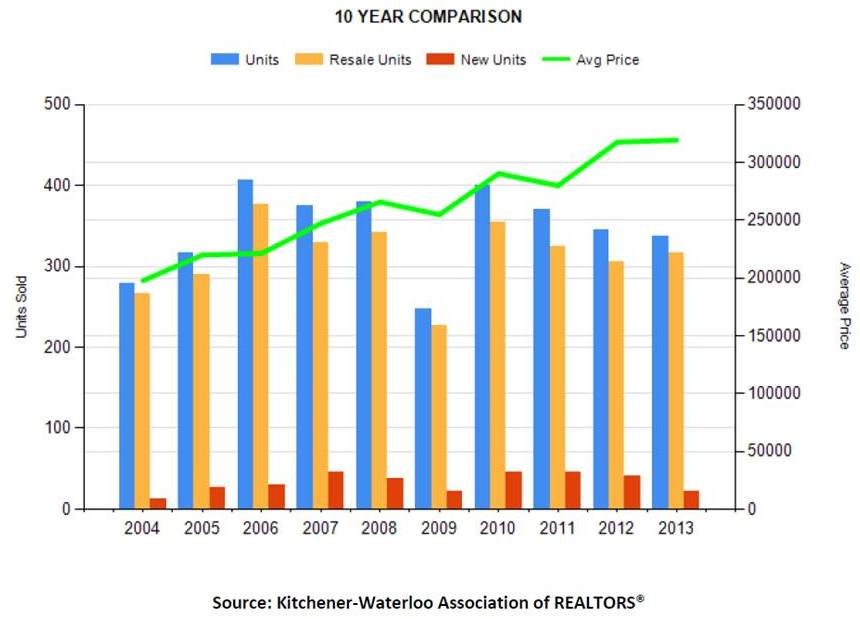
Historical Sales By Property Type

Months Supply of Homes for Sale

Historical Median Sales Price – By Property Type

Historical Average Sales Price – By Property Type


KWAR cautions that average sale price information can be useful in establishing long term trends but should not be used as an indicator that specific properties have increased or decreased in value. The average sale price is calculated based on the total dollar volume of all properties sold. Months Supply is the inventory of homes for sale at the end of a given month, divided by the average monthly closed sales from the last 12 months Those requiring specific information on property values should contact a local REALTOR®. REALTORS® have their fingers on the pulse of the market. They know the questions to ask, the areas to probe and what to look for so that you get a complete picture of the property and community you’re considering.