Posts Tagged ‘www.rizsellskw.com’
Friday, January 5th, 2024
Annual Home Sales Down Significantly in Waterloo Region in 2023
If you are considering to Sell your home or Buy a home in the next short while it would be highly beneficial for you to connect with one of our Team Agents at
Do you want to know what your home is worth today? Click Below for our Online No Obligation Market Evaluation
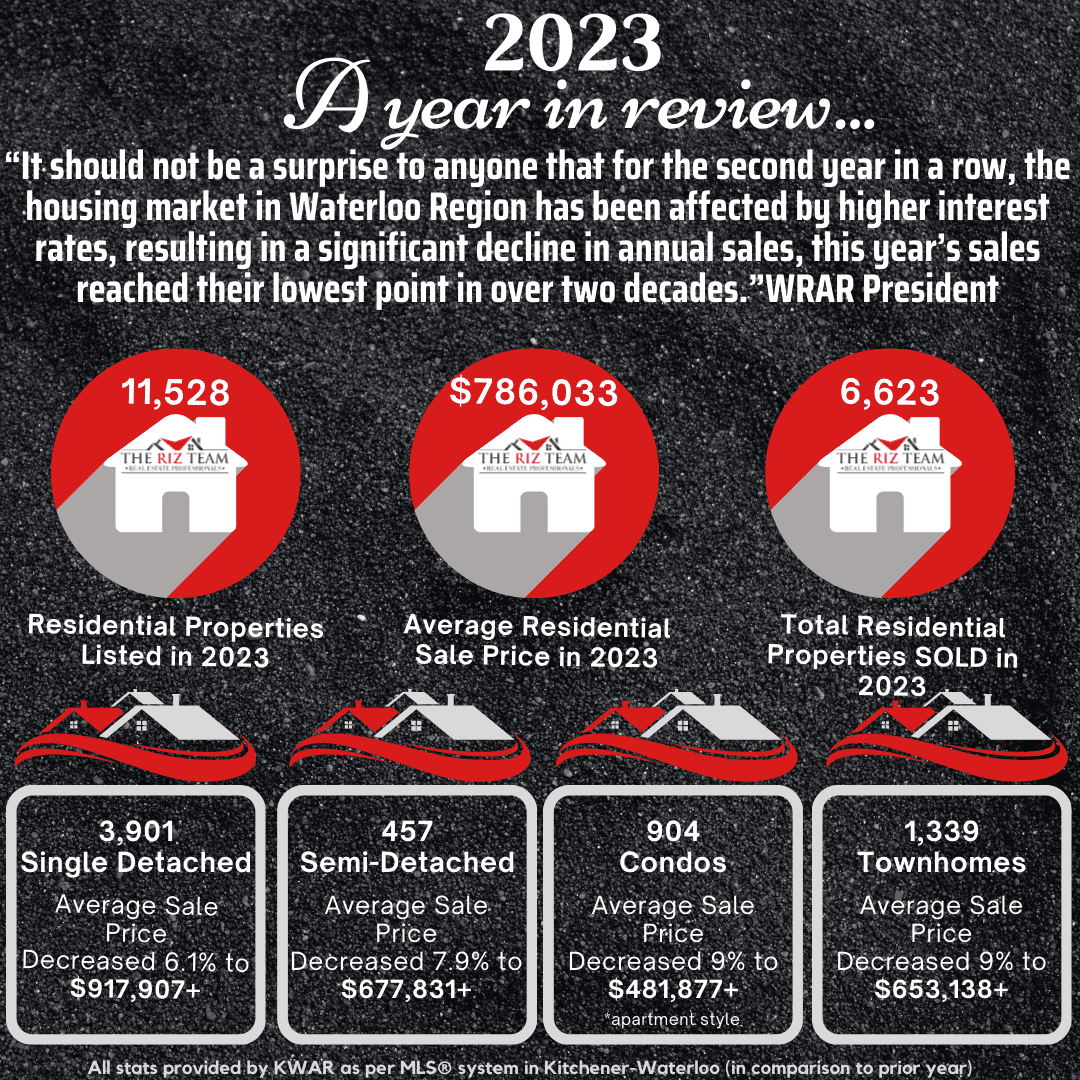
WATERLOO REGION, ON (January 5, 2024) — There were 6,623 homes sold through the Multiple Listing Service® (MLS®) System of the Waterloo Region Association of REALTORS® (WRAR) in 2023, a decrease of 14.8 per cent compared to 2022, and a decline of 23.2 per cent compared to the previous 5-year average for annual sales.
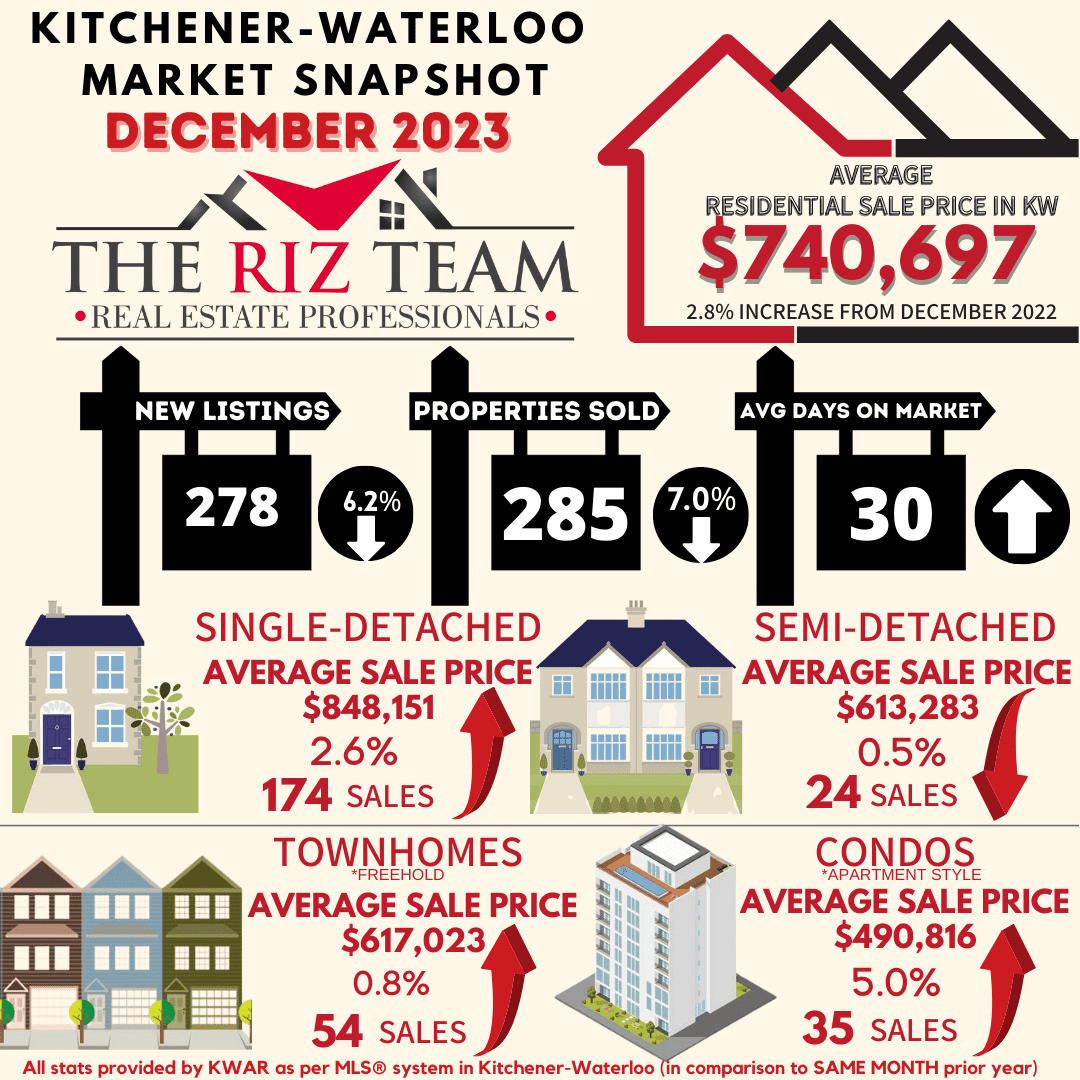
On a monthly basis, there were 285 homes sold in December, a decrease of 0.7 per cent compared to December 2022, and 25.6 per cent below the previous 5-year average for the month.
“It should not be a surprise to anyone that for the second year in a row, the housing market in Waterloo Region has been affected by higher interest rates, resulting in a significant decline in annual sales,” says Christal Moura, President of WRAR. “This year’s sales reached their lowest point in over two decades.”
According to Moura, the trend observed in December reflects the overall slowdown in home sales throughout the year, with sales falling behind historical levels. The last time annual sales in Waterloo Region recorded fewer than 7,000 units was the year 2000.
Total residential sales in December included 172 detached (up 3.6 per cent from December 2022), and 54 townhouses (down 6.9 per cent). Sales also included 35 condominium units (up 2.9 per cent) and 24 semi-detached homes (down 4.0 per cent).
For 2023, total residential sales included 3,901 detached (down 17.0 per cent), and 1,339 townhouses (down 6.5 per cent). Sales also included 904 condominium units (down 9.2 per cent) and 457 semi-detached homes (down 26.6 per cent).
In December, the average sale price for all residential properties in Waterloo Region was $740,697. This represents a 2.8 per cent increase compared to December 2022 and a 2.1 per cent decrease compared to November 2023.
- The average price of a detached home was $848,151. This represents a 2.6 per cent increase from December 2022 and a decrease of 4.7 per cent compared to November 2023.
- The average sale price for a townhouse was $617,023. This represents a 0.8 per cent increase from December 2022 and an increase of 1.2 per cent compared to November 2023.
- The average sale price for an apartment-style condominium was $490,816. This represents a 5.0 per cent increase from December 2022 and an increase of 9.0 per cent compared to November 2023.
- The average sale price for a semi was $613,283. This represents a decrease of 0.5 per cent compared to December 2022 and a decrease of 0.5 per cent compared to November 2023.
“Waterloo Region’s slowing housing market echoes the overall slowdown we are seeing in the broader economy,” says Moura.”
There were 287 new listings added to the MLS® System in the Waterloo Region last month, a decrease of 6.2 per cent compared to December of last year and a 17.9 per cent decrease compared to the previous ten-year average for December.
In 2023, 11,528 new listings were added to WRAR’s MLS® System, a decrease of 14.4 per cent compared to 2022, and a 4.4 per cent decrease compared to the previous ten-year annual average.
The total number of homes available for sale in active status at the end of December was 779, an increase of 36.0 per cent compared to December of last year and 5.8 per cent above the previous ten-year average of 736 listings for December.
The number of months of inventory is up 55.6 per cent compared to December of last year, but still historically low at 1.4 months. Between 2010 and 2015, December’s rolling 12-month average was 3.5 months. The number of months of inventory represents how long it would take to sell off current inventories at the current sales rate.
The average number of days to sell in December was 30, compared to 25 days in December 2022. The previous 5-year average is 23 days.
The average days to sell in 2023 was 19 days, compared to 14 days in 2022 and a previous 5-year average of 18 days.
“While the dream of homeownership is alive, it is not quite well,” says Moura. “Housing continues to be less accessible to too many people in our region. This speaks to the pressing need for not just more housing to be built, but housing that spans all forms and economic strata, to ensure everyone has a suitable place to call home.”
Those requiring specific information on property values should contact a local REALTOR®. Working with a Realtor is the best way to get a complete picture of the property and community you are considering.
View our HPI tool here to learn more: https://wrar.ca/hpi/
Tags: buyers, for sale, home sales, kitchener, Kitchener Buyers, kitchener real estate, kitchener-waterloo, kitchener-waterloo association of realtors, Market Update, royal lepage, the riz team, Waterloo Buyers, Waterloo Homes, waterloo real estate, waterloo realtor, Waterloo Sellers, www.rizsellskw.com
Posted in Kitchener Buyers, Kitchener Sellers, Market Stats, Market Update, Real Estate News, Realtor Tips, Waterloo Buyers, Waterloo Sellers | Comments Off on Kitchener Waterloo Market Snapshot & Yearly Summary December 2023
Saturday, November 4th, 2023
Home Sales Picked up in October but Still Subdued
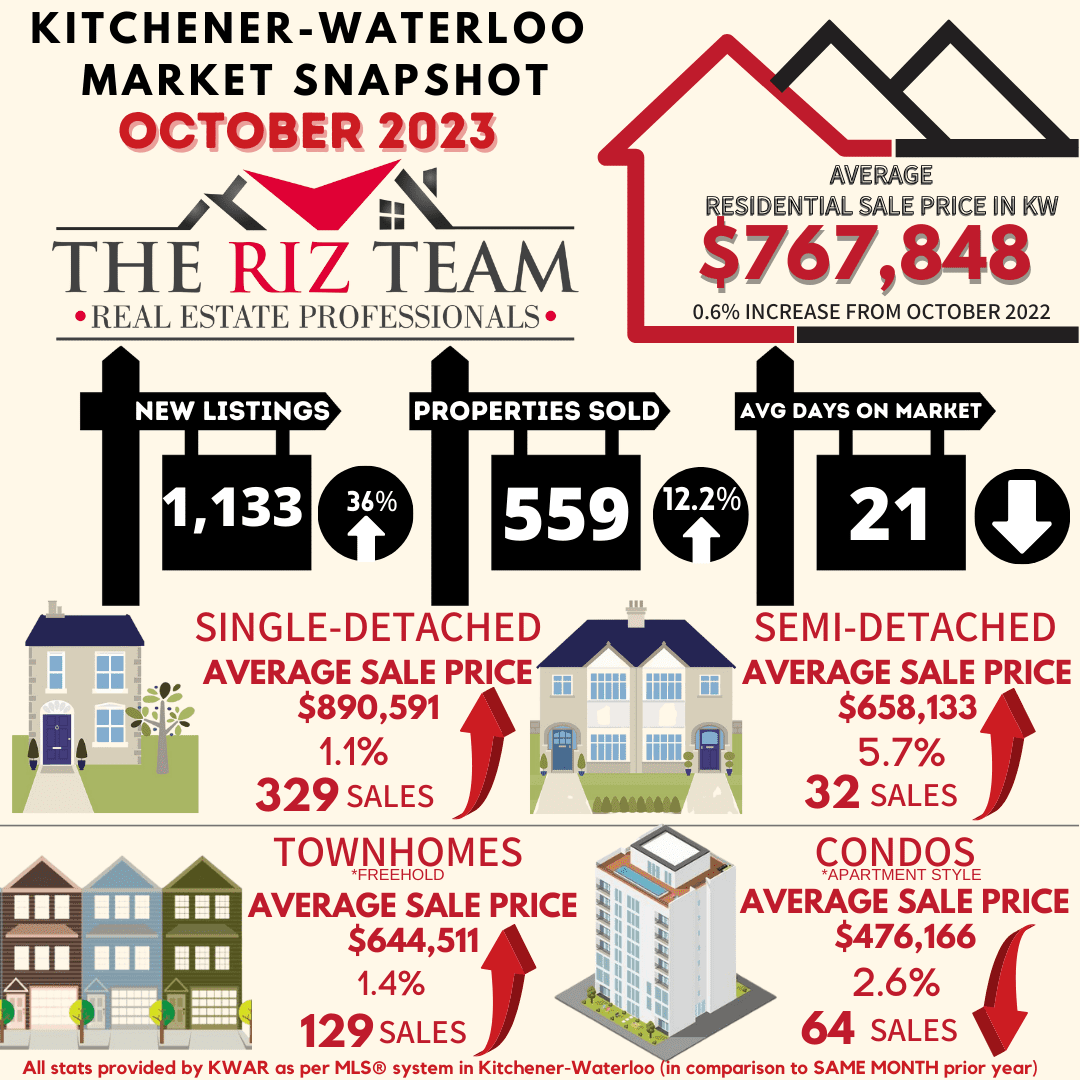
This article will provide a comprehensive snapshot of the KW real estate market for October 2023.
“Homes sales in the Waterloo Region were up over last October’s record low but are still subdued,” says Megan Bell, president of WRAR. “I breathed a sigh of relief last week when the Bank of Canada held its policy rate at 5 per cent, and I will be watching to see what the Bank of Canada does at their next scheduled announcement on December 6, 2023.”
If you are considering to Sell your home or Buy a home in the next short while it would be highly beneficial for you to connect with one of our Team Agents at
Do you want to know what your home is worth today? Click Below for our Online No Obligation Market Evaluation
Tags: buyers, Homes For Sale, kitchener-waterloo association of realtors, KW Market Update, realtor, Royal Lepage Wolle Realty, sales representative, the riz team, Waterloo Buyers, Waterloo Homes, waterloo real estate, Waterloo Sellers, www.rizsellskw.com
Posted in Kitchener Buyers, Kitchener Sellers, Market Stats, Market Update, Real Estate News, Realtor Tips, Waterloo Buyers, Waterloo Sellers | Comments Off on Kitchener Waterloo Market Snapshot October 2023
Wednesday, July 6th, 2022
HOME PRICES CONTINUE TO DIP AS MONTHS SUPPLY RETURNS TO PRE-PANDEMIC LEVEL
If you are considering to Sell your home or Buy a home in the next short while it would be highly beneficial for you to connect with one of our Team Agents at
Do you want to know what your home is worth today? Click Below for our Online No Obligation Market Evaluation

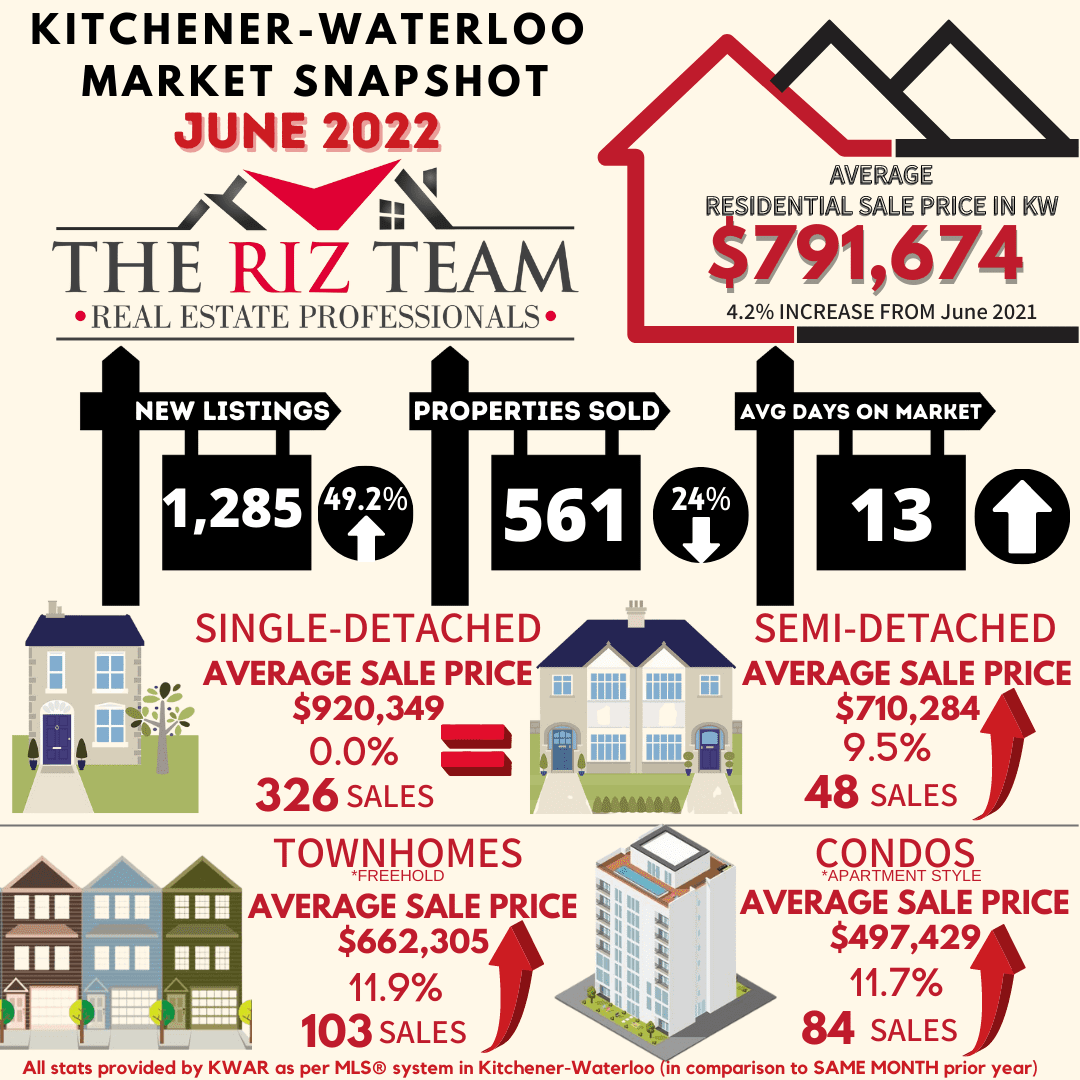
The Riz Team monthly market stats June 2022. Kitchener Waterloo, ON.
There were 561 residential homes sold through the Multiple Listing Service® System (MLS® System) of the Kitchener-Waterloo Association of REALTORS® (KWAR) in June, a decrease of 24.0 per cent compared to the same month last year, and 17.3 per cent below the previous 5-year average. “For the fourth consecutive month we’re seeing home prices moderate as the number of properties available for sale has steadily increased” says Megan Bell, President of KWAR. “In June the average price of a detached home has levelled off to where it was this time last year.”
Total residential sales in June included 326 detached (down 20.7 per cent from June 2021), and 103 townhouses (down 32.2 per cent). Sales also included 84 condominium units (down 18.4 per cent) and 48 semi-detached homes (down 33.3 per cent).
In June, the average sale price for all residential properties in the Kitchener-Waterloo area was $791,674. This represents a 4.2 per cent increase over June 2021 and a 9.6 per cent decrease compared to May 2022.
- The average price of a detached home was $920,349. This represents a 0.0 per cent change from June 2021 and a decrease 9.5 per cent compared to May 2022.
- The average sale price for a townhouse was $662,305. This represents a 11.9 per cent increase from June 2021 and a decrease of 6.5 per cent compared to May 2022.
- The average sale price for an apartment-style condominium was $497,429. This represents an increase of 11.7 per cent from June 2021 and a decrease of 8.9 per cent compared to May 2022.
- The average sale price for a semi was $710,284. This represents an increase of 9.5 per cent compared to June 2021 and a decrease of 2.8 per cent compared to May 2022.

KWAR cautions that average sale price information can be useful in establishing long-term trends but should not be used as an indicator that specific properties have increased or decreased in value. The MLS® Home Price Index (HPI) provides the best way to gauge price trends because averages are strongly distorted by changes in the mix of sales activity from one month to the next.
The MLS® HPI composite benchmark price for all residential properties in Kitchener-Waterloo was $790,600 in June. This represents a 6.8 per cent increase over June 2021 and a 6.8 per cent decrease compared to May 2022.
- The benchmark price for a detached home was $876,600. This represents a 5.3 per cent increase from June 2021 and 7.3 per cent decrease compared to May 2022.
- The benchmark price for a townhouse is $676,900. This represents a 15.8 per cent increase from June 2021 and a 7.1 per cent decrease compared to May 2022.
- The benchmark price for an apartment-style condominium was $537,100. This represents a 24.2 per cent increase from June 2021 and a 2.4 per cent decrease compared to May 2022.

“This time last year, sales were going through the roof,” says Bell. “The home buying scene is a little different this year with folks finally taking their postponed trips, attending weddings, and generally catching up on the many missed occasions of the past two years.” Of course, recent hikes in mortgage rates are also contributing to sales cooling, notes KWAR’s president.
“While any shift in the market will result in some individuals predicting the worse, the simple reality is that the market we had been in was unsustainable,” says Bell. “What this means for buyers is more inventory, more choices, and perhaps most importantly, potentially less stress when purchasing. For sellers, they need to ensure their properties stand out from the competition and be aware it may take more time to sell their home and for potentially less money than they were expecting.”
There were 1,285 new listings added to the MLS® System in KW and area last month, an increase of 49.2 per cent compared to June of last year, and a 41.7 per cent increase compared to the previous ten-year average for June.
The total number of homes available for sale in active status at the end of June was 991, an increase of 165.0 per cent compared to June of last year, and 20.6 per cent below the previous ten-year average of 1249 listings for June.
The number of months of inventory increased to 1.8 months in June from 1.6 months in May. While inventory is still at historic lows, this is the highest it’s been since September 2019 and a return to where inventory was in the pre-pandemic June of 2019. The number of months of inventory represents how long it would take to sell off current inventories at the current rate of sales.
The average number of days to sell in June was 13 days, compared to 11 days in June 2021. The previous 5-year average is 17 days.
Those requiring specific information on property values should contact a local REALTOR®. Working with a Realtor is the best way to get a complete picture of the property and community you are considering.
View our HPI tool here to learn more: https://kwar.ca/hpi-dashboard
Historical Sales By Property Type

Months Supply of Homes for Sale

Historical Median Sales Price – By Property Type

Historical Average Sales Price – By Property Type

Average Days on Market

KWAR cautions that average sale price information can be useful in establishing long term trends but should not be used as an indicator that specific properties have increased or decreased in value. The average sale price is calculated based on the total dollar volume of all properties sold. Months Supply is the inventory of homes for sale at the end of a given month, divided by the average monthly closed sales from the last 12 months Those requiring specific information on property values should contact a local REALTOR®. REALTORS® have their fingers on the pulse of the market. They know the questions to ask, the areas to probe and what to look for so that you get a complete picture of the property and community you’re considering.
Tags: buyers, kitchener, Kitchener Buyers, kitchener real estate, Kitchener Sellers, kitchener-waterloo, kitchener-waterloo association of realtors, KW Real Estate, rizsellskw.com, TheRizTeam, waterloo real estate, www.rizsellskw.com
Posted in Enhance Your Home, Kitchener Buyers, Kitchener Sellers, Market Stats, Market Update, Real Estate News, Realtor Tips, Uncategorized, Waterloo Buyers, Waterloo Sellers | Comments Off on Kitchener Waterloo Market Snapshot June 2022
Saturday, August 8th, 2020
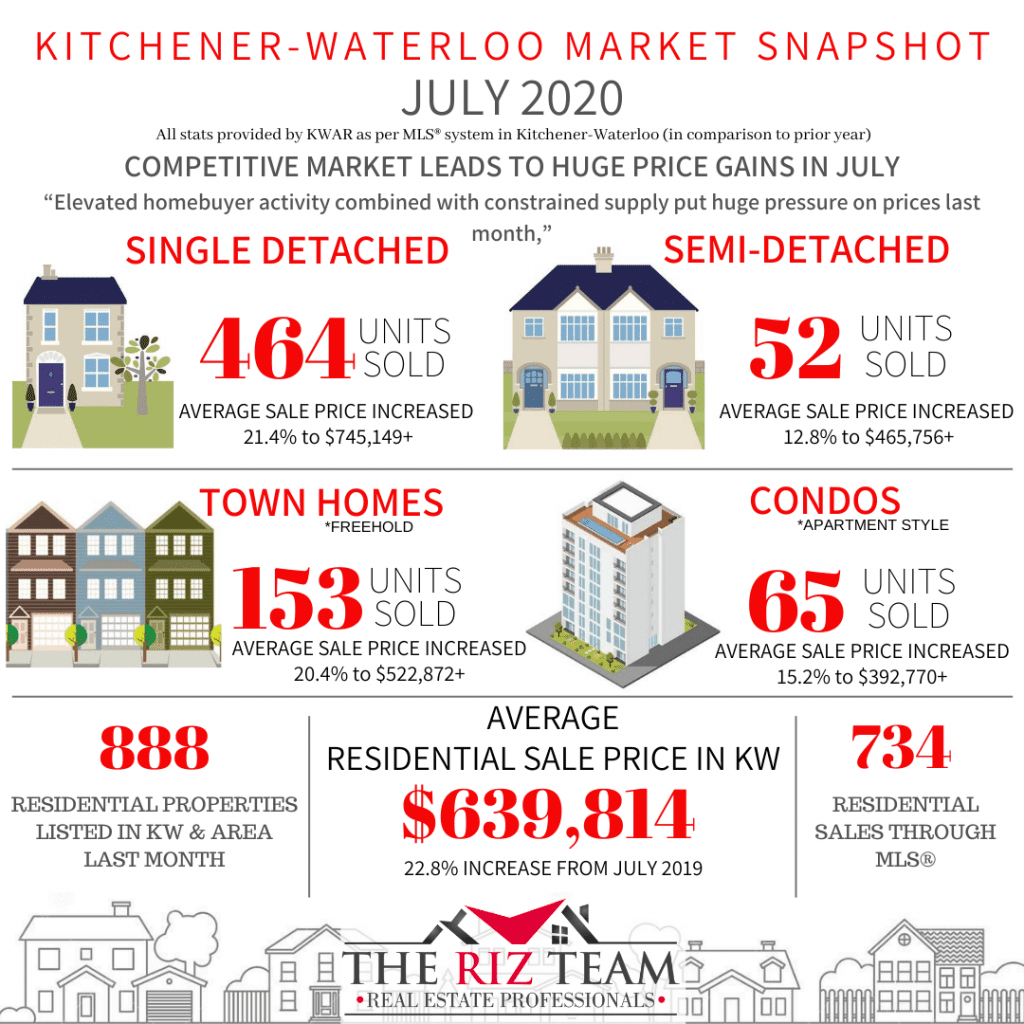
COMPETITIVE MARKET LEADS TO HUGE PRICE GAINS IN JULY
There were 734 residential homes sold through the Multiple Listing System (MLS® System) of the Kitchener-Waterloo Association of REALTORS® in July, an increase of 25.7 per cent compared to the same month last year, and well above the previous ten-year average for July of 531.
“Competition was high for buyers looking to lock down a house in July,” said Colleen Koehler, President of KWAR. “The rate of home sales in July resembled the kind of month we would normally see in May, and I chalk up much of that to the pent up demand that built as we moved into Stage 3 of reopening in mid-July.”
Total residential sales in July included 464 detached homes (up 39.3 per cent from July 2019), and 65 condominium apartments (up 3.2 per cent). Sales also included 153 townhouses (up 4.8 per cent) and 52 semi-detached homes (up 23.8 per cent).
The average sale price of all residential properties sold in July increased 22.8 per cent to $639,814 compared to the same month last year, while detached homes sold for an average price of $745,149 an increase of 21.4 per cent. During this same period, the average sale price for an apartment-style condominium was $392,770 for an increase of 15.2 per cent. Townhomes and semis sold for an average of $465,756 (up 12.8 per cent) and $522,872 (up 20.4 per cent) respectively.
The median price of all residential properties sold in July increased 21.7 per cent to $595,000 and the median price of a detached home during the same period increased 17.4 per cent to $675,000.
“Elevated homebuyer activity combined with constrained supply put huge pressure on prices last month,” said Koehler. “Homebuyers remain very confident about owning a home in Waterloo Region, and with mortgage rates still at near-record-low levels I expect we will continue to see strong home buyer demand going into the fall”.
There were 888 new listings added to the MLS® System in KW and area last month, an increase of 4.3 per cent compared to July of last year, and 15.5 per cent more than the previous ten-year average for July.
The total number of homes available for sale in active status at the end of July was 592, a decrease of 32.6 per cent compared to July of last year.
The number of Months Supply (also known as absorption rate) continues to be very low at just 1.3 months for the month of July, 27.8 per cent below the same period last year. The previous ten-year average supply of homes for July was 3.1 months, and in the past 5 years, the average supply for July was 2.1 months.
The average days to sell in July was 17 days, compared to 22 days in July 2019.
Koehler notes real estate was deemed an essential service from the beginning of the lockdown and REALTORS® have been taking all the necessary precautions to ensure transactions are done safely. KWAR’s president advises consumers talk to their Realtor® about what measures they will be taking to protect your health and safety as they help you on your real estate journey.
KWAR cautions that average sale price information can be useful in establishing long term trends but should not be used as an indicator that specific properties have increased or decreased in value. The average sale price is calculated based on the total dollar volume of all properties sold. Months Supply is the inventory of homes for sale at the end of a given month, divided by the average monthly closed sales from the last 12 months Those requiring specific information on property values should contact a local REALTOR®. REALTORS® have their fingers on the pulse of the market. They know the questions to ask, the areas to probe and what to look for so that you get a complete picture of the property and community you’re considering.
Historical Sales By Property Type

Months Supply of Homes for Sale

Historical Median Sales Price – By Property Type

Historical Average Sales Price – By Property Type

Historical Sales – By Price Range

Average Days on Market

Tags: buyers, for sale, home sales, Homes For Sale, kitchener, kitchener for sale, kitchener real estate, Kitchener Sellers, kitchener-waterloo, kitchener-waterloo association of realtors, KW Market Update, Market Update, real estate, real estate market, realtor, riz jadavji, royal lepage, Royal Lepage Wolle Realty, sales representative, the riz team, waterloo, Waterloo Buyers, waterloo for sale, Waterloo Homes, waterloo real estate, waterloo realtor, Waterloo Sellers, www.rizsellskw.com
Posted in Market Stats, Market Update | Comments Off on Kitchener Market Snapshot for July 2020
Monday, July 27th, 2015
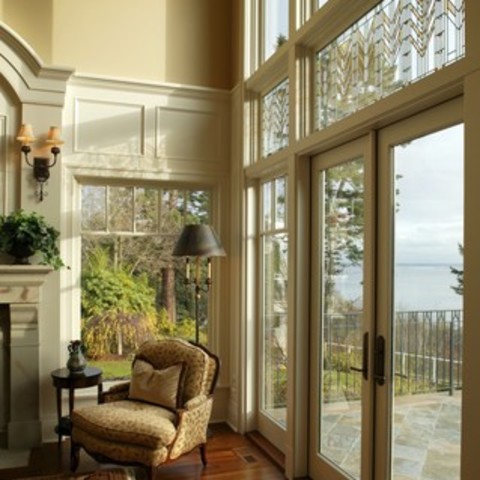 Screen doors let the breeze in and keep the bugs out. They open your home to the sounds and scents of summer, and help cool your house without wasting energy on air conditioning. Want to let in a little more summer this year? Here’s what you need to know about picking the perfect door.
Screen doors have come a long way from the hard-to-open metal models and flapping wood doors of your childhood. Available in metal, vinyl or wood, many feature smooth hydraulic or pneumatic closers and springs or chain stops that keep them from slamming shut or swinging open. Designed for both practicality and curb appeal, doors are available in a wide variety of colours, styles and finishes. Your choices include:
1. Basic vinyl or aluminum. Durable and affordable, these doors come in a surprising variety of attractive styles; you’ll find everything from traditional designs to art deco-inspired geometrics.
2. Storm/screen door combo. Traditionally, people replace the screen door with a storm door in the winter. A combination door makes the “swap” easier; simply remove or slide the glass down in summer and replace it with a screen.
3. Wood. From rustic doors featuring carved animals to pretty “granny doors,” wood can really add to the look of your home. However, winter cold and damp can be hard on them, so manufacturers suggest that you take them down when it gets cold to prevent warping.
4. Sliding. Inexpensive and easy to maintain, sliding screen doors that go with patio doors make it easy to open up your home to a fresh breeze.
5. Retractable screens. If you don’t like the look of a screen door, these are a great option, and are available at your local home improvement store. Screens pull out from the sides and lock shut with a magnetic catch. Handy homeowners will be able to install them with little effort.
With the right screen door for your home, comfort and curb appeal are a breeze!
Tips for installation
Thinking about installing your screen door yourself? Manufacturers include installation instructions that only require hand tools, but most DIY resources suggest an intermediate level of “handiness.” If that doesn’t sound like you, consider using an experienced carpenter or the store’s installation service.
Condo Cool
You don’t have to live in a house to kick back and enjoy the breeze. Welcome summer into your space by installing a screen door to your balcony. It’s a great way to make your indoor and outdoor spaces feel unified and to make your condo feel more spacious.
Tags: buyers, for sale, home sales, Homes For Sale, kitchener, Kitchener Buyers, kitchener for sale, Kitchener Homes, kitchener real estate, kitchener realtor, kitchener-waterloo, kitchener-waterloo association of realtors, riz jadavji, Riz Sells KW, rizsellskw, rizsellskw.com, royal lepage, Royal Lepage Wolle Realty, Waterloo Buyers, waterloo for sale, Waterloo Homes, waterloo real estate, waterloo realtor, Waterloo Sellers, www.rizsellskw.com
Posted in Enhance Your Home, For Sale, From The Riz Team, Kitchener Buyers, Kitchener Sellers, Realtor Tips, Uncategorized, Waterloo Buyers, Waterloo Sellers | Comments Off on Screen Door Decor
Wednesday, July 15th, 2015
Looking for that cottage life?
Do you have a dream of owning a place outside of the city where you can escape, kick back and relax? If so, you’re not alone. As demand continues to increase and average prices continue to rise, now more than ever you will need to be patient, establish a list of ‘musts’ and work with a Realtor who understands the recreational market, if you want your dreams to come true.
To begin your search, target potential areas and consider a road-trip to visit your most coveted spots. Once you find your ideal location, narrow your search by establishing a list of priorities. Do you plan to use your recreational property for seasonal versus year-round use? Do you wish to build a new cottage or buy an existing one? What are your hobbies? Is proximity to hospitals, public transit or schools important? If you are near water, lakes can vary tremendously in terms of allowances for boating, fishing and swimming. In the winter, do you want to use both cross-country and downhill skiing facilities?
With your priorities established, you will also be in a strong position to act fast if you need to. Popular sites are in demand.
Buying a recreational property can be considerably more complex than a standard home purchase and it generally takes longer. There is considerably more time and travel involved. The effort, according to a growing number of Canadians, is more than worth it.
Before you begin your search, give me a call. I can get you started down the right path toward your home away from home. If I cannot assist you directly in your purchase transaction, I can refer you to a quality Royal LePage Realtor in your desired area from our network of over 13,000 real estate professionals from coast to coast.
For the most recent Royal LePage Recreational Property Report, visit www.royallepage.ca and click Press Releases.,Demystifying Mortgages – How Much Can You Borrow?
A home is typically the largest purchase you will make in your lifetime, and for most Canadians this means obtaining a mortgage. The amount of your mortgage will determine the size and location of your new home – not to mention the size of your payments. So how do lending institutions decide how large your mortgage loan can be?
Call RIZ today to purchase your home away from home! 519-716-7253 (direct)


Tags: buyers, for sale, home sales, Homes For Sale, kitchener, Kitchener Buyers, kitchener for sale, Kitchener Homes, kitchener real estate, kitchener-waterloo, kitchener-waterloo association of realtors, kw, riz jadavji, Riz Sells KW, rizsellskw, royal lepage, Royal Lepage Wolle Realty, sales representative, seller's tips, Waterloo Homes, waterloo real estate, waterloo realtor, Waterloo Sellers, www.rizsellskw.com
Posted in Elegance & Opulence to Dream, For Sale, From The Riz Team, Kitchener Buyers, Kitchener Sellers, Real Estate Listings, Real Estate News, Realtor Tips, Uncategorized, Waterloo Buyers, Waterloo Sellers | Comments Off on Home away from Home…
Tuesday, July 7th, 2015
What goes under foot is seldom an easy decision. Colour, surface texture, room usage and price all come into play. Today, greener options abound, adding to the myriad of choices already available.
Increasing interest in incorporating renewable resources into the home has resulted in many beautiful eco-friendly flooring options.
For homeowners looking on the greener side, it’s worth a look at the many sustainable products available today:
• Give a tree another lease on life with salvaged wood flooring. A rustic look can be created with reclaimed wood. Buying reclaimed lumber continues to get easier, and in some instances, less expensive relative to the cost of new hardwoods.
• Bamboo is a good option for rooms with low humidity. High abundance and a natural look make sustainable bamboo an attractive flooring option. Bamboo grows to maturity in three to five years, about a quarter of the time it takes to grow trees used for hardwood.
• Linoleum flooring has retained its popularity over decades. Unlike vinyl flooring, which is a synthetic product made of chlorinated petrochemicals, linoleum is manufactured from natural compounds including linseed oil, cork dust, tree resins and ground limestone. With natural, renewable elements used in its manufacturing, this eco-friendly flooring option continues to remain a popular option.
• Cork flooring has many eco-friendly attributes. Like bamboo, cork is quickly renewable. It is harvested from the bark of the cork oak tree and grows back every three years. Cork has anti-microbial properties to reduce allergens, is fire retardant and provides a comfortable feel under foot. Cork flooring can be finished in a variety of paints and stains to complement any room setting.
• Polyester (P.E.T.) Berber carpet is a sustainable option made of recycled plastic bottles. Anytime we can reuse these materials, we reduce the amount of new materials being manufactured and we reduce non-biodegradable materials in our landfills. Polyester Berber is spill resistant and comes in a variety of aesthetically – pleasing colours and patterns.
Whatever your home’s style or design, an eco-friendly flooring option exists to complement the desired look and existing patterns.
Tags: buyers, easy home improvement tips, for sale, home, home sales, home staging, Homes For Sale, house, housing, kitchener, Kitchener Buyers, kitchener for sale, Kitchener Homes, kitchener real estate, kitchener realtor, Kitchener Sellers, kitchener-waterloo, kitchener-waterloo association of realtors, kw, MLS, preparing to sell, real estate, real estate market, realtor, riz jadavji, Riz Sells KW, rizsellskw.com, royal lepage, Royal Lepage Wolle Realty, seller's tips, waterloo, waterloo real estate, waterloo realtor, Waterloo Sellers, www.rizsellskw.com
Posted in Enhance Your Home, For Sale, From The Riz Team, Kitchener Buyers, Kitchener Sellers, Real Estate Listings, Real Estate News, Realtor Tips, Uncategorized, Waterloo Buyers, Waterloo Sellers | Comments Off on Flooring choices on the greener side!
Monday, June 29th, 2015
Canada Day Local Events
Canada Day @ Waterloo Region Museum (DOON)
9:30 a.m. to 5:00 p.m. FREE Admission! Waterloo Region Museum is throwing a party to celebrate Canada Day and everyone is invited! Admission is FREE to the museum and Doon Heritage Village for this fun family event including musical entertainment, fun games like croquet and horseshoes. Guests bring your own picnic lunch or purchase a tasty BBQ lunch.
Columbia Lake Events starting at 4:00 P.M
~ featuring Bobs & LoLo and TVOKids host Gisele
~ featuring live performances by The Strumbellas and Kim Mitchell
~including face painting, water slide, inflatable rides and more
~featuring Waterloo Brewing Co. and a diverse range of local food vendors
~Fireworks finale at 10 p.m.
Kitchener City Hall
Come celebrate Canada Day with us in Downtown Kitchener from 4 p.m. – 11 p.m. This exciting celebration will feature live Canadian entertainment, fireworks from the roof top of Kitchener City Hall, a licensed beer garden, downtown vendors to satisfy your hunger, and much more!

Tags: buyers, home sales, Homes For Sale, kitchener, Kitchener Buyers, Kitchener Homes, kitchener real estate, kitchener realtor, Kitchener Sellers, kitchener-waterloo, kitchener-waterloo association of realtors, kw, Riz Sells KW, rizsellskw.com, royal lepage, Royal Lepage Wolle Realty, Waterloo Buyers, www.rizsellskw.com
Posted in Kitchener Buyers, Kitchener Sellers, Local Events, News From the City, Real Estate News, Uncategorized, Upcoming Events, Waterloo Buyers, Waterloo Sellers | Comments Off on Canada Day July 1st, 2015
Monday, June 22nd, 2015
Helpful hints in making a small room appear bigger!
Small rooms are the bane of the home decorator. How do you achieve a pleasing look that doesn’t feel cramped and claustrophobic? Short of building an addition or knocking down walls, you are limited to a few, but effective, decorating tricks that create the illusion of space.
The strategic use of colour and light is the best way to achieve this. Choose light shades of paint or wallpaper for the walls. Lighter colours reflect light making for a brighter room. Use an even lighter shade of the same colour or white for ceilings and floors. A darker colour on the ceiling will make the ceiling look lower and tends to make the walls look as though they are closing in.
Avoid harshly contrasting colours. In fact, a monochromatic colour scheme that carries throughout the room into fabrics and accessories is very effective. Steer away from too many patterned items. The goal here is to blur perspective.
Anything you can do to bring light into the room will also give the effect of increased space. A corner wall sconce that casts light up onto the wall works well. Try to vary lighting effects for interest. A skylight is a great way to add light to a room, but isn’t always practical or affordable. Mirrors are a great solution for small rooms. Place mirrors directly across from another for maximum impact. A mirror placed across from a window is also effective. Place a lamp in front of a mirror to add more light to your room.
If you have wood or patterned flooring, have it installed so that the lines run diagonally across the room. This makes for longer lines, which give the appearance of a larger space. When furnishing the room, pick objects that are proportioned to the size of the room. For example, opt for a loveseat over a full-sized sofa. Lastly, keep the clutter to a minimum. Avoid using a lot of knick-knacks and keep the room tidy and well organized.
Tags: buyers, easy home improvement tips, for sale, home, home sales, home staging, Homes For Sale, house, housing, Kitchener Buyers, kitchener for sale, kitchener real estate, kitchener realtor, kitchener-waterloo association of realtors, preparing to sell, real estate market, riz jadavji, Riz Sells KW, rizsellskw, rizsellskw.com, royal lepage, Royal Lepage Wolle Realty, sales, sales representative, seller's tips, waterloo, waterloo for sale, Waterloo Homes, waterloo real estate, waterloo realtor, Waterloo Sellers, www.rizsellskw.com
Posted in Enhance Your Home, From The Riz Team, Kitchener Buyers, Kitchener Sellers, Real Estate Listings, Real Estate News, Realtor Tips, Uncategorized, Waterloo Buyers, Waterloo Sellers | Comments Off on Looking to Make a Small Room Appear Bigger??
Wednesday, June 17th, 2015

Remaining objective can be a difficult task when viewing an open house. It is easy to fall in love with a home’s appearance, blind to problems that may make it unsuitable. While aesthetics can be an important consideration, it is necessary to look beyond window-dressing.
Aqualified home inspector should be hired before purchasing a home, but there are areas that consumers can examine on their own. This will shorten your list of potential homes and reduce the likelihood that a home inspector will reject it as unsafe or unsuitable. Here are some considerations and common problem areas to look for when touring an open house:
General Upkeep
Much can be surmised from the general state of the home. Is the home clean? Are lawns left uncut? Are the walls chipped and in need of paint? If smaller chores have been ignored it may be an indication of a broader disregard for home maintenance.
Water Leaks
Check ceilings and drywall for stains, bulges and other signs of water damage. Water that works its way inside via a leaky roof or a cracked foundation can rot wood, create mildew and mold, destroy possessions and can be expensive to repair.
Does it Work?
Test lights, faucets, the heater, air conditioning, major appliances (that are to be included with the home) – even flush the toilets to ensure everything is working as it should.
Floors
As you walk across the floors be aware of spongy (soft or springy) sections. Excessive squeaking and uneven, bumpy floors may also be indicative of expensive forthcoming repairs.
Doors & Windows
Check that doors and windows fit snugly in their jambs and operate smoothly. Look for flaked paint and loose caulking. If the wood around windows and doors is not protected from moisture, it can rot away. Feel for drafts in these areas too.
Poor Drainage
On a wet day walk around the yard and look for areas where water collects. This can be an especially bad sign if there are soggy areas near the home’s foundation.
Grout & Caulking
If the grout and caulking around bathroom and kitchen tiles is loose and crumbly, there is a good chance that water is finding its way into the wall or under the floor.
Structural
Although this is definitely an area where you want the services of a qualified home inspector, you can get an idea about possible structural problems if you see deep cracks in the foundations or loose mortar and bricks.
Miscellaneous Concerns
Naturally, one the most important factors will be determining if the house suits your family’s needs. If you do not want to replace all of your furniture, make sure it will fit into the rooms of the new house. This is difficult to do by eye, so be sure to bring a measuring tape. Also, take note of storage space. If you are moving from a home with large closets and a shed, make sure your new house is able to store an equivalent amount of belongings.
Tags: buyers, easy home improvement tips, for sale, home, home sales, home staging, Homes For Sale, house, housing, kitchener, Kitchener Buyers, kitchener realtor, Kitchener Sellers, kitchener-waterloo, kitchener-waterloo association of realtors, preparing to sell, real estate, real estate market, realtor, riz jadavji, rizsellskw, rizsellskw.com, Royal Lepage Wolle Realty, sales representative, waterloo, Waterloo Buyers, Waterloo Homes, waterloo realtor, Waterloo Sellers, www.rizsellskw.com
Posted in Enhance Your Home, For Sale, From The Riz Team, Kitchener Buyers, Kitchener Sellers, Real Estate Listings, Realtor Tips, Uncategorized, Waterloo Buyers, Waterloo Sellers | Comments Off on Viewing an Open House with Open Eyes


