Kitchener-Waterloo Market Snapshot January 2022
Thursday, February 3rd, 2022NUMBER OF HOME SALES IN JANUARY SET NEW RECORD
If you are considering to Sell your home or Buy a home in the next short while it would be highly beneficial for you to connect with one of our Team Agents at
Do you want to know what your home is worth today? Click Below for our Online No Obligation Market Evaluation

PRICES CONTINUE TO ESCALATE
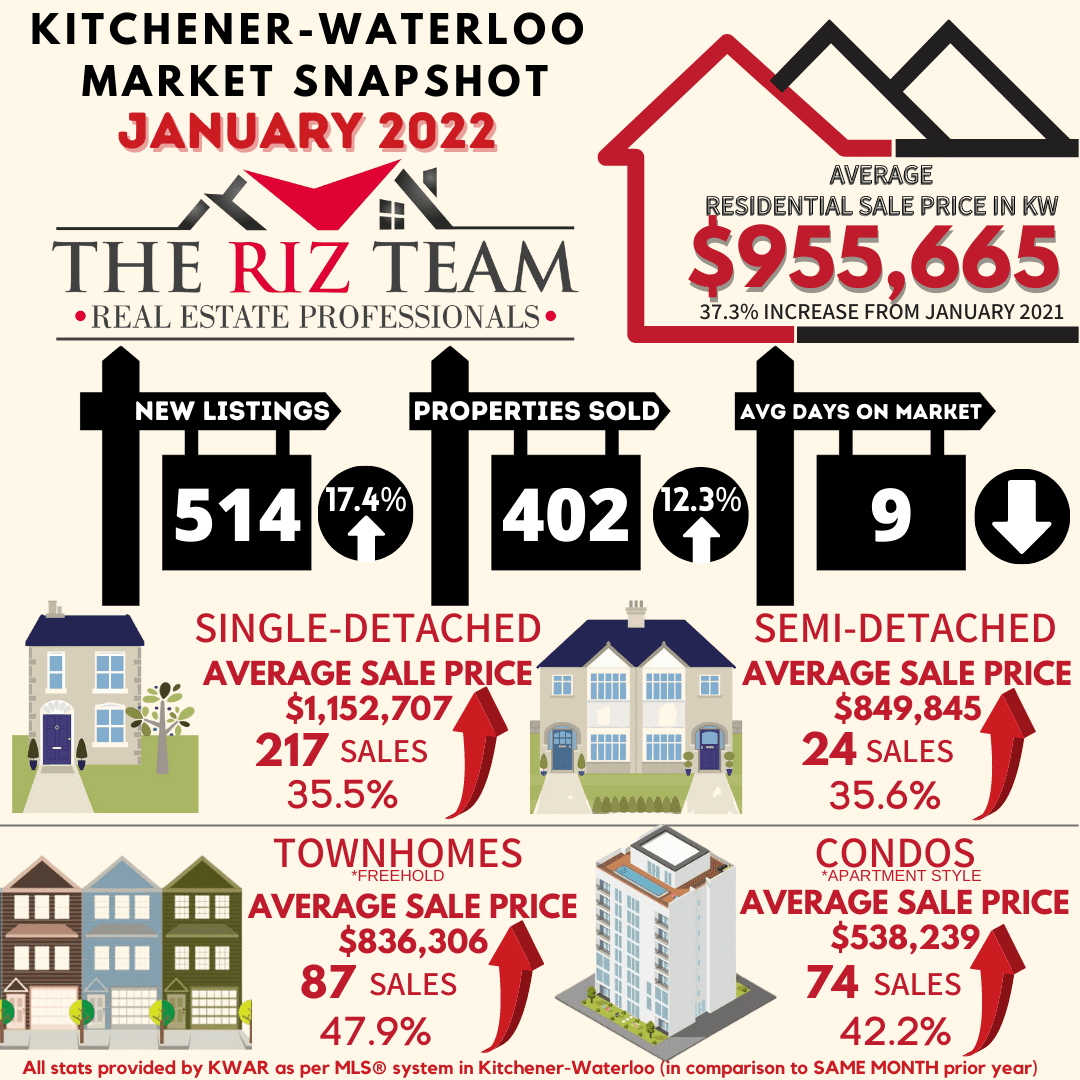
KITCHENER-WATERLOO, ON (Feb 3, 2022) –– The 402 residential homes sold last month through the Multiple Listing Service® (MLS® System) of the Kitchener-Waterloo Association of REALTORS® (KWAR), set a new record high for January. On a year-over-year basis January’s sales were up 12.3 per cent; compared to last month they were up 16.5 per cent. The previous ten-year average number of residential sales for January is 291.
“While it’s a new year, the song remains the same with homebuying demand outstripping supply in January,” said Megan Bell, President of KWAR. “This has resulted in price jumps across all property types.”
Total residential sales in January included 217 detached (up 4.8 per cent from January 2021), and 74 condominium units (up 1.4 per cent). Sales also included 24 semi-detached homes (up 14.3 per cent) and 87 townhouses (up 52.6 per cent).
In January, the average sale price for all residential properties in the Kitchener-Waterloo area was $955,665. This represents a 37.3 per cent increase over January 2021 and a 13.6 per cent increase compared to December 2021.
- The average price of a detached home was $1,152,707. This represents a 35.5 per cent increase from January 2021 and an increase of 12.9 per cent compared to December 2021.
- The average sale price for an apartment-style condominium was $538,239. This represents an increase of 42.2 per cent from January 2021 and an increase of 7.7 per cent compared to December 2021.
- The average sale price for a townhouse was $836,306. This represents a 47.9 per cent increase from January 2021 and an increase of 16.7 per cent compared to December 2021.
- The average sale price for a semi was $849,845. This represents an increase of 35.6 per cent compared to January 2021 and an increase of 10.3 per cent compared to December 2021.

KWAR cautions that average sale price information can be useful in establishing long-term trends but should not be used as an indicator that specific properties have increased or decreased in value. The MLS® Home Price Index (HPI) provides the best way to gauge price trends because averages are strongly distorted by changes in the mix of sales activity from one month to the next.
The MLS® HPI composite benchmark price for all residential properties in Kitchener-Waterloo was $924,900 in January. This represents a 37.1 per cent increase over January 2021 and a 8.6 per cent increase compared to December 2021.
- The benchmark price for a detached home was $1,038,200. This represents a 39.7 per cent increase from January 2021 and 9.8 per cent increase compared to December 2021.
- The benchmark price for an apartment-style condominium was $437,700. This represents a 25.9 per cent increase from January 2021 and a 6.1 per cent increase compared to December 2021.
- The benchmark price for a townhouse is $682,200. This represents a 40.7 per cent increase from January 2021 and a 6.1 per cent increase compared to December 2021.

Bell notes it is anticipated that the Bank of Canada will raise interest rates at their next scheduled announcement in mid-March. “I think we can expect over the course of the next few weeks, buyers who have yet to be priced out of the market will be looking to lock in a mortgage and scoop up any homes that come onto the market.”
There were 514 new listings added to the MLS® System in KW and area last month, an increase of 17.4 per cent compared to January of last year, and a 20.1 per cent decrease compared to the previous ten-year average for January.
The total number of homes available for sale in active status at the end of January was 174, a decrease of 22.0 per cent compared to January of last year, and 80.3 per cent below the previous ten-year average of 883 listings for January.
The number of months of inventory remained extremely low in January at 0.3. Inventory has been at half a month or less since July of 2021. The number of months of inventory represents how long it would take to sell off current inventories at the current rate of sales.
The average number of days to sell in January was 9 days, compared to 16 days in January 2021 and a previous 5-year average of 24 days.
Those requiring specific information on property values should contact a local REALTOR®. Working with a Realtor is the best way to get a complete picture of the property and community you are considering.
View our HPI tool here to learn more: https://kwar.ca/hpi-dashboard
Historical Sales By Property Type

Months Supply of Homes for Sale

Historical Median Sales Price – By Property Type

Historical Average Sales Price – By Property Type


KWAR cautions that average sale price information can be useful in establishing long term trends but should not be used as an indicator that specific properties have increased or decreased in value. The average sale price is calculated based on the total dollar volume of all properties sold. Months Supply is the inventory of homes for sale at the end of a given month, divided by the average monthly closed sales from the last 12 months Those requiring specific information on property values should contact a local REALTOR®. REALTORS® have their fingers on the pulse of the market. They know the questions to ask, the areas to probe and what to look for so that you get a complete picture of the property and community you’re considering.