Kitchener-Waterloo Market Snapshot April 2022
Wednesday, May 4th, 2022MORE LISTINGS, SLOWER HOME SALES IN APRIL
“Last month introduced a small measure of relief to the market,” said Megan Bell, President of KWAR. “While the number of sales remains strong, and sale prices continue to turn out robust annual gains, we’re seeing fewer multiple offers and more conditions on offers making their way back into the market.”
If you are considering to Sell your home or Buy a home in the next short while it would be highly beneficial for you to connect with one of our Team Agents at
The Riz Team
Do you want to know what your home is worth today? Click Below for our Online No Obligation Market Evaluation

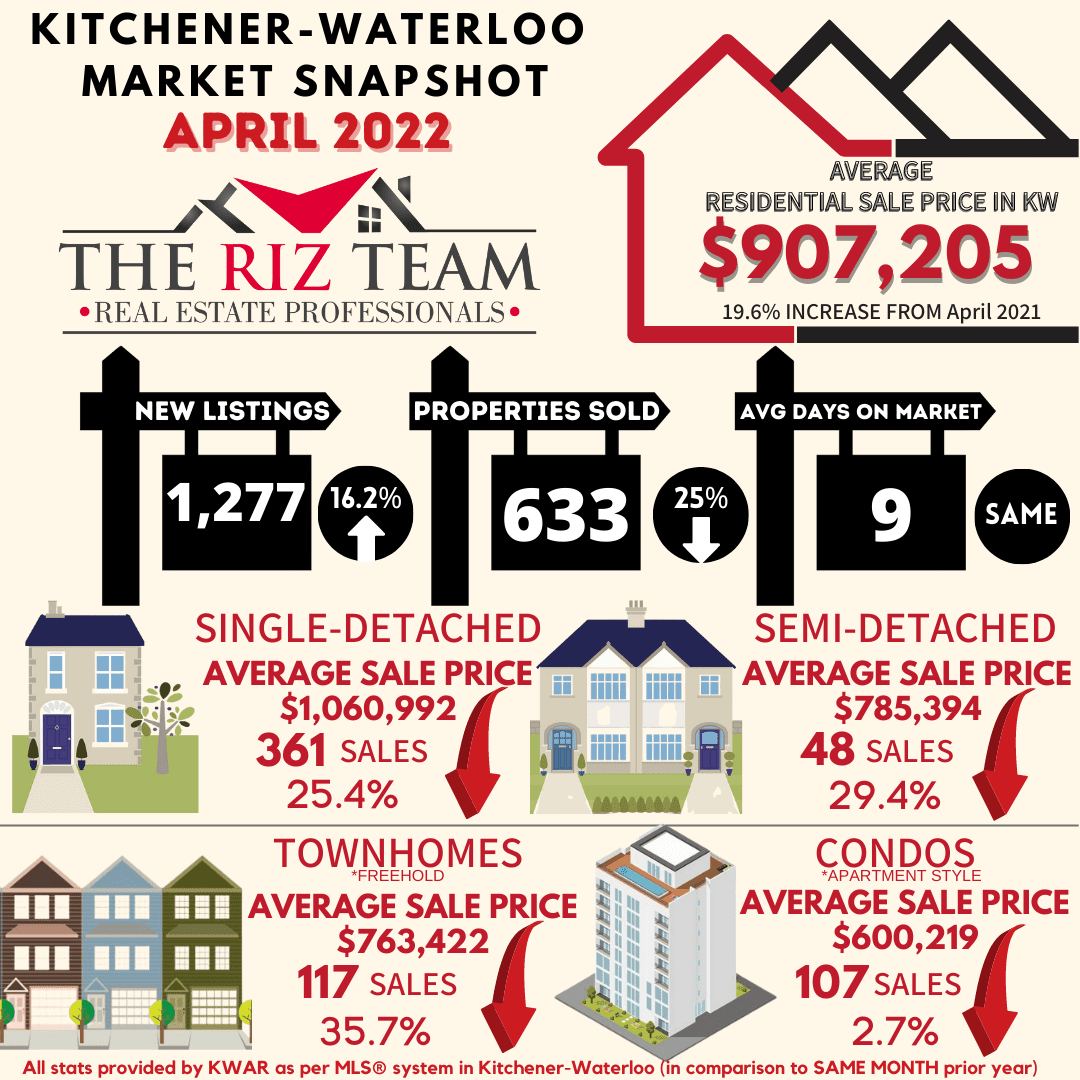
Total residential sales in April included 361 detached (down 25.4 per cent from April 2021), and 107 condominium units (down 2.7 per cent). Sales also included 48 semi-detached homes (down 29.4 per cent) and 117 townhouses (down 35.7 per cent).
In April, the average sale price for all residential properties in the Kitchener-Waterloo area was $907,205. This represents a 19.6 per cent increase over April 2021 and a 5.5 per cent decrease compared to March 2022.
- The average price of a detached home was $1,060,992. This represents a 18.0 per cent increase from April 2021 and a decrease 6.4 per cent compared to March 2022.
- The average sale price for an apartment-style condominium was $600,219. This represents an increase of 35.3 per cent from April 2021 and an increase of 6.0 per cent compared to March 2022.
- The average sale price for a townhouse was $763,422. This represents a 24.5 per cent increase from April 2021 and a decrease of 4.1 per cent compared to March 2022.
- The average sale price for a semi was $785,394. This represents an increase of 20.4 per cent compared to April 2021 and a decrease of 10.5 per cent compared to March 2022.

KWAR cautions that average sale price information can be useful in establishing long-term trends but should not be used as an indicator that specific properties have increased or decreased in value. The MLS® Home Price Index (HPI) provides the best way to gauge price trends because averages are strongly distorted by changes in the mix of sales activity from one month to the next.
The MLS® HPI composite benchmark price for all residential properties in Kitchener-Waterloo was $929,300 in April. This represents a 24.5 per cent increase over April 2021 and a 3.2 per cent decrease compared to March 2022.
- The benchmark price for a detached home was $998,400. This represents a 23.4 per cent increase from April 2021 and 4.6 per cent decrease compared to March 2022.
- The benchmark price for an apartment-style condominium was $493,600. This represents a 29.3 per cent increase from April 2021 and a 2.0 per cent increase compared to March 2022.
- The benchmark price for a townhouse is $755,500. This represents a 30.7 per cent increase from April 2021 and a 1.3 per cent decrease compared to March 2022.

“The trajectory the market was on was simply not sustainable, however, I want to emphasize it would be premature to draw any conclusions on just a single month’s activity. The housing market in Waterloo Region is still very much a sellers’ market, but sellers may need to adjust their expectations,” says Bell. “We noticed this shift after the Bank of Canada’s recent rate increase reinforcing that it has been cheap money empowering too many buyers to chase after too few listings driving the market rather than anything else.”
There were 1,277 new listings added to the MLS® System in KW and area last month, an increase of 16.2 per cent compared to April of last year, and a 40.2 per cent increase compared to the previous ten-year average for April.
The total number of homes available for sale in active status at the end of April was 703, an increase of 48.6 per cent compared to April of last year, and 39.9 per cent below the previous ten-year average of 1,169 listings for April. This is the first time since September 2019 that the total number of homes for sale metric has been over 700.
The number of months of inventory increased to 1.2 months in April from 0.7 months in March. This is the first time since September 2020 that inventory has nudged above the one-month mark. The number of months of inventory represents how long it would take to sell off current inventories at the current rate of sales.
The average number of days to sell in April was 9 days, the same as it was in April 2021. The previous 5-year average is 16 days.
Those requiring specific information on property values should contact a local REALTOR®. Working with a Realtor is the best way to get a complete picture of the property and community you are considering.
View our HPI tool here to learn more: https://kwar.ca/hpi-dashboard
Historical Sales By Property Type

Months Supply of Homes for Sale

Historical Median Sales Price – By Property Type

Historical Average Sales Price – By Property Type


KWAR cautions that average sale price information can be useful in establishing long term trends but should not be used as an indicator that specific properties have increased or decreased in value. The average sale price is calculated based on the total dollar volume of all properties sold. Months Supply is the inventory of homes for sale at the end of a given month, divided by the average monthly closed sales from the last 12 months Those requiring specific information on property values should contact a local REALTOR®. REALTORS® have their fingers on the pulse of the market. They know the questions to ask, the areas to probe and what to look for so that you get a complete picture of the property and community you’re considering.