The Riz Team Blog

Posts Tagged ‘kitchener for sale’

Kitchener Waterloo Market Snapshot January 2024

Friday, February 2nd, 2024

Waterloo Region’s Housing Market Shows Signs of Improvement in January

If you are considering to Sell your home or Buy a home in the next short while it would be highly beneficial for you to connect with one of our Team Agents at

The Riz Team

Do you want to know what your home is worth today? Click Below for our Online No Obligation Market EvaluationClick HereClick Here to get your Home Evaluation

In January, there were 375 homes sold through the Multiple Listing Service® (MLS®) System of the Waterloo Region Association of REALTORS® (WRAR), representing an increase of 25.4 per cent compared to the previous year and a decline of 7.4 per cent compared to the previous 10-year average for the month.

“January is traditionally a slower time of year for home sales, but it’s reassuring to see the increase compared to last year,” says Christal Moura, president of WRAR. “This time last year, we hit an all-time low in January home sales, and while this year has begun with sales below the historical average, the market is showing signs of improvement.”

Total residential sales in January included 206 detached (up 15.7 per cent from January 2023), and 85 townhouses (up 39.3 per cent). Sales also included 56 condominium units (up 30.2 per cent) and 19 semi-detached homes (up 11.8 per cent).

In January, the average sale price for all residential properties in Waterloo Region was $762,174. This represents a 0.1 per cent decrease compared to January 2023 and a 3.2 per cent increase compared to December 2023.

  • The average price of a detached home was $911,262. This represents a 2.9 per cent increase from January 2023 and an increase of 7.5 per cent compared to December 2023.
  • The average sale price for a townhouse was $638,162. This represents a 2.0 per cent increase from January 2023 and an increase of 2.7 per cent compared to December 2023.
  • The average sale price for an apartment-style condominium was $446,146. This represents a decrease of 10.0 per cent from January 2023 and a decrease of 8.7 per cent compared to December 2023.
  • The average sale price for a semi was $631,995. This represents a decrease of 2.9 per cent compared to January 2023 and an increase of 3.1 per cent compared to December 2023.

Average Sale Price – Monthly

2024_January_Average_Sales_Price-By_Property_Type

WRAR cautions that average sale price information can be useful in establishing long-term trends but should not be used as an indicator that specific properties have increased or decreased in value. The MLS® Home Price Index (HPI) provides the best way to gauge price trends because averages are strongly distorted by changes in the mix of sales activity from one month to the next.

MLS® Home Price Index Benchmark Price

  Kitchener-Waterloo Cambridge
Benchmark Type: January 2024 Monthly % Change Yr./Yr. % Change January 2024 Monthly % Change Yr./Yr. % Change
Composite $714,600 1.3 0.1 $747,800 5.8 3.8
Detached $820,700 2.8 2.6 $777,900 7.0 4.3
Townhouse $597,500 -0.7 -0.4 $658,700 0.2 3.7
Apartment $444,000 -5.9 -7.3 $487,100 -2.2 0.2
012024_HPI2

“We are optimistic that this year will have more stability than last,” says Moura. “With the Bank of Canada holding steady at a 5.0% benchmark interest rate, they recognize the overall economy has slowed down. However, housing is a key metric, and we expect the Bank to maintain a balanced response so long as housing continues with moderate growth in 2024 rather than any dramatic increases.”

President Moura points out that navigating shifting markets is a challenge and encourages consumers to work with a local REALTOR to ensure they receive the depth of local market knowledge required to protect their interests.

There was 720 new listings added to the MLS® System in Waterloo Region last month, an increase of 23.5 per cent compared to January last year and a 3.9 per cent decrease compared to the previous ten-year average for January.

The total number of homes available for sale in active status at the end of January was 855 an increase of 33.4 per cent compared to January of last year and 1.2 per cent below the previous ten-year average of 865 listings for January.

At the end of January, there were 1.5 months of inventory, a 50.0 percent increase compared to last year and 15.4 percent above the previous 10-year average. The number of months of inventory represents how long it would take to sell off current inventories at the current sales rate.

“With the exception of condo apartment property types, we saw mostly yearly and monthly price gains across the housing types,” says Moura. “This is because there is more supply in the condo segment (2.8 months) compared to the other property types.”

The average number of days to sell in January was 33, compared to 25 days in January 2023. The previous 5-year average is 20 days.

These statistics provide a snapshot of the real estate market in the Waterloo Region in January, showing both positive and challenging aspects for buyers and sellers. WRAR encourages buyers to reach out to local Realtors for valuable insights about the current state of the local market and to receive tailored advice based on their specific needs.

View our HPI tool here to learn more: https://wrar.ca/hpi/

Click on any of the graphs below for an interactive view.

012024_Average_Sales_Price-By_Municipality
012024_Average_Sales_Price-By_Township
012024_Average_Sales_Price-By_Property_Type
012024_Average_Supply_of_Homes_for_Sale
012024_Monthly_Supply_of_Homes_for_Sale-By_Property_Type
012024_Monthly_Median_Sales_Price-By_Property_Type
012024_Monthly_Average_Sale_Price-By_Property_Type
012024_Average_Days_On_Market

WRAR cautions that average sale price information can help identify long-term trends but should not be to indicate that specific properties have increased or decreased in value. The average sale price is calculated based on the total dollar volume of all properties sold. Months Supply is the inventory of homes for sale at the end of a given month, divided by the average monthly closed sales from the last 12 months. Those requiring specific information on property values should contact a Waterloo Region REALTOR®. REALTORS® have their fingers on the pulse of the market. They know the questions to ask, the areas to probe and what to look for so that you get a complete picture of the property and community you’re considering.


Kitchener Waterloo Market Snapshot July 2023

Thursday, August 3rd, 2023

Strong Listing Activity in July

If you are considering to Sell your home or Buy a home in the next short while it would be highly beneficial for you to connect with one of our Team Agents at

The Riz Team

Do you want to know what your home is worth today? Click Below for our Online No Obligation Market EvaluationClick Here

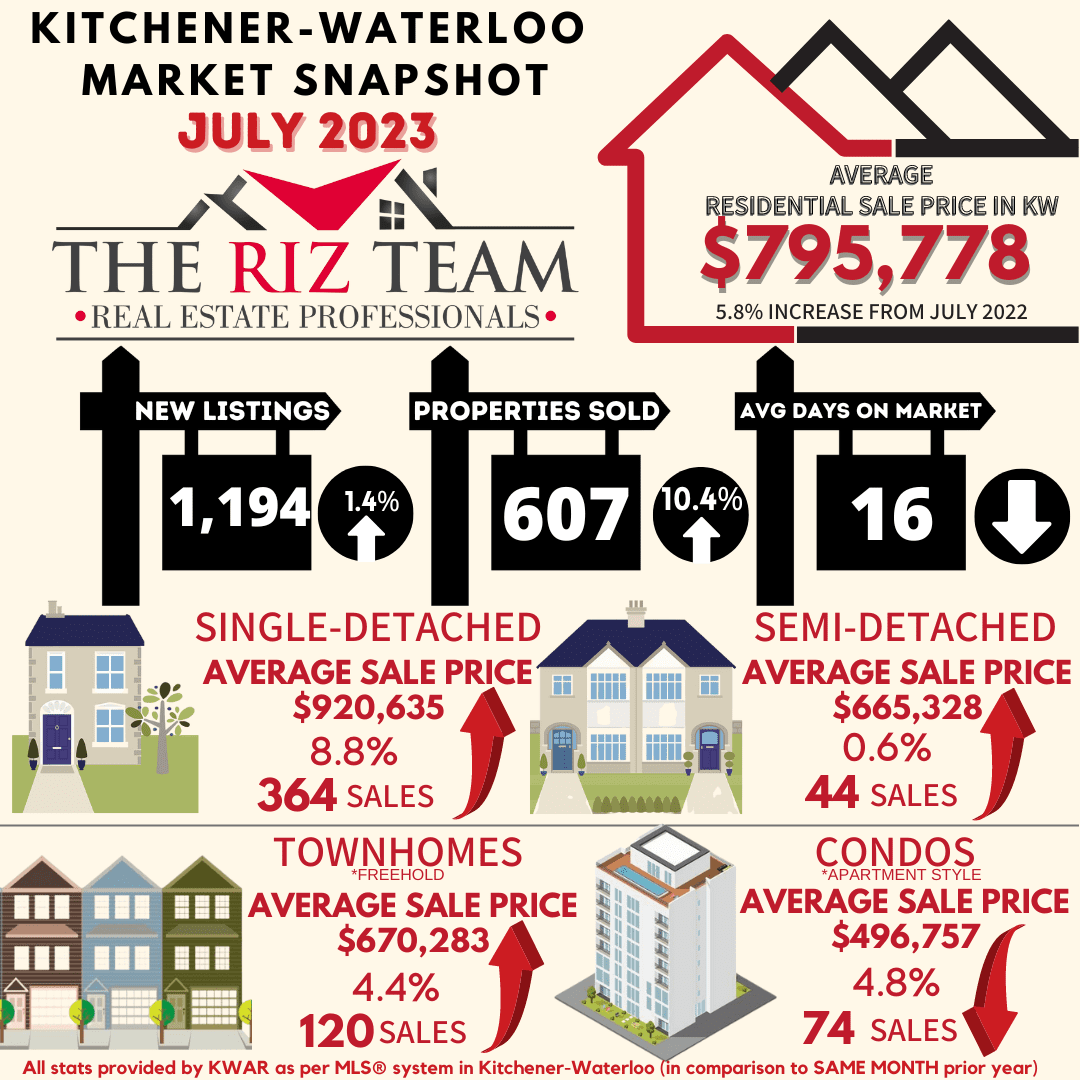
WATERLOO REGION, ON (August 3, 2023) — In July, there were 607 homes sold through the Multiple Listing Service® (MLS®) System of the Waterloo Region Association of REALTORS® (WRAR), representing an increase of 10.4 per cent compared to the previous year and a decline of 21.6 per cent compared to the previous 5-year average for the month.

“The Waterloo Region residential real estate market experienced some growth in terms of unit sales and supply in July, with home prices showing moderate fluctuations,” says Bell. “Despite the Bank of Canada’s most recent interest rate hike, we saw more sellers coming off the sidelines with new listing activity reaching its second highest level for the month of July in over a decade.”

Total residential sales in July included 364 detached (up 8.3 per cent from July 2022), and 120 townhouses (up 7.1 per cent). Sales also included 74 condominium units (up 15.6 per cent) and 44 semi-detached homes (up 22.2 per cent).

In July, the average sale price for all residential properties in Waterloo Region was $795,778. This represents a 5.8 per cent increase compared to July 2022 and a 5.2 per cent decrease compared to June 2023.

  • The average price of a detached home was $920,635. This represents an 8.8 per cent increase from July 2022 and a decrease of 8.4 per cent compared to June 2023.
  • The average sale price for a townhouse was $670,283. This represents a 4.4 per cent increase from July 2022 and an increase of 0.5 per cent compared to June 2023.
  • The average sale price for an apartment-style condominium was $496,757. This represents a decrease of 4.8 per cent from July 2022 and an increase of 5.6 per cent compared to June 2023.
  • The average sale price for a semi was $665,328. This represents an increase of 0.6 per cent compared to July 2022 and a decrease of 3.8 per cent compared to June 2023.

WRAR cautions that average sale price information can be useful in establishing long-term trends but should not be used as an indicator that specific properties have increased or decreased in value. The MLS® Home Price Index (HPI) provides the best way to gauge price trends because averages are strongly distorted by changes in the mix of sales activity from one month to the next.

July Average Sales Price by Property Type

MLS® Home Price Index Benchmark Price

Kitchener-Waterloo Cambridge
Benchmark Type: July 2023 Monthly % Change Yr./Yr. % Change July 2023 Monthly % Change Yr./Yr. % Change
Composite $765,000 -1.7 1.8 $764,600 -1.8 -1.2
Detached $869,000 -2.3 4.4 $797,100 -2.2 1.2
Townhouse $648,700 0.6 -0.3 $663,200 0.5 -11.9
Apartment $484,900 1.2 -5.5 $492,600 2.2 -14.8


July 2023 HPI Image for Stats Release

“In this ever-evolving market, demand persists despite the changing landscape. Increased listing activity is certainly welcomed to help offset the lack of supply and pent-up demand,” says Bell. “Working with a local REALTOR® is vital in navigating these shifting influences during the homebuying and selling process. Waterloo Region properties remain highly sought-after due to our diverse economy and desirable community, solidifying us in a competitive market.”

There were 1,194 new listings added to the MLS® System in Waterloo Region last month, an increase of 1.4 per cent compared to July of last year and a 10.8 per cent increase compared to the previous ten-year average for July.

The total number of homes available for sale in active status at the end of July was 1,107, a decrease of 14.8 per cent compared to July of last year and 22.6 per cent below the previous ten-year average of 1431 listings for July.

There were 2.0 months of inventory at the end of July, up slightly from the end of June and in line with the previous 10-year average. The number of months of inventory represents how long it would take to sell off current inventories at the current sales rate.

The average number of days to sell in July was 16, compared to 18 days in July 2022. The previous 5-year average is 18 days.

View our HPI tool here to learn more: https://wrar.ca/hpi/

Click on any of the graphs below for an interactive view.

average sales price by municipality
average sales price by township
monthly sales by property type
monthly supply of homes for sale
monthly median sales price by property type
monthly average sales price by property type
monthly average days on market

WRAR cautions that average sale price information can help identify long-term trends but should not be to indicate that specific properties have increased or decreased in value. The average sale price is calculated based on the total dollar volume of all properties sold. Months Supply is the inventory of homes for sale at the end of a given month, divided by the average monthly closed sales from the last 12 months. Those requiring specific information on property values should contact a Waterloo Region REALTOR®. REALTORS® have their fingers on the pulse of the market. They know the questions to ask, the areas to probe and what to look for so that you get a complete picture of the property and community you’re considering.


Kitchener Waterloo Market Snapshot January 2023

Friday, February 3rd, 2023

Number of Home Sales in January Exceptionally Low

If you are considering to Sell your home or Buy a home in the next short while it would be highly beneficial for you to connect with one of our Team Agents at

The Riz Team

Do you want to know what your home is worth today? Click Below for our Online No Obligation Market EvaluationClick Here

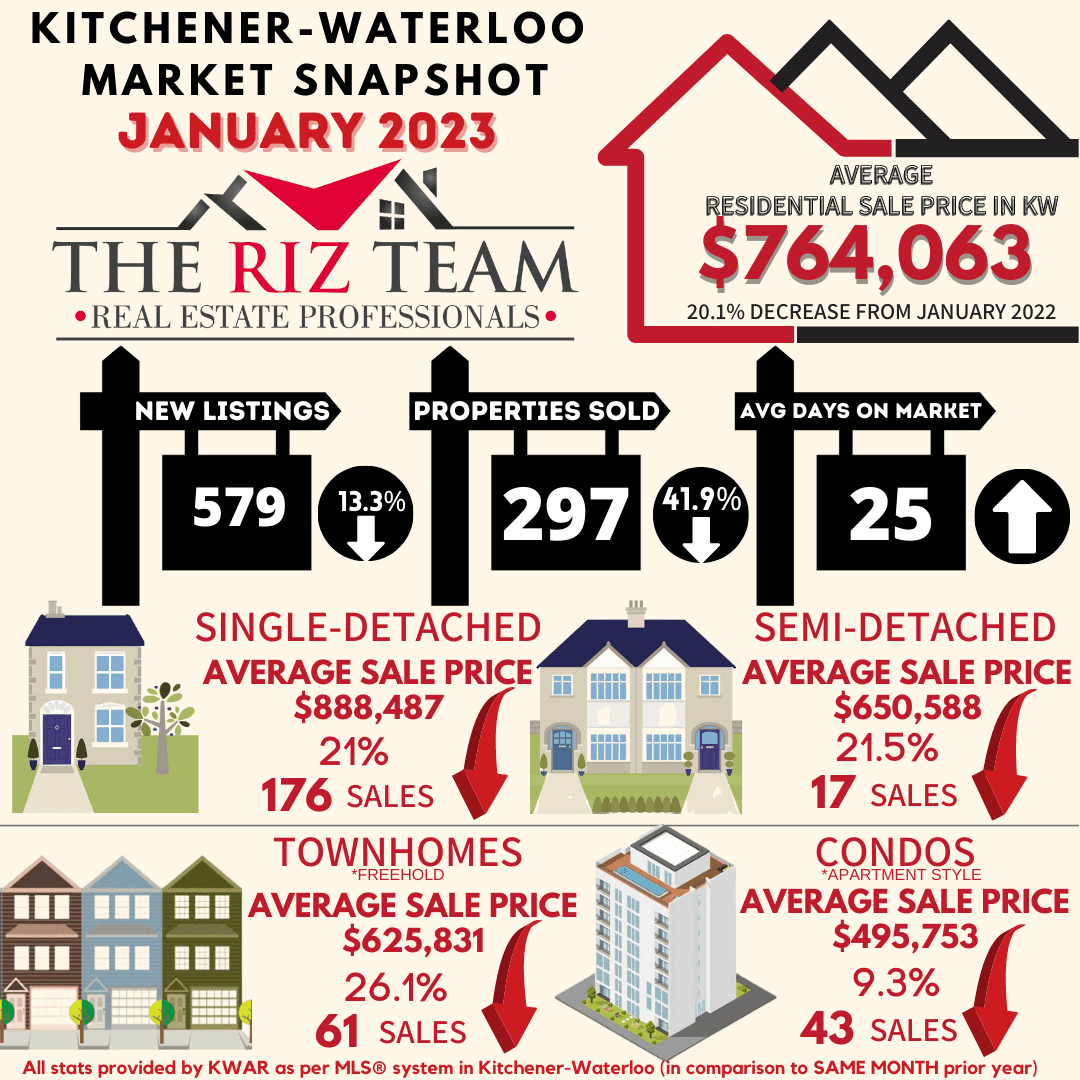
WATERLOO REGION, ON (February 3, 2023) —The number of homes sold last month through the Multiple Listing Service® (MLS®) System of the Waterloo Region Association of REALTORS® (WRAR) totalled 297 units, a decrease of 41.9 per cent compared to January 2022 and 31.0 per cent below the previous 5-year average for the month.

“Waterloo Region’s home sales in January were at their second lowest of any single month in well over a decade,” says Megan Bell, president of WRAR. “Home sales tend to be sluggish in January, and while we expected activity to ease to reflect economic challenges, this was a larger drop than originally anticipated.”

Total residential sales in January included 176 detached (down 38.5 per cent from January 2022), and 61 townhouses (down 44.5 per cent). Sales also included 43 condominium units (down 48.2 per cent) and 17 semi-detached homes (down 46.9 per cent).

In January, the average sale price for all residential properties in Waterloo Region was $764,063. This represents a 20.1 per cent decrease compared to January 2022 and a 5.9 per cent increase compared to December 2022.

  • The average price of a detached home was $888,487. This represents a 21.5 per cent decrease from January 2022 and an increase of 7.6 per cent compared to December 2022.
  • The average sale price for a townhouse was $625,831. This represents a 26.1 per cent decrease from January 2022 and an increase of 2.2 per cent compared to December 2022.
  • The average sale price for an apartment-style condominium was $495,753. This represents a decrease of 9.3 per cent from January 2022 and an increase of 6.1 per cent compared to December 2022.
  • The average sale price for a semi was $650,588. This represents a decrease of 21.5 per cent compared to January 2022 and an increase of 5.5 per cent compared to December 2022.
january average sales price by property type

WRAR cautions that average sale price information can be useful in establishing long-term trends but should not be used as an indicator that specific properties have increased or decreased in value. The MLS® Home Price Index (HPI) provides the best way to gauge price trends because averages are strongly distorted by changes in the mix of sales activity from one month to the next.

MLS® Home Price Index Benchmark Price

Kitchener-Waterloo Cambridge
Benchmark Type: January 2023 Monthly % Change Yr./Yr. % Change January 2023 Monthly % Change Yr./Yr. % Change
Composite $705,100 -1.2 -23.7

$731,000

2.4 -21.3
Detached $789,900 -1.4 -25.9 $757,200 2.9 -23.2
Townhouse $583,100 -1.8 -17.6 $638,300 -0.2 -8.0
Apartment $481,300 2.0 -5.1 $487,600 -1.9 -4.3

“On a monthly basis, we saw the average sale price increase across all property types in January,” says Bell. “I’m also noticing more multiple offers happening, especially on detached homes that are priced under eight hundred thousand dollars.”

Meanwhile, the Bank of Canada again increased interest rates at the end of January by 25 basis points to 4.5 per cent. “While not a huge increase, the continuance of interest rate hikes is an ongoing factor in the reduction of home sales within the market,” says Bell.

There were 579 new listings added to the MLS® System in Waterloo Region last month, a decrease of 13.3 per cent compared to January of last year and a 28.7 per cent decrease compared to the previous ten-year average for January.

The total number of homes available for sale in active status at the end of January was 651, an increase of 167.9 per cent compared to January of last year and 34.7 per cent below the previous ten-year average of 998 listings for January.

The number of months of inventory is up 233.3 per cent compared to January of last year, but still historically low at one month. Between 2011 and 2015, January’s average months of inventory was 3.0 months. The number of months of inventory represents how long it would take to sell off current inventories at the current sales rate.

The average number of days to sell in January was 25, compared to 9 days in January 2022. The previous 5-year average is 21 days.

WRAR’s president says, “The demographic of buyers is also shifting as we observe fewer buyers coming from the GTA into the region.  While there are still some, it is nowhere like it was last January. These and other shifting influences mean it has never been more important for buyers and sellers to work with a local REALTOR® to help provide expertise during the homebuying and selling process.”

Affordability, combined with ongoing supply constraints, makes it difficult for buyers to navigate the continuous market changes while sellers also need to adjust to the evolving circumstances. Those requiring specific information on property values should contact a local REALTOR®. Working with a Realtor is the best way to get a complete picture of the property and community you are considering.

View our HPI tool here to learn more: https://wrar.ca/hpi/

Click on any of the graphs below for an interactive view.

jan average sales prce
jan average sales townships
sales by property type
monthly supply of homes for sale
median sales price property type
average sales price by property type
average days on market

WRAR cautions that average sale price information can help identify long-term trends but should not be to indicate that specific properties have increased or decreased in value. The average sale price is calculated based on the total dollar volume of all properties sold. Months Supply is the inventory of homes for sale at the end of a given month, divided by the average monthly closed sales from the last 12 months. Those requiring specific information on property values should contact a Waterloo Region REALTOR®. REALTORS® have their fingers on the pulse of the market. They know the questions to ask, the areas to probe and what to look for so that you get a complete picture of the property and community you’re considering.


Kitchener Waterloo Market Snapshot November 2022

Friday, December 2nd, 2022

Waterloo Region Home Prices Continue to Cool in November

“Home sales continued to decrease in November, as they traditionally do at this time of year,” “At the same time, we know ever-increasing homeownership costs are contributing to the decline and putting downward pressure on sales prices which have plateaued since July.”

If you are considering to Sell your home or Buy a home in the next short while it would be highly beneficial for you to connect with one of our Team Agents at

The Riz Team

Do you want to know what your home is worth today? Click Below for our Online No Obligation Market EvaluationClick Here

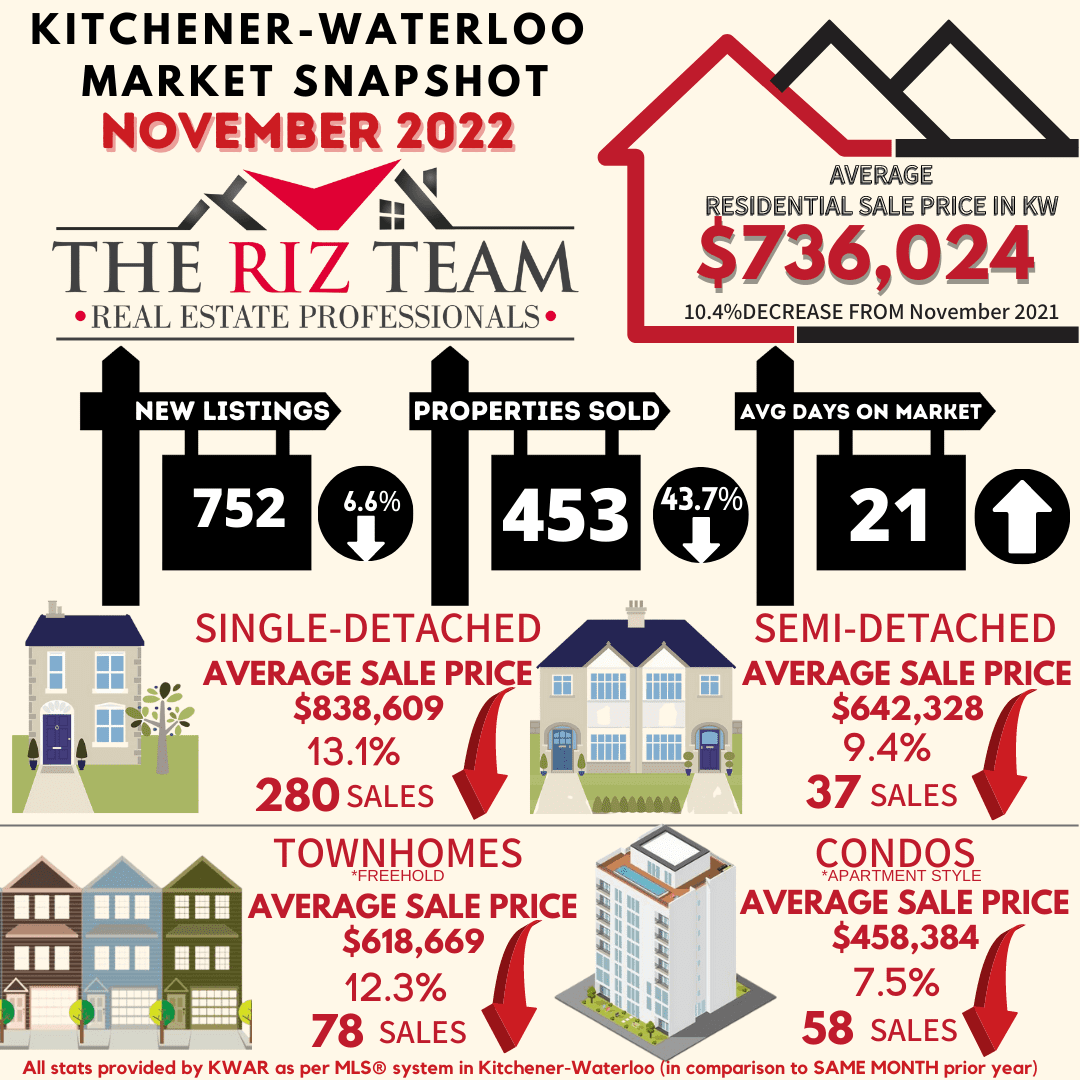
WATERLOO REGION, ON (December 2, 2022) —The number of homes sold through the Multiple Listing Service® (MLS®) System of the Waterloo Region Association of REALTORS® (WRAR) totaled 453 units, a decrease of 43.7 per cent compared to November 2021 and 34.2 per cent below the previous 5-year average for the month.

Total residential sales in November included 280 detached (down 38.3 per cent from November 2021), and 78 townhouses (down 57.1 per cent). Sales also included 58 condominium units (down 49.6 per cent) and 37 semi-detached homes (down 28.8 per cent).

“Home sales continued to decrease in November, as they traditionally do at this time of year,” says Megan Bell, President of WRAR. “At the same time, we know ever-increasing homeownership costs are contributing to the decline and putting downward pressure on sales prices which have plateaued since July.”

In November, the average sale price for all residential properties in Waterloo Region was $736,024. This represents a 10.4 per cent decrease compared to November 2021 and a 3.6 per cent decrease compared to October 2022.

  • The average price of a detached home was $838,609. This represents a 13.1 per cent decrease from November 2021 and a decrease of 3.5 per cent compared to October 2022.
  • The average sale price for a townhouse was $618,669. This represents a 12.3 per cent decrease from November 2021 and a decrease of 2.6 per cent compared to October 2022.
  • The average sale price for an apartment-style condominium was $458,384. This represents a decrease of 7.5 per cent from November 2021 and a decrease of 6.2 per cent compared to October 2022.
  • The average sale price for a semi was $642,328. This represents a decrease of 9.4 per cent compared to November 2021 and an increase of 3.2 per cent compared to October 2022.

WRAR cautions that average sale price information can be useful in establishing long-term trends but should not be used as an indicator that specific properties have increased or decreased in value. The MLS® Home Price Index (HPI) provides the best way to gauge price trends because averages are strongly distorted by changes in the mix of sales activity from one month to the next.

Capture
MLS® Home Price Index Benchmark Price
  Kitchener-Waterloo Cambridge
Benchmark Type: November 2022 Monthly % Change Yr./Yr. % Change November 2022

Monthly % Change

Yr./Yr. % Change
Composite $711,200 -1.7 -12.8 $744,200 1.8 -10.6
Detached $791,000 -2.1 -14.8 $770,600 2.5 -12.0
Townhouse $602,200 -0.2 -7.0 $652,000 -1.7 -2.0
Apartment $492,600 -0.4 8.0 $504,100 -3.1 3.7


November 2022 HPI Image for Stats Release

“The Waterloo Region market has been moving towards more of a balanced market throughout the latter part of the year, and November followed that trend,” says Bell. “We have a long way to go before the pendulum swings into it being a buyer’s market. However, if the Bank of Canada yet again raises its key interest rate on December 7, it is likely to result in fewer buyers competing for more inventory.”

There were 752 new listings added to the MLS® System in the Waterloo Region last month, a decrease of 6.6 per cent compared to November of last year and a 1.3 per cent increase compared to the previous ten-year average for November.

The total number of homes available for sale in active status at the end of November was 860, an increase of 209.4 per cent compared to November of last year and 29.9 per cent below the previous ten-year average of 1227 listings for November.

The number of months of inventory is up 333.3 per cent compared to November of last year, but still historically low at 1.3 months. Between 2009 and 2015, November’s average months of inventory was 3.2 months. The number of months of inventory represents how long it would take to sell off current inventories at the current sales rate.

The average number of days to sell in November was 21, compared to 10 days in November 2021. The previous 5-year average is 21 days.

WRAR’s president says, “It has never been more important for both buyers and sellers to work with a REALTOR® to help provide expertise during the homebuying and selling process. Affordability, combined with ongoing supply constraints, are making it difficult for buyers to navigate the continuous market changes while sellers are also having to adjust in concurrence with the evolving circumstances”.

Those requiring specific information on property values should contact a local REALTOR®. Working with a Realtor is the best way to get a complete picture of the property and community you are considering.

View our HPI tool here to learn more: https://wrar.ca/hpi/

Click on any of the graphs below for an interactive view.

Capture 2
Capture 3
Capture 9
Capture 5
Capture 10
Capture 7
Capture 8

WRAR cautions that average sale price information can help identify long-term trends but should not be to indicate that specific properties have increased or decreased in value. The average sale price is calculated based on the total dollar volume of all properties sold. Months Supply is the inventory of homes for sale at the end of a given month, divided by the average monthly closed sales from the last 12 months. Those requiring specific information on property values should contact a Waterloo Region REALTOR®. REALTORS® have their fingers on the pulse of the market. They know the questions to ask, the areas to probe and what to look for so that you get a complete picture of the property and community you’re considering.

Kitchener-Waterloo Market Snapshot March 2022

Monday, April 4th, 2022

KITCHENER-WATERLOO HOME SALES UP IN MARCH, AVERAGE PRICE DIPS FROM FEBRUARY

“The skyrocketing prices of the last two months took a bit of a breather in March, with the overall average price dipping five per cent compared to what we saw in February,” said Megan Bell, President of KWAR. “While it is too soon to draw conclusions from just one month of home sales, I know many will be comforted to see a leveling off on the average price, no matter how incremental.”

If you are considering to Sell your home or Buy a home in the next short while it would be highly beneficial for you to connect with one of our Team Agents at

The Riz Team

Do you want to know what your home is worth today? Click Below for our Online No Obligation Market Evaluation
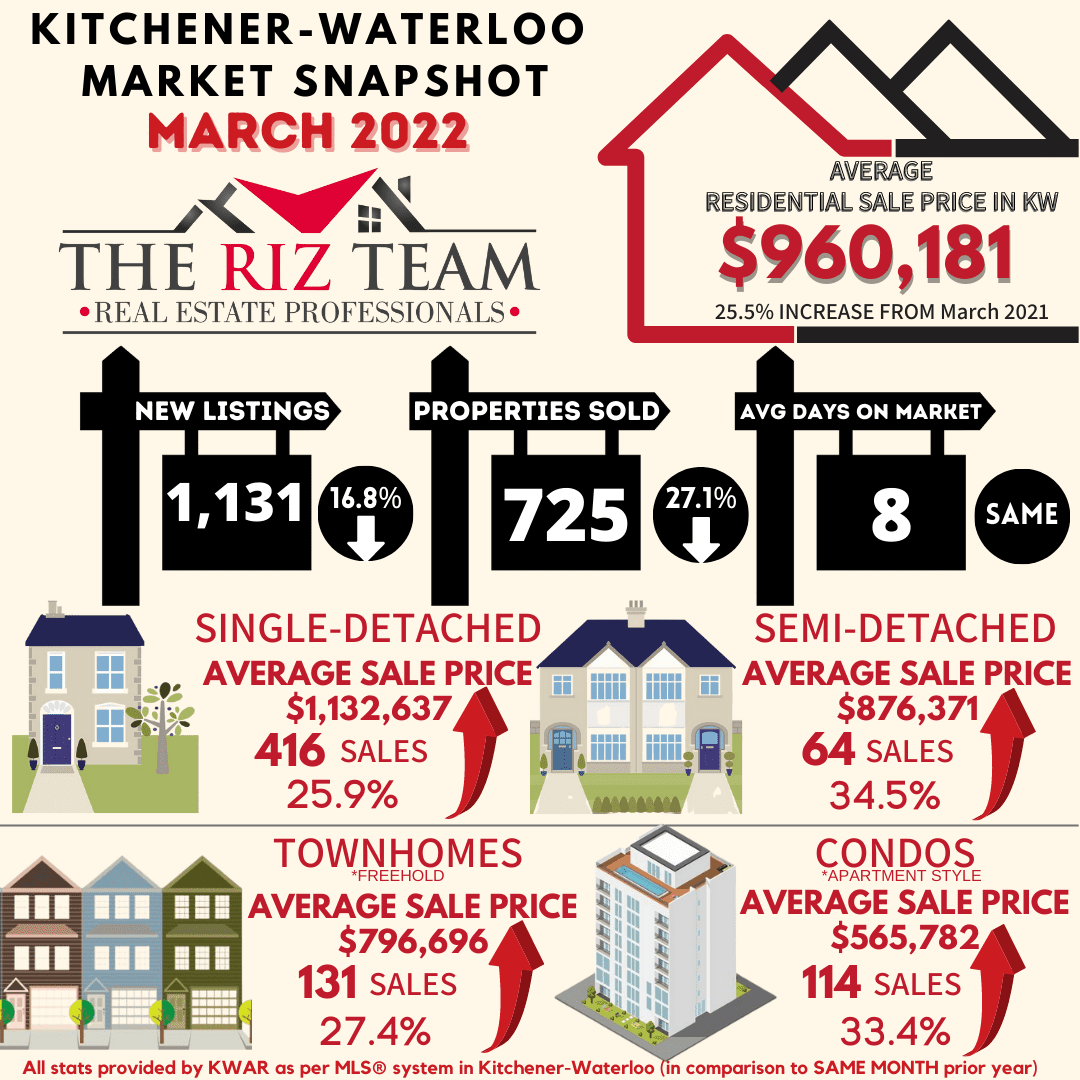
 

Total residential sales in March included 416 detached (down 29.7 per cent from March 2021), and 114 condominium units (down 9.5 per cent). Sales also included 64 semi-detached homes (down 17.9 per cent) and 131 townhouses (down 33.8 per cent).

In March, the average sale price for all residential properties in the Kitchener-Waterloo area was $960,181. This represents a 25.5 per cent increase over March 2021 and a 4.6 per cent decrease compared to February 2022.

  • The average price of a detached home was $1,132,637. This represents a 25.9 per cent increase from March 2021 and a decrease 6.4 per cent compared to February 2022.
  • The average sale price for an apartment-style condominium was $565,782. This represents an increase of 33.4 per cent from March 2021 and a decrease of 1.2 per cent compared to February 2022.
  • The average sale price for a townhouse was $796,696. This represents a 27.4 per cent increase from March 2021 and a decrease of 7.6 per cent compared to February 2022.
  • The average sale price for a semi was $876,371. This represents an increase of 34.5 per cent compared to March 2021 and a decrease of 5.0 per cent compared to February 2022.

KWAR cautions that average sale price information can be useful in establishing long-term trends but should not be used as an indicator that specific properties have increased or decreased in value. The MLS®® Home Price Index (HPI) provides the best way to gauge price trends because averages are strongly distorted by changes in the mix of sales activity from one month to the next.

The MLS® HPI composite benchmark price for all residential properties in Kitchener-Waterloo was $960,100 in March. This represents a 29.6 per cent increase over March 2021 and a 1.5 per cent decrease compared to February 2022.

  • The benchmark price for a detached home was $1,046,200. This represents a 28.1 per cent increase from March 2021 and 4.0 per cent decrease compared to February 2022.
  • The benchmark price for an apartment-style condominium was $484,000. This represents a 32.9 per cent increase from March 2021 and a 4.2 per cent increase compared to February 2022.
  • The benchmark price for a townhouse is $765,500. This represents a 41.3 per cent increase from March 2021 and a 4.9 per cent increase compared to February 2022.

“Even though the average price decreased across all property types on a month-to-month basis, the MLS® HPI showed continued monthly gains for both townhouse and apartment property types,” notes Bell.  “As the province feels its way out of the pandemic, we are beginning to see some very preliminary signs of a potential cooling. We are not seeing quite as many multiple offers and some offers are coming in with conditions. Of course, when we say cooling, we’re talking about a market that has been scorching hot which is why we are pleased to see this happening.”

There were 1,131 new listings added to the MLS® System in KW and area last month, a decrease 16.8 per cent compared to the record topping number of listings added in March of last year, and a 28.0 per cent increase compared to the previous ten-year average for March.

The total number of homes available for sale in active status at the end of March was 441, an increase of 1.1 per cent compared to March of last year, and 59.0 per cent below the previous ten-year average of 1,072 listings for March.

The number of months of inventory nudged up to 0.7 months in March from 0.5 months in February. Inventory has been under the one-month mark since October 2020. The number of months of inventory represents how long it would take to sell off current inventories at the current rate of sales.

The average number of days to sell in March was 8 days, the same as it was in March 2021. The previous 5-year average is 16 days.

The More Homes for Everyone Act

Statement from KWAR President Megan Bell

Last week the Government of Ontario introduced a new bill, the More Homes for Everyone Act to address the province’s housing affordability crisis.

While we welcome several aspects of the proposed More Homes for Everyone bill, such as measures to support more timely municipal decision making and developing policies and tools to support multi-generational homes in existing neighbourhoods—bolder actions to increase supply were notably missing.

Ontario’s Housing Affordability Task Force had recommended limiting exclusionary zoning and allowing “as of right” residential housing up to four units and up to four storeys on a single residential lot. Instead, the government has committed to the Task Force’s recommendations as part of a “long term roadmap”.

KWAR is optimistic Waterloo Region will be bold about housing in their official plan update

Ending exclusionary zoning to allow for gentle density in our neighbourhoods is critical to filling the lack of “missing middle” supply for family-sized households.

While Minister Clark states that some municipalities (such as Toronto and Mississauga) were not ready, KWAR is optimistic that the Region of Waterloo (ROW) will take a more progressive view toward increasing density.  On the development side, the Waterloo region has been exceeding density targets set by the province. At KWAR’s recently held Where Do We Grow From Here Symposium we learned from the ROW’s Commissioner, Rod Regier the Region is proposing policies for the ROW official plan that would see a tiered approach to missing middle housing by allowing 4 units and up to 4 storeys, as-of-right, on all land currently zoned residential and on any new greenfield land (residential); and allow a range of 8 to 12 storeys, along specific corridors, such as the ION corridor.

KWAR encourages the Region of Waterloo to stay the course on its bold proposals for its Regional Official Plan and create ways to bring a broad range of housing options to our community.

Those requiring specific information on property values should contact a local REALTOR®.  Working with a Realtor is the best way to get a complete picture of the property and community you are considering.

View our HPI tool here to learn more: https://kwar.ca/hpi-dashboard

Historical Sales By Property Type

Months Supply of Homes for Sale

Historical Median Sales Price – By Property Type

Historical Average Sales Price – By Property Type

Average Days on Market Chart

KWAR cautions that average sale price information can be useful in establishing long term trends but should not be used as an indicator that specific properties have increased or decreased in value. The average sale price is calculated based on the total dollar volume of all properties sold. Months Supply is the inventory of homes for sale at the end of a given month, divided by the average monthly closed sales from the last 12 months Those requiring specific information on property values should contact a local REALTOR®. REALTORS® have their fingers on the pulse of the market. They know the questions to ask, the areas to probe and what to look for so that you get a complete picture of the property and community you’re considering.

Kitchener-Waterloo Market Snapshot October 2021

Wednesday, November 3rd, 2021

PRICES CONTINUE TO INCREASE WITH STRONG HOME SALES IN OCTOBER

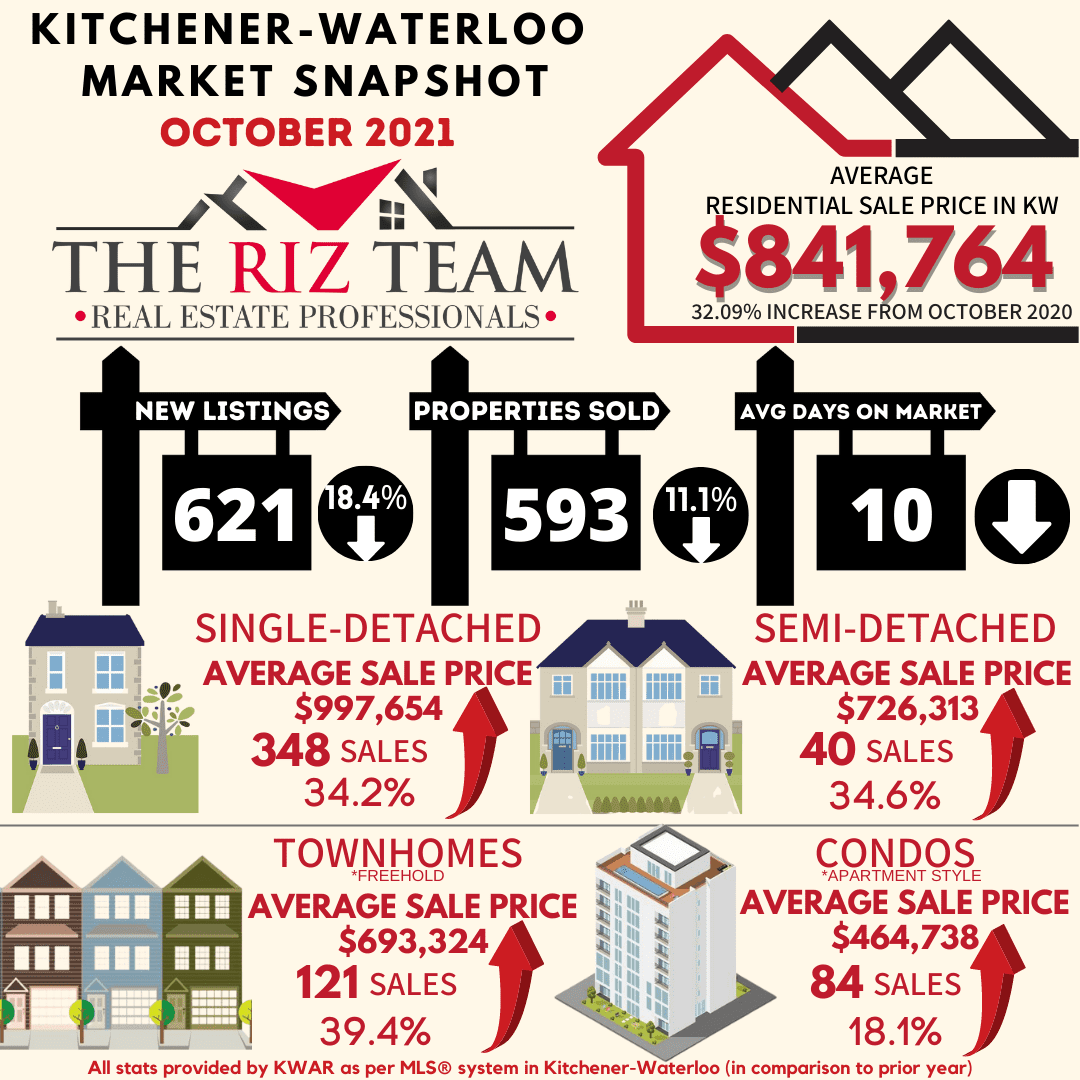
KITCHENER-WATERLOO, ON (November 3, 2021) –– A total of 593 residential homes sold last month through the Multiple Listing Service® (MLS® System) of the Kitchener-Waterloo Association of REALTORS® (KWAR), a decrease of 11.1 per cent compared to last October and a decrease of 16.5 per cent compared to September.

“While not as red-hot as last year’s record-breaking October, it was still a higher-than-normal number of home sales for the month, and the second-highest October on record,” says KWAR’s president, Nicole Pohl. “The number of listings coming on the market can scarcely keep up with the demand for homes in Waterloo region, and the continued price growth we see in October reflects this.”

Total residential sales in October included 348 detached (down 13.2 per cent from October 2020), and 84 condominium units (down 8.7 per cent). Sales also included 40 semi-detached homes (down 9.1) and 121 townhouses (down 6.9 per cent).

In October, the average sale price for all residential properties in the Kitchener-Waterloo area was $841,764. This represents a 32.9 per cent increase over October 2020 and a 6.1 per cent increase compared to September 2021.

  • The average price of a detached home was $997,654. This represents a 34.2 per cent increase from October 2020 and an increase of 3.5 per cent compared to September 2021.
  • The average sale price for an apartment-style condominium was $464,738. This represents an increase of 18.1 per cent from October 2020 and a decrease of 7.1 per cent compared to September 2021.
  • The average sale price for a townhouse was $693,324. This represents a 39.4 per cent increase from October 2020 and an increase of 7.3 per cent compared to September 2021.
  • The average sale price for a semi was $726,313. This represents an increase of 34.6 per cent compared to October 2020 and an increase of 5.6 per cent compared to September 2021.

KWAR cautions that average sale price information can be useful in establishing long-term trends but should not be used as an indicator that specific properties have increased or decreased in value. The MLS® Home Price Index (HPI) provides the best way to gauge price trends because averages are strongly distorted by changes in the mix of sales activity from one month to the next.

The MLS® HPI composite benchmark price for all residential properties in Kitchener-Waterloo was $803,900 in October. This represents a 34.3 per cent increase over October 2020 and a 2.5 per cent increase compared to September 2021.

  • The benchmark price for a detached home was $887,500. This represents a 35.5 per cent increase from October 2020 and 2.1 per cent increase compared to September 2021.
  • The benchmark price for an apartment-style condominium was $406,400. This represents a 22.7 per cent increase from October 2020 and a 3.5 per cent increase compared to September 2021.
  •  The benchmark price for a townhouse is $603,900. This represents a 42.5 per cent increase from October 2020 and a 3.8 per cent increase compared to September 2021.

“With ongoing constraints on supply versus demand, home prices continued to accelerate in October,” says Pohl.

There were 621 new listings added to the MLS® System in KW and area last month, a decrease of 18.4 per cent compared to October of last year, and a 12.1 per cent decrease compared to the previous ten-year average for October.

The total number of homes available for sale in active status at the end of October was 288, a decrease of 36 per cent compared to October of last year, and 76.5 per cent below the previous ten-year average of 1,285 listings for October.

The number of months of inventory remained at 0.5 in October. Inventory has settled at under 1 month for twelve consecutive months. The number of months of inventory represents how long it would take to sell off current inventories at the current rate of sales.

The average number of days to sell in October was 10 days, compared to 13 days in October 2020 and a previous 5-year average of 22 days.

“Affordability throughout Waterloo Region continues to be challenged, creating significant barriers especially for many people who are just trying to get their foot in the door of the housing market,” says Pohl. “We are urging all levels of government to work together to tackle the supply issue facing housing markets across the country and right here in Waterloo region.”

Over the past two weeks representatives of KWAR, alongside REALTORS® from across Canada have been meeting with Members of Parliament to talk about Canada’s economic recovery plan and the need to prioritize housing. You can read about the ideas that REALTORS® are proposing here:  https://www.crea.ca/mp

Those requiring specific information on property values should contact a local REALTOR®.  Working with a Realtor is the best way to get a complete picture of the property and community you are considering.

View our HPI tool here to learn more: https://kwar.ca/hpi-dashboard

Historical Sales By Property Type

Months Supply of Homes for Sale

Historical Median Sales Price – By Property Type

Historical Average Sales Price – By Property Type

Average Days on Market Chart

KWAR cautions that average sale price information can be useful in establishing long term trends but should not be used as an indicator that specific properties have increased or decreased in value. The average sale price is calculated based on the total dollar volume of all properties sold. Months Supply is the inventory of homes for sale at the end of a given month, divided by the average monthly closed sales from the last 12 months Those requiring specific information on property values should contact a local REALTOR®. REALTORS® have their fingers on the pulse of the market. They know the questions to ask, the areas to probe and what to look for so that you get a complete picture of the property and community you’re considering.

Kitchener-Waterloo Market Snapshot September 2021

Monday, October 4th, 2021

HOME PRICES CONTINUE TO CLIMB IN SEPTEMBER

LISTINGS CONTINUE TO BE OUTSTRIPPED BY BUYING DEMAND

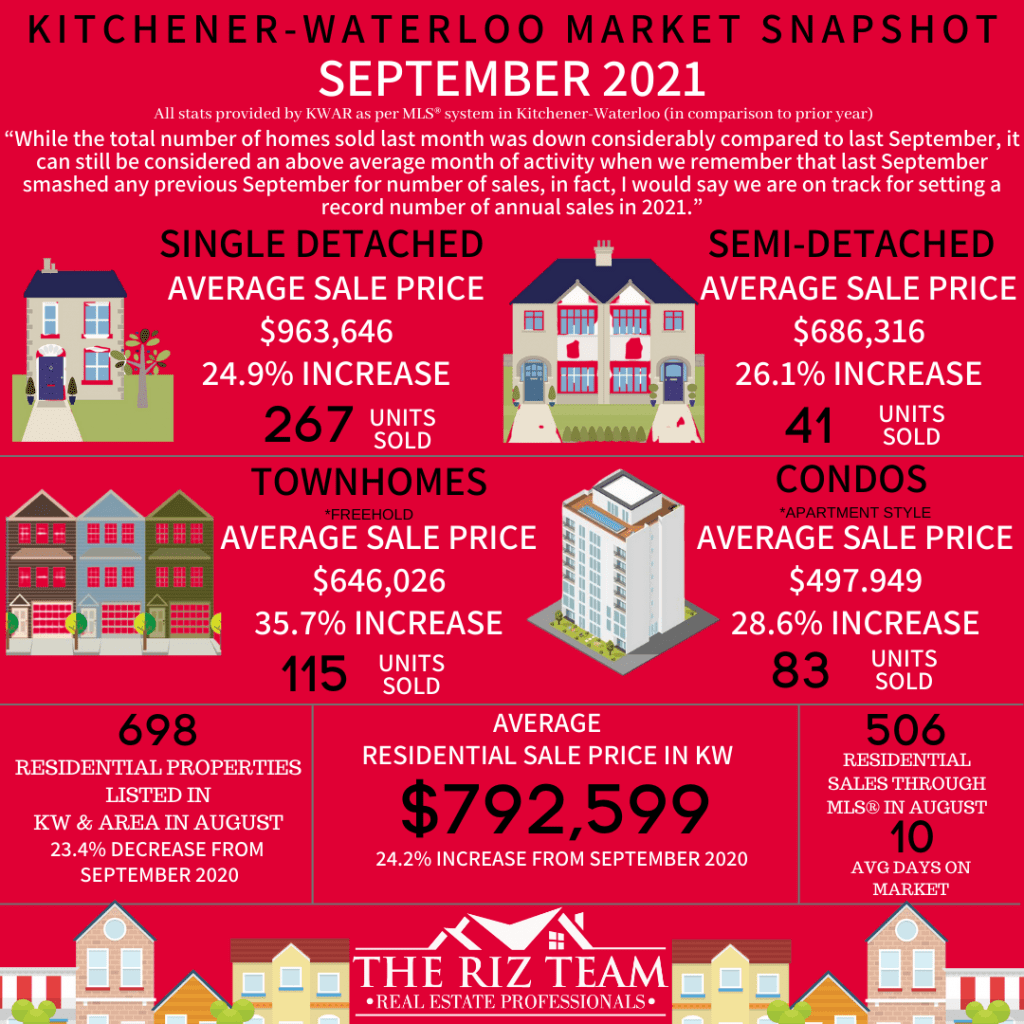
KITCHENER-WATERLOO, ON (October 4, 2021) –– A total of 506 residential homes sold last month through the Multiple Listing Service® (MLS® System) of the Kitchener-Waterloo Association of REALTORS® (KWAR), a decrease of 32.1 per cent compared to last September and a decrease of 5.9 per cent compared to August.

“While the total number of homes sold last month was down considerably compared to last September, it can still be considered an above average month of activity when we remember that last September smashed any previous September for number of sales,” says KWAR’s president, Nicole Pohl. “In fact, I would say we are on track for setting a record number of annual sales in 2021.”

Total residential sales in September included 267 detached (down 37.3 per cent from September 2020), and 83 condominium units (down 11.7 per cent). Sales also included 41 semi-detached homes (down 21.2) and 115 townhouses (down 33.5 per cent).

In September, the average sale price for all residential properties in the Kitchener-Waterloo area was $792,599. This represents a 24.2 per cent increase over September 2020 and a 5.7 per cent increase compared to August 2021.

  • The average price of a detached home was $963,646. This represents a 24.9 per cent increase from September 2020 and an increase of 7.9 per cent compared to August 2021.
  • The average sale price for an apartment-style condominium was $497,949. This represents an increase of 28.6 per cent from September 2020 and an increase of 12.4 per cent compared to August 2021.
  • The average sale price for a townhouse was $646,026. This represents a 35.7 per cent increase from September 2020 and an increase of 3.7 per cent compared to August 2021.
  • The average sale price for a semi was $686,316. This represents an increase of 26.1 per cent compared to September 2020 and an increase of 0.5 per cent compared to August 2021.


KWAR cautions that average sale price information can be useful in establishing long-term trends but should not be used as an indicator that specific properties have increased or decreased in value. The MLS® Home Price Index (HPI) provides the best way to gauge price trends because averages are strongly distorted by changes in the mix of sales activity from one month to the next.

The MLS® HPI composite benchmark price for all residential properties in Kitchener-Waterloo was $784,200 in September. This represents a 33.0 per cent increase over September 2020 and a 3.5 per cent increase compared to August 2021.

  • The benchmark price for a detached home was $869,220. This represents a 34.2 per cent increase from September 2020 and 3.8 per cent increase compared to August 2021.
  • The benchmark price for an apartment-style condominium was $392,600. This represents a 21.5 per cent increase from September 2020 and a 3.1 per cent increase compared to August 2021.
  • The benchmark price for a townhouse is $581,700. This represents a 40.0 per cent increase from September 2020 and a 2.4 per cent increase compared to August 2021.

There were 698 new listings added to the MLS® System in KW and area last month, a decrease of 23.4 per cent compared to September of last year, and a 13 per cent decrease compared to the previous ten-year average for September.

The total number of homes available for sale in active status at the end of September was 345, a decrease of 35.3 per cent compared to September of last year, and 73.2 per cent below the previous ten-year average of 1,285 listings for September.

“Home prices reached all new highs in September, “says Pohl. “And while there is a growing call to add more transparency to how real estate is traded in Ontario —the brutal reality of this market is that supply is simply not keeping up with demand and that is what is driving up prices.”

The President of KWAR says: “While there are many who have zeroed in on the blind bidding process, the greater concern is that homes are being purchased without all the normal conditions you would see in a balanced market. As a practicing REALTOR® I completely support and hope the government will add the ability for REALTORS® to provide greater transparency on offers,” says Pohl. “But as it is, we are legislatively restricted from disclosing anything more than simply the number of offers, which is not working for homebuyers.”

The number of months of inventory nudged up slightly from August’s 0.4 months to half a month in September. Inventory has settled at under 1 month for the past 11 consecutive months. The number of months of inventory represents how long it would take to sell off current inventories at the current rate of sales.

The average number of days to sell in September was 10 days, compared to 14 days in September 2020 and a previous 5-year average of 23 days.

Those requiring specific information on property values should contact a local REALTOR®.  Working with a Realtor is the best way to get a complete picture of the property and community you are considering.

View our HPI tool here to learn more: https://kwar.ca/hpi-dashboard

Historical Sales By Property Type

Months Supply of Homes for Sale


Historical Median Sales Price – By Property Type

Historical Average Sales Price – By Property Type

Average Days on Market

KWAR cautions that average sale price information can be useful in establishing long-term trends but should not be used as an indicator that specific properties have increased or decreased in value. The average sale price is calculated based on the total dollar volume of all properties sold. Months Supply is the inventory of homes for sale at the end of a given month, divided by the average monthly closed sales from the last 12 months Those requiring specific information on property values should contact a local REALTOR®. REALTORS® have their fingers on the pulse of the market. They know the questions to ask, the areas to probe, and what to look for so that you get a complete picture of the property and community you’re considering.

Kitchener-Waterloo Market Snapshot August 2021

Friday, September 3rd, 2021

August Stats 2021

HOMEBUYING DEMAND CONTINUES TO OVERWHELM HOUSING SUPPLY

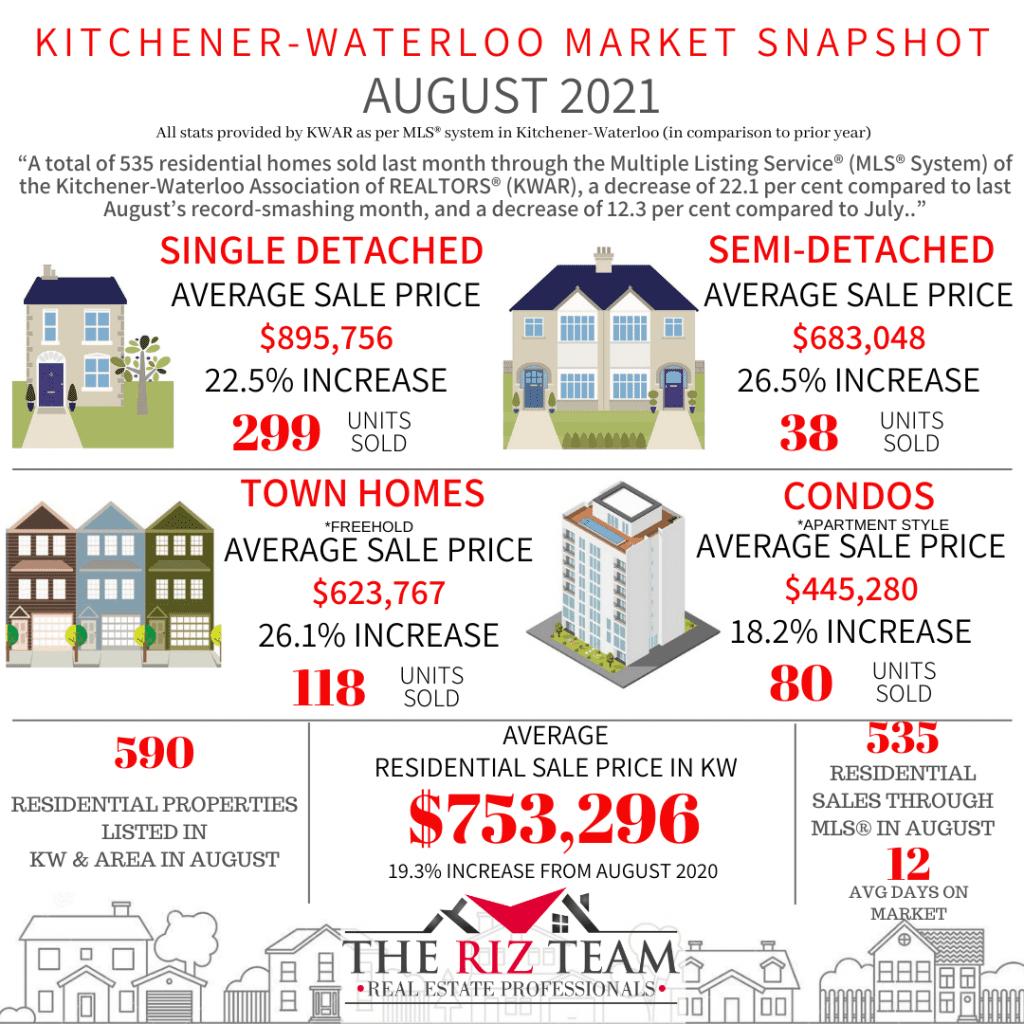
KITCHENER-WATERLOO, ON (September 3, 2021) –– A total of 535 residential homes sold last month through the Multiple Listing Service® (MLS® System) of the Kitchener-Waterloo Association of REALTORS® (KWAR), a decrease of 22.1 per cent compared to last August’s record-smashing month, and a decrease of 12.3 per cent compared to July.

While sales were down relative to last month and last August, they remained well above average notes KWAR’s president, Nicole Pohl. “The main reason for the decrease is simply that last month was the first full month in Step 3 of the reopening, and people were tired of the lockdown,” says Pohl. “They got out and enjoyed their summer and shifted their real estate needs to the back burner for a much-needed change of focus.”

Total residential sales in August included 299 detached (down 30.6 per cent from August 2020), and 80 condominium units (down 1.2 per cent). Sales also included 38 semi-detached homes (down 2.6) and 118 townhouses (down 13.2 per cent).

In August, the average sale price for all residential properties in the Kitchener-Waterloo area was $753,296. This represents a 19.3 per cent increase over August 2020 and a 0.3 per cent decrease compared to July 2021

  • The average price of a detached home was $895,756. This represents a 22.5 per cent increase from August 2020 and a decrease of 1.3 per cent compared to July 2021.
  • The average sale price for an apartment-style condominium was $445,280. This represents an increase of 18.2 per cent from August 2020 and an increase of 3.7 per cent compared to July 2021.
  • The average sale price for a townhouse was $623,767. This represents a 26.1 per cent increase from August 2020 and an increase of 0.1 per cent compared to July 2021.
  • The average sale price for a semi was $683,048. This represents an increase of 26.5 per cent compared to August 2020 and an increase of 2.3 per cent compared to July 2021.


KWAR cautions that average sale price information can be useful in establishing long-term trends but should not be used as an indicator that specific properties have increased or decreased in value. The MLS® Home Price Index (HPI) provides the best way to gauge price trends because averages are strongly distorted by changes in the mix of sales activity from one month to the next.

The MLS® HPI composite benchmark price for all residential properties in Kitchener-Waterloo was $757,900 in August. This represents a 29.5 per cent increase over August 2020 and a 1.2 per cent increase compared to July 2021.

  • The benchmark price for a detached home was $837,100. This represents a 31.5 per cent increase from August 2020 and 1.8 per cent increase compared to July 2021.
  • The benchmark price for an apartment-style condominium was $380,700. This represents a 11.7 per cent increase from August 2020 and a 1.3 per cent decrease compared to July 2021.
  • The benchmark price for a townhouse is $568,000. This represents a 37.3 per cent increase from August 2020 and a 0.6 per cent increase compared to July 2021.


There were 590 new listings added to the MLS® System in KW and area last month, a decrease of 27.6 per cent compared to August of last year, and a 13 per cent decrease compared to the previous ten-year average for August.

The total number of homes available for sale in active status at the end of August was 255, a decrease of 53.6 per cent compared to August of last year, and 79.5 per cent below the previous ten-year average of 1,252 listings for August.

“The number of homes coming to market continues to be overwhelmed by the number of homebuyers we have wanting to purchase in Waterloo Region,” says Pohl.

The number of months of inventory persisted from the July level of 0.4 months in August. Inventory has numbered less than 1 month since October. The number of months of inventory represents how long it would take to sell off current inventories at the current rate of sales.

The average number of days to sell in August was 12 days, compared to 17 days in August 2020 and a previous 5-year average of 26 days.

Those requiring specific information on property values should contact a local REALTOR®.  Working with a Realtor is the best way to get a complete picture of the property and community you are considering.

View our HPI tool here to learn more: https://kwar.ca/hpi-dashboard

Historical Sales By Property Type

Months Supply of Homes for Sale


Historical Median Sales Price – By Property Type


Historical Average Sales Price – By Property Type


Average Days on Market 

Kitchener Market Snapshot for July 2020

Saturday, August 8th, 2020

COMPETITIVE MARKET LEADS TO HUGE PRICE GAINS IN JULY

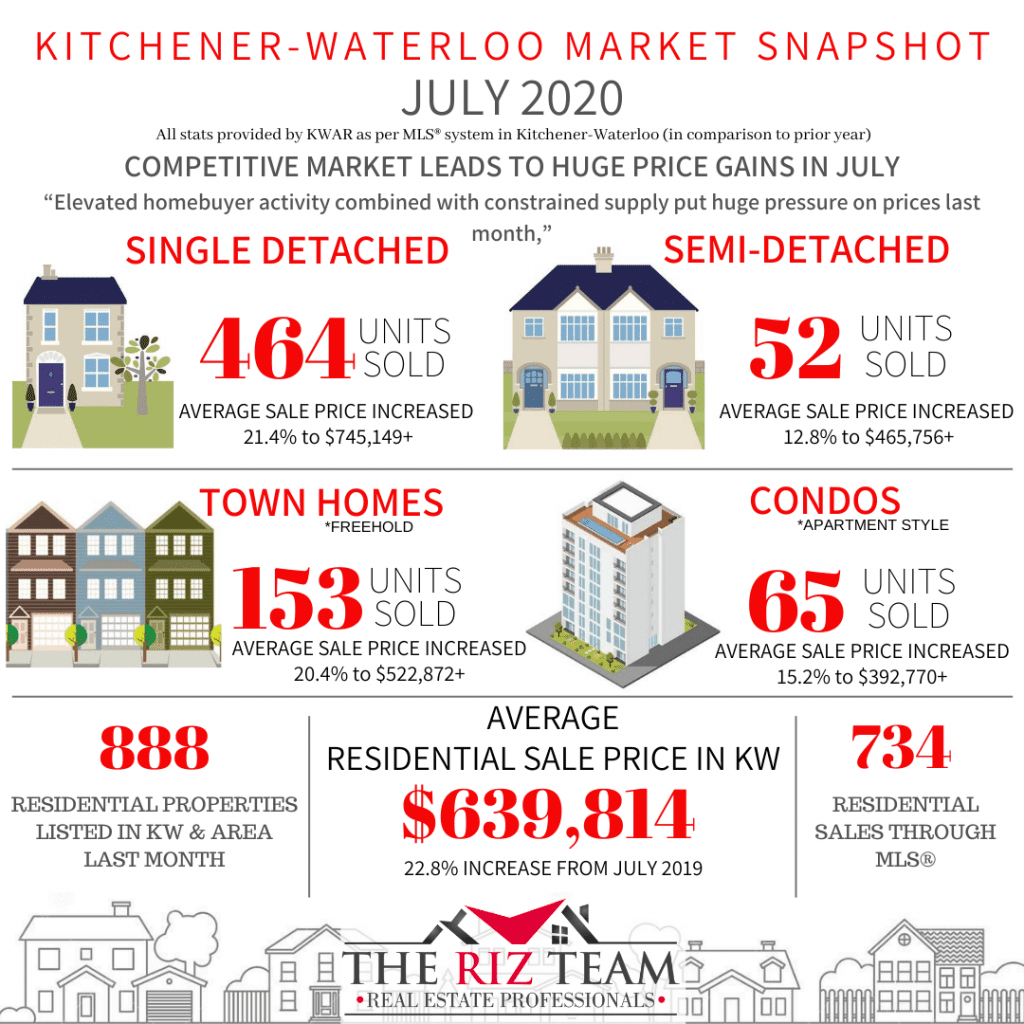
There were 734 residential homes sold through the Multiple Listing System (MLS® System)  of the Kitchener-Waterloo Association of REALTORS® in July, an increase of 25.7 per cent compared to the same month last year, and well above the previous ten-year average for July of 531.

“Competition was high for buyers looking to lock down a house in July,” said Colleen Koehler, President of KWAR.  “The rate of home sales in July resembled the kind of month we would normally see in May, and I chalk up much of that to the pent up demand that built as we moved into Stage 3 of reopening in mid-July.”

Total residential sales in July included 464 detached homes (up 39.3 per cent from July 2019), and 65 condominium apartments (up 3.2 per cent). Sales also included 153 townhouses (up 4.8 per cent) and 52 semi-detached homes (up 23.8 per cent).

The average sale price of all residential properties sold in July increased 22.8 per cent to $639,814 compared to the same month last year, while detached homes sold for an average price of $745,149 an increase of 21.4 per cent. During this same period, the average sale price for an apartment-style condominium was $392,770 for an increase of 15.2 per cent. Townhomes and semis sold for an average of $465,756 (up 12.8 per cent) and $522,872 (up 20.4 per cent) respectively.

The median price of all residential properties sold in July increased 21.7 per cent to $595,000 and the median price of a detached home during the same period increased 17.4 per cent to $675,000.

“Elevated homebuyer activity combined with constrained supply put huge pressure on prices last month,” said Koehler. “Homebuyers remain very confident about owning a home in Waterloo Region, and with mortgage rates still at near-record-low levels I expect we will continue to see strong home buyer demand going into the fall”.

There were 888 new listings added to the MLS® System in KW and area last month, an increase of 4.3 per cent compared to July of last year, and 15.5 per cent more than the previous ten-year average for July.

The total number of homes available for sale in active status at the end of July was 592, a decrease of 32.6 per cent compared to July of last year.

The number of Months Supply (also known as absorption rate) continues to be very low at just 1.3 months for the month of July, 27.8 per cent below the same period last year. The previous ten-year average supply of homes for July was 3.1 months, and in the past 5 years, the average supply for July was 2.1 months.

The average days to sell in July was 17 days, compared to 22 days in July 2019.

Koehler notes real estate was deemed an essential service from the beginning of the lockdown and REALTORS® have been taking all the necessary precautions to ensure transactions are done safely. KWAR’s president advises consumers talk to their Realtor® about what measures they will be taking to protect your health and safety as they help you on your real estate journey.

KWAR cautions that average sale price information can be useful in establishing long term trends but should not be used as an indicator that specific properties have increased or decreased in value. The average sale price is calculated based on the total dollar volume of all properties sold. Months Supply is the inventory of homes for sale at the end of a given month, divided by the average monthly closed sales from the last 12 months Those requiring specific information on property values should contact a local REALTOR®. REALTORS® have their fingers on the pulse of the market. They know the questions to ask, the areas to probe and what to look for so that you get a complete picture of the property and community you’re considering. 

Historical Sales By Property Type 

Months Supply of Homes for Sale 

Historical Median Sales Price – By Property Type 

Historical Average Sales Price – By Property Type 

Historical Sales – By Price Range 

Average Days on Market

Kitchener Market Snapshot for April 2020

Thursday, May 7th, 2020

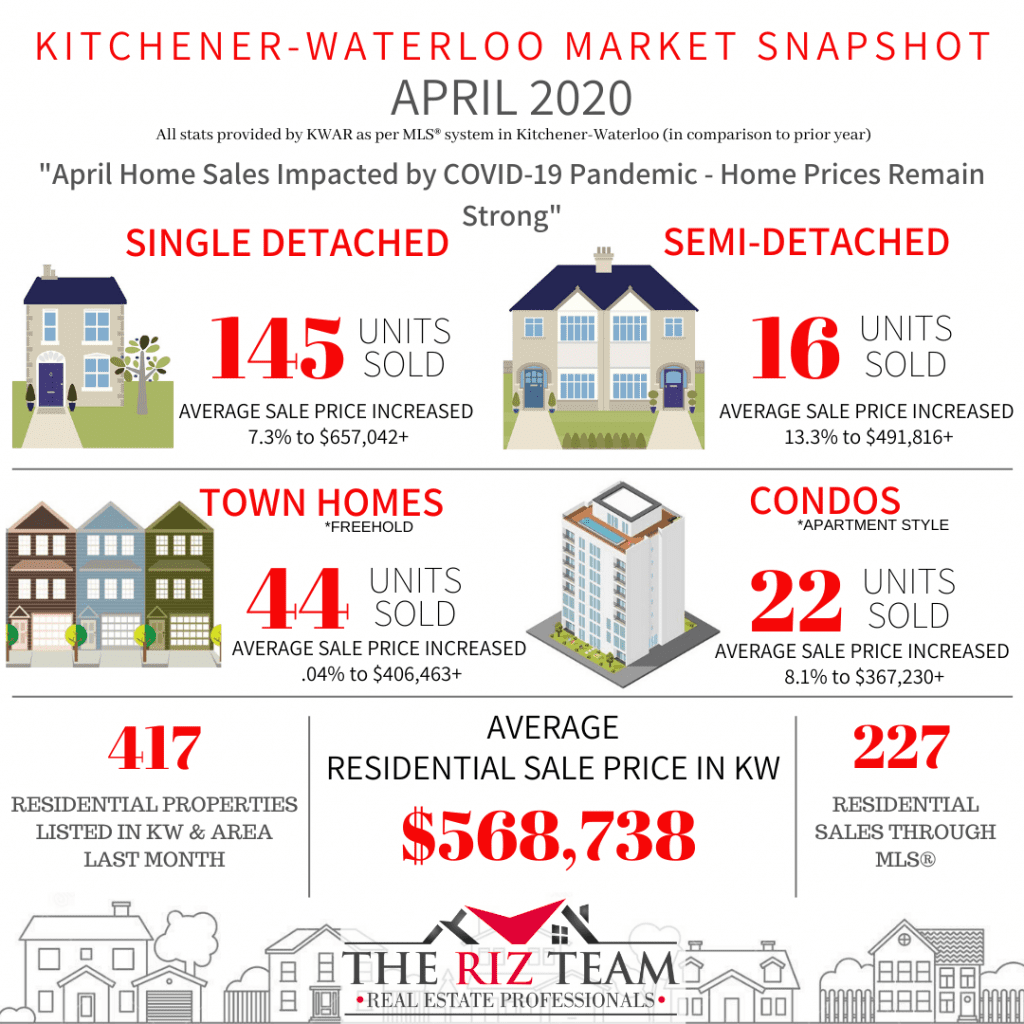
KITCHENER-WATERLOO, ON (May 4, 2020) ––There were 227 residential homes sold through the Multiple Listing System (MLS® System) of the Kitchener-Waterloo Association of REALTORS® in April, a decrease of 63.6 per cent compared to the same month last year, and the lowest number of sales in a single month since December 2008.

“It goes without saying the current pandemic has had a major impact on the number of sales we would normally see in April,” says Colleen Koehler, President of KWAR. “With everyone doing their part to flatten the curve and doing their best to self-isolate, the buying and selling of homes have been greatly reduced.”

Total residential sales in April included 145 detached homes (down 63.3 per cent), and 22 condominium apartments (down 71.1 per cent). Sales also included 44 townhouses (down 61.1 per cent) and 16 semi-detached homes (down 60 per cent).

The average sale price of all residential properties sold in April increased 7.3 per cent to $568,738 compared to the same month last year, while detached homes sold for an average price of $657,042 an increase of 7.3 per cent. During this same period, the average sale price for an apartment-style condominium was $367,230 for an increase of 8.1 per cent. Townhomes and semis sold for an average of $406,463 (up 0.4 per cent) and $491,816 (up 13.3 per cent) respectively.

The median price of all residential properties sold in April increased by 7.1 per cent to $525,000 and the median price of a detached home during the same period increased 6.3 per cent to $605,000.

While still deemed an essential service, REALTORS® listed considerably fewer homes in April due to the current state of emergency. There were 417 new listings added to the MLS® System in KW and area last month, a decrease of 54.8 per cent compared to April of 2019, far fewer than the previous 10-year average of 937 listings in April.

The total number of homes available for sale in active status at the end of April was 571, a decrease of 36.6 per cent compared to April of last year.

The number of Months Supply (also known as absorption rate) continues to be very low at just 1.2 months for the month of April, 36.8 per cent below the same period last year. The previous ten-year average supply of homes for April was 2.95 months, and in the past 5 years, the average supply for April was 2.12 months.

Koehler says most REALTORS® are advising sellers to hold off on listing their properties until after the state of emergency has been lifted. However, not every seller or buyer has that option which is why real estate was deemed an essential service. Realtors who have been working with buyers and sellers through this unprecedented time have been carefully following the guidelines of health Canada and taking all the necessary precautions to protect themselves and their clients. “In addition to health safety measures, our members are quickly adapting to new ways of showing property by conducting virtual showings for their clients, and other innovative practices,” says Koehler.

The president of KWAR is confident that despite the current pandemic, the slowdown in housing sales will be temporary.  “It has been a strong sellers’ market for the past few years with buyers competing for a scare number of listings.” Now for the first time in a long time, April saw some balance with a sales-to-new-listings ratio of 54 percent – well within the balanced threshold. “We have witnessed some buyers expecting homes to sell at greatly reduced amounts, and frankly, that’s simply not the case. Home values have remained stable which we expect will continue,” says Koehler.

The average days to sell in April was 19 days, compared to 21 days in April 2019.

KWAR cautions that average sale price information can be useful in establishing long term trends but should not be used as an indicator that specific properties have increased or decreased in value. The average sale price is calculated based on the total dollar volume of all properties sold. Months Supply is the inventory of homes for sale at the end of a given month, divided by the average monthly closed sales from the last 12 months Those requiring specific information on property values should contact a local REALTOR®. REALTORS® have their fingers on the pulse of the market. They know the questions to ask, the areas to probe and what to look for so that you get a complete picture of the property and community you’re considering.

Historical Sales By Property Type


Months Supply of Homes for Sale


Historical Median Sales Price – By Property Type


Historical Average Sales Price – By Property Type


Historical Sales – By Price Range


Average Days on Market


© Copyright 2017, Real Estate Websites by Redman Technologies Inc. | Privacy Policy | Disclaimer | Sitemap

MLS®, REALTOR®, and the associated logos are trademarks of The Canadian Real Estate Association.

The data included on this website is deemed to be reliable, but is not guaranteed to be accurate by the Kitchener-Waterloo Real Estate Board. The trademarks REALTOR®, REALTORS® and the REALTOR® logo are controlled by The Canadian Real Estate Association (CREA) and identify real estate professionals who are members of CREA. Used under license.