Friday, January 5th, 2024
Annual Home Sales Down Significantly in Waterloo Region in 2023
If you are considering to Sell your home or Buy a home in the next short while it would be highly beneficial for you to connect with one of our Team Agents at
Do you want to know what your home is worth today? Click Below for our Online No Obligation Market Evaluation
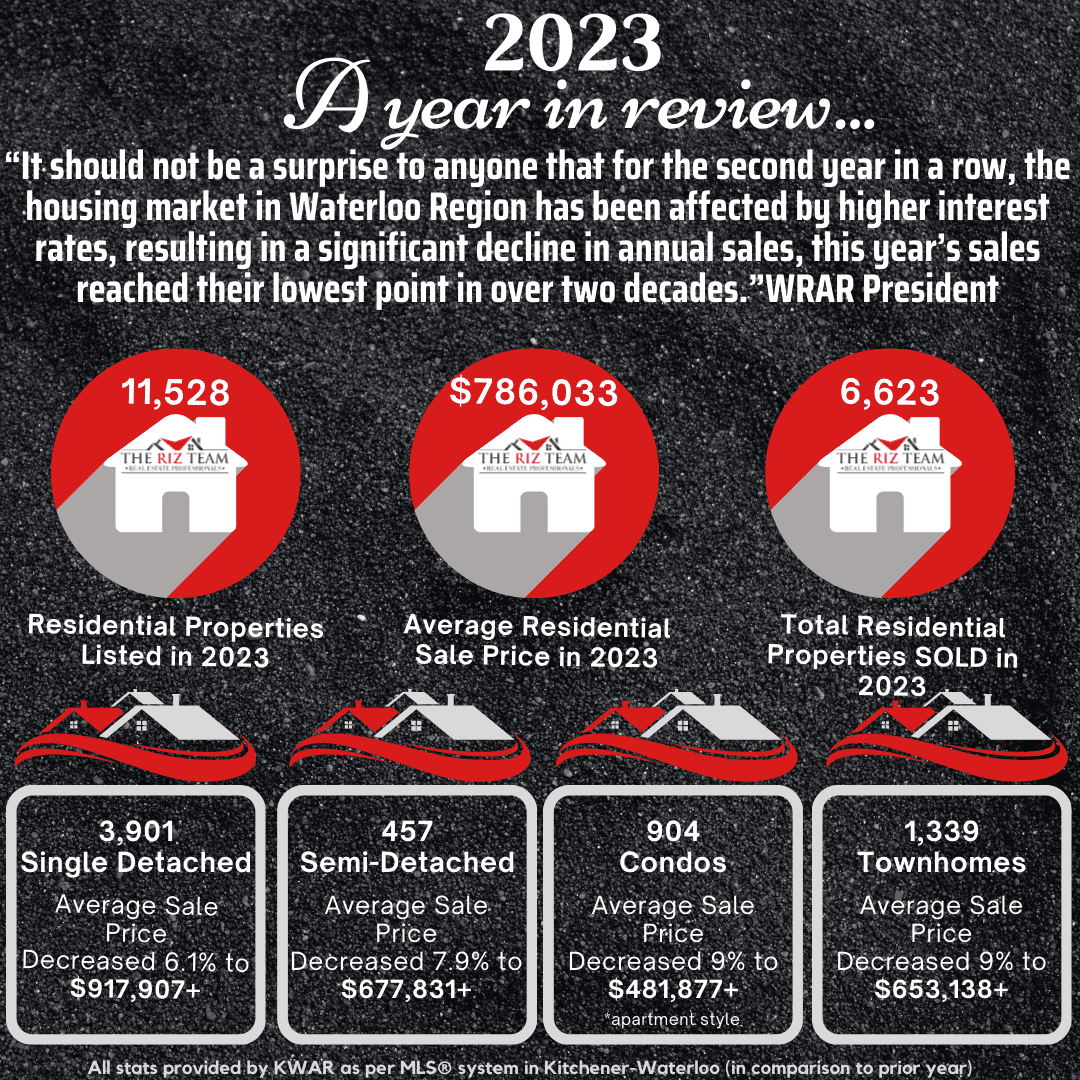
WATERLOO REGION, ON (January 5, 2024) — There were 6,623 homes sold through the Multiple Listing Service® (MLS®) System of the Waterloo Region Association of REALTORS® (WRAR) in 2023, a decrease of 14.8 per cent compared to 2022, and a decline of 23.2 per cent compared to the previous 5-year average for annual sales.
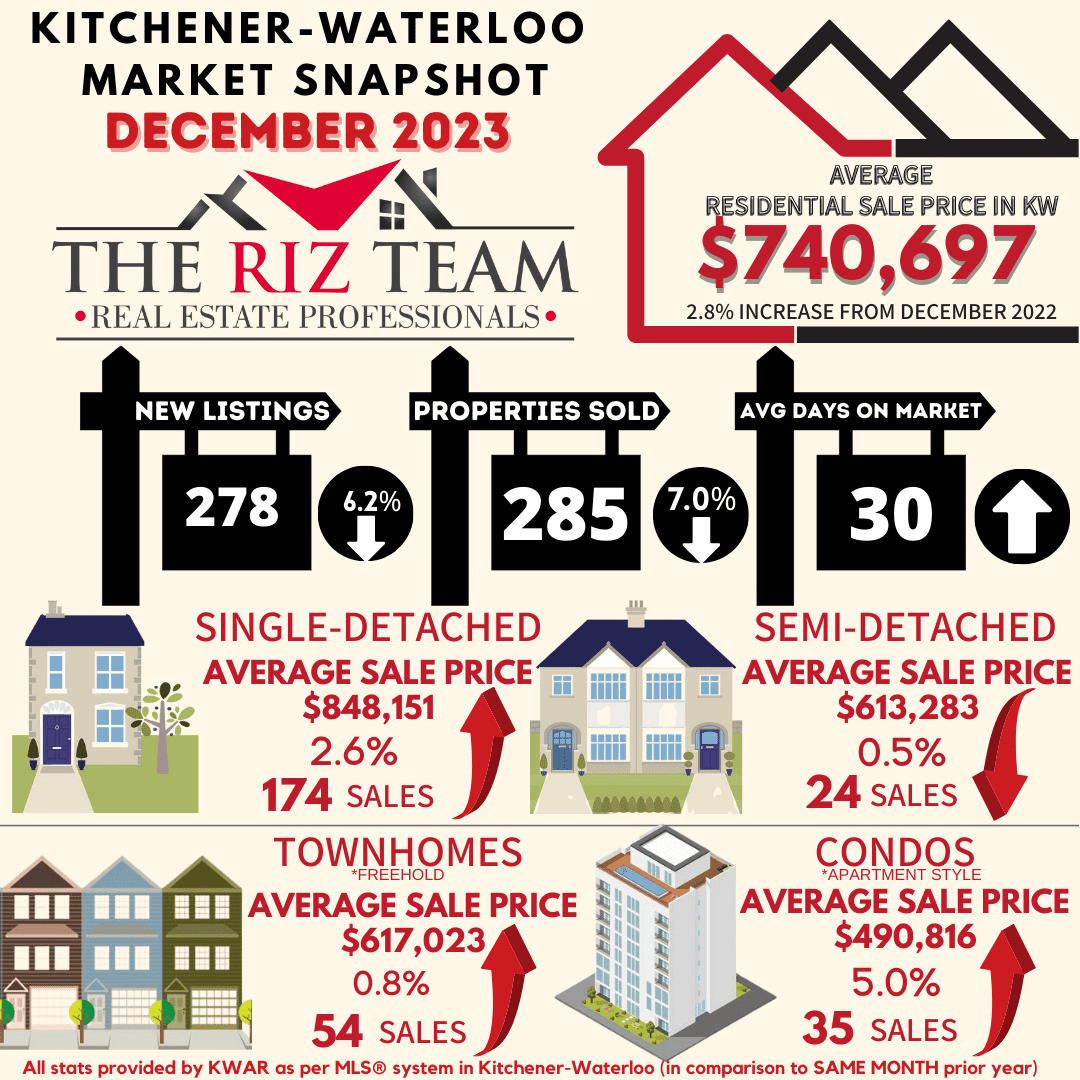
On a monthly basis, there were 285 homes sold in December, a decrease of 0.7 per cent compared to December 2022, and 25.6 per cent below the previous 5-year average for the month.
“It should not be a surprise to anyone that for the second year in a row, the housing market in Waterloo Region has been affected by higher interest rates, resulting in a significant decline in annual sales,” says Christal Moura, President of WRAR. “This year’s sales reached their lowest point in over two decades.”
According to Moura, the trend observed in December reflects the overall slowdown in home sales throughout the year, with sales falling behind historical levels. The last time annual sales in Waterloo Region recorded fewer than 7,000 units was the year 2000.
Total residential sales in December included 172 detached (up 3.6 per cent from December 2022), and 54 townhouses (down 6.9 per cent). Sales also included 35 condominium units (up 2.9 per cent) and 24 semi-detached homes (down 4.0 per cent).
For 2023, total residential sales included 3,901 detached (down 17.0 per cent), and 1,339 townhouses (down 6.5 per cent). Sales also included 904 condominium units (down 9.2 per cent) and 457 semi-detached homes (down 26.6 per cent).
In December, the average sale price for all residential properties in Waterloo Region was $740,697. This represents a 2.8 per cent increase compared to December 2022 and a 2.1 per cent decrease compared to November 2023.
- The average price of a detached home was $848,151. This represents a 2.6 per cent increase from December 2022 and a decrease of 4.7 per cent compared to November 2023.
- The average sale price for a townhouse was $617,023. This represents a 0.8 per cent increase from December 2022 and an increase of 1.2 per cent compared to November 2023.
- The average sale price for an apartment-style condominium was $490,816. This represents a 5.0 per cent increase from December 2022 and an increase of 9.0 per cent compared to November 2023.
- The average sale price for a semi was $613,283. This represents a decrease of 0.5 per cent compared to December 2022 and a decrease of 0.5 per cent compared to November 2023.
“Waterloo Region’s slowing housing market echoes the overall slowdown we are seeing in the broader economy,” says Moura.”
There were 287 new listings added to the MLS® System in the Waterloo Region last month, a decrease of 6.2 per cent compared to December of last year and a 17.9 per cent decrease compared to the previous ten-year average for December.
In 2023, 11,528 new listings were added to WRAR’s MLS® System, a decrease of 14.4 per cent compared to 2022, and a 4.4 per cent decrease compared to the previous ten-year annual average.
The total number of homes available for sale in active status at the end of December was 779, an increase of 36.0 per cent compared to December of last year and 5.8 per cent above the previous ten-year average of 736 listings for December.
The number of months of inventory is up 55.6 per cent compared to December of last year, but still historically low at 1.4 months. Between 2010 and 2015, December’s rolling 12-month average was 3.5 months. The number of months of inventory represents how long it would take to sell off current inventories at the current sales rate.
The average number of days to sell in December was 30, compared to 25 days in December 2022. The previous 5-year average is 23 days.
The average days to sell in 2023 was 19 days, compared to 14 days in 2022 and a previous 5-year average of 18 days.
“While the dream of homeownership is alive, it is not quite well,” says Moura. “Housing continues to be less accessible to too many people in our region. This speaks to the pressing need for not just more housing to be built, but housing that spans all forms and economic strata, to ensure everyone has a suitable place to call home.”
Those requiring specific information on property values should contact a local REALTOR®. Working with a Realtor is the best way to get a complete picture of the property and community you are considering.
View our HPI tool here to learn more: https://wrar.ca/hpi/
Tags: buyers, for sale, home sales, kitchener, Kitchener Buyers, kitchener real estate, kitchener-waterloo, kitchener-waterloo association of realtors, Market Update, royal lepage, the riz team, Waterloo Buyers, Waterloo Homes, waterloo real estate, waterloo realtor, Waterloo Sellers, www.rizsellskw.com
Posted in Kitchener Buyers, Kitchener Sellers, Market Stats, Market Update, Real Estate News, Realtor Tips, Waterloo Buyers, Waterloo Sellers | Comments Off on Kitchener Waterloo Market Snapshot & Yearly Summary December 2023

")
")


