Kitchener Waterloo Market Snapshot November 2025
Thursday, December 4th, 2025Sales down nearly 15 percent year-over-year and prices adjusting accordingly…
“We saw a continued cooling of the housing market in November with sales down nearly 15 percent year-over-year and prices adjusting accordingly,” says Christal Moura, spokesperson for the Waterloo Region market. “While seasonal slowdowns are expected at this time of year, softer demand has contributed to higher inventory levels than we’ve seen in some time. These conditions offer a real opportunity for first-time buyers. Increased inventory and longer days on the market allow buyers to explore options thoroughly and, with their REALTOR®’s expertise, negotiate from a stronger position. The combination of Waterloo region being a highly desirable place to live and the lower interest rates makes me hopeful that buyers will be coming off the sidelines in the year ahead.”
If you are considering to SELL your home or BUY a home in the next short while,
it would be highly beneficial for you to connect with one of our Team Agents at
The Riz Team
Do you want to know what your home is worth today? Click Below for our Online No Obligation Market Evaluation:

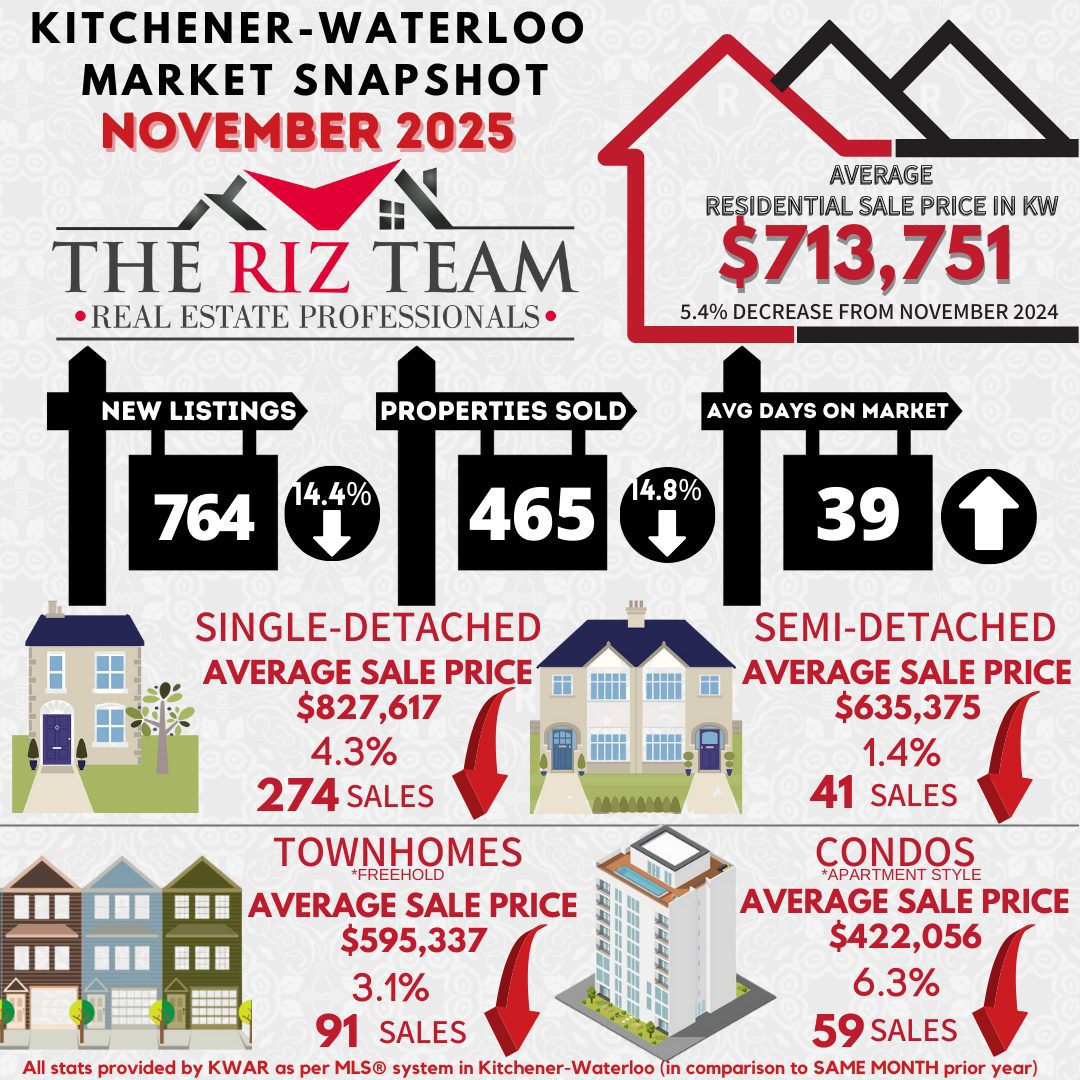
WATERLOO REGION, ON (December 4, 2025) —In November, a total of 465 homes were sold in the Waterloo Region via the Multiple Listing Service® (MLS®) System of the Cornerstone Association of REALTORS® (Cornerstone). This represents a 14.8 per cent decrease compared to the same period last year and a decline of nearly 25 per cent compared to the average number of homes sold in the previous ten years for the same month.
“We saw a continued cooling of the housing market in November with sales down nearly 15 percent year-over-year and prices adjusting accordingly,” says Christal Moura, spokesperson for the Waterloo Region market. “While seasonal slowdowns are expected at this time of year, softer demand has contributed to higher inventory levels than we’ve seen in some time. These conditions offer a real opportunity for first-time buyers. Increased inventory and longer days on the market allow buyers to explore options thoroughly and, with their REALTOR®’s expertise, negotiate from a stronger position. The combination of Waterloo region being a highly desirable place to live and the lower interest rates makes me hopeful that buyers will be coming off the sidelines in the year ahead.”
Total residential sales in November included 274 detached homes (down 18.0 per cent from November 2024), and 91 townhouses (down 20.9 per cent). Sales also included 59 condominium units (up 11.3 per cent) and 41 semi-detached homes (down 6.8 per cent).
In November, the average sale price for all residential properties in Waterloo Region was $713,751. This represents a 5.4 per cent decrease compared to November 2024 and a 2.7 per cent decrease compared to October 2025.
- The average sale price of a detached home was $827,617. This represents a 4.3 per cent decrease from November 2024 and a decrease of 1.8 per cent compared to October 2025.
- The average sale price for a townhouse was $595,337. This represents an 3.1 per cent decrease from November 2024 and an increase of 0.5 per cent compared to October 2025.
- The average sale price for an apartment-style condominium was $422,056. This represents a 6.3 per cent decrease from November 2024 and a decrease of 2.2 per cent compared to October 2025.
- The average sale price for a semi was $635,375. This represents a decrease of 1.4 per cent compared to November 2024 and an increase of 10.8 per cent compared to October 2025.

CORNERSTONE cautions that average sale price information can help establish long-term trends but does not indicate specific properties have increased or decreased in value. The MLS® Home Price Index (HPI) provides the best way to gauge price trends because averages are strongly distorted by changes in the mix of sales activity from one month to the next.
MLS® Home Price Index Benchmark Price (HPI) |
||||||
| Kitchener-Waterloo | Cambridge | |||||
| Benchmark Type: | November 2025 | Monthly % Change | Yr./Yr. % Change | November 2025 | Monthly % Change | Yr./Yr. % Change |
| Composite | $642,600 | -1.9 | -8.7 | $685,400 | -0.3 | -6.2 |
| Single Family | $754,000 | -2.5 | -8.7 | $728,900 | -0.2 | -6.0 |
| Townhouse | $530,900 | -0.7 | -7.2 | $595,000 | -1.1 | -4.4 |
| Apartment | $395,700 | 0.1 | -10.5 | $436,200 | 0.4 | -7.1 |

There were 764 new listings added to the MLS® System in Waterloo Region last month, a decrease of 14.4 per cent compared to November last year, however, this figure remains consistent with the previous ten-year average for November.
At the end of November, there were 1,757 homes available for sale in active status, representing a 15.6% increase from November of last year. This marks the highest number of homes for sale in November in over a decade.
The total inventory across the market increased by 25.9 percent, resulting in a 3.4-month supply of all property types by the end of November. Condominium apartments had the highest inventory, with 6.4 months’ supply, followed by townhouses with 4.1 months’ supply and detached homes with 2.8 months’ supply. The number of months of inventory represents the time it would take to sell all current inventories at the current sales rate.
The average time to sell a home in November was 39 days, which is 8 days longer than the previous month. In November 2024, it took 27 days for a home to sell, and the five-year average was 19 days.
View our HPI tool here to learn more: https://www.cornerstone.inc/stats/
Click on any of the graphs below for an interactive view.
Average Sales Price – Municipality

Average Sales Price – Township

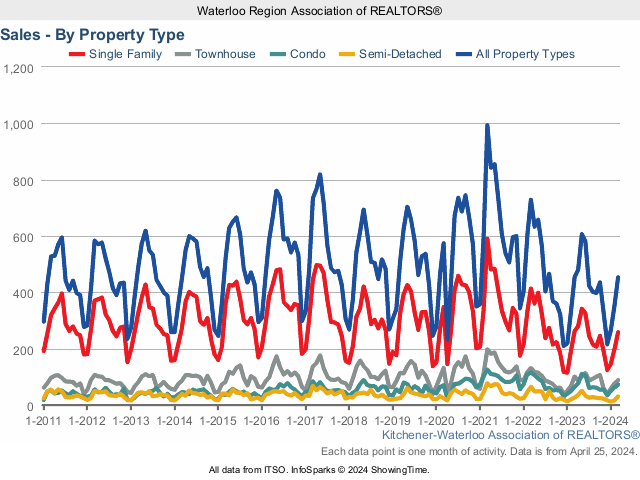
Monthly Sales By Property Type

Monthly Supply of Homes for Sale

Monthly Median Sales Price – By Property Type

Monthly Average Sales Price – By Property Type

Monthly Average Days on Market

Monthly Number of New Listings

Monthly Homes for Sale

Monthly Supply of Homes for Sale – By Property Type

Download PDF Version
Cornerstone Association of REALTORS® cautions that average sale price information can help identify long-term trends but should not indicate that specific properties have increased or decreased in value. The average sale price is calculated based on the total dollar volume of all properties sold. Months’ Supply is the inventory of homes for sale at the end of a given month, divided by the average monthly closed sales from the last 12 months. Those requiring specific information on property values should contact a Waterloo Region REALTOR®. REALTORS® have their fingers on the pulse of the market. They know the questions to ask, the areas to probe and what to look for to get a complete picture of the property and community you’re considering.