The Riz Team Blog

Posts Tagged ‘waterloo’

Top 7 Tips to Attract the Best Offers for Your Home

Friday, November 17th, 2023

Not long ago, home sellers were in their heyday, as historically-low mortgage rates triggered a real estate buying frenzy. However, the Bank of Canada shut down the party when it began raising interest rates last year. 

Now, it’s not as simple to sell a home. While pandemic-era home buyers were racing the clock—trying to lock in a low mortgage rate and gain a foothold in the market—current buyers are much more discerning. Higher prices and mortgage rates have pushed their limits of affordability, leading them to prioritize cost, condition, and overall value. 

The reality is, home inventory remains low, so most properties will still sell with some basic prep, the right price, and a good real estate agent. But owners who go the extra mile are more likely to sell faster and for a higher amount. 

If you have plans to sell your home and want to net the most money possible, this list is for you. Here are our top seven strategies to attract the best offers and maximize your real estate returns. 


  1. UNDERGO A PRE-LISTING INSPECTION

Many homebuyers hire a professional to complete a home inspection before they close. But did you know that a seller can order their own inspection, known as a pre-listing inspection, before they put their home on the market? 

Having a pre-listing inspection on hand and ready to share shows interested buyers that you’re committed to a transparent transaction. This can help you market your home, strengthen your negotiating position, and minimize roadblocks to closing. 

Of course, it’s always possible that a pre-listing inspection—which looks at the home’s major systems and structures, among other things—could turn up a significant problem. This does carry some risk, as you’ll be required to either fix or disclose any issues to potential buyers. However, in most cases, it’s better to know about and address deficiencies upfront than to find out mid-transaction, when it could cost you more in the form of repair credits, a delayed closing, or a canceled sale. 

We can help you decide if a pre-listing inspection is right for you. And if it identifies any concerns, we can advise on which items need attention before you list your home. 


  1. CONSIDER STRATEGIC UPGRADES

Embarking on major renovations before putting your home on the market doesn’t always make financial (or logistical) sense. However, certain upgrades are more likely to pay off and can help elevate your home in the eyes of buyers. 

For example, new flooring can generate up to a 150% return on investment at resale and a countertop upgrade could pay for itself. Similarly, research shows landscaping features can increase a home’s value by up to 12%.

Often, even simpler and less expensive fixes can make a big difference in how your home comes across to buyers. A fresh coat of paint in a neutral colour, modern light fixtures and hardware, and new caulk around the tub or shower can help your property look its best. 

But before you make any changes to your home, reach out. We know what buyers in your neighborhood are looking for and can help you decide if a particular investment is worthwhile. 


  1. HIRE A HOME STAGER

To get standout offers, you need potential buyers to fall in love with your home—and they’re much more likely to do so if they can envision themselves in the space. 

That’s where home staging comes in. Staging can include everything from decluttering and packing away personal items to bringing in neutral furniture and accessories for showings and open houses. 

According to the U.S.-based National Association of Realtors, home staging can both increase the dollar value of home offers and help a property sell faster. In fact, 53% of seller’s agents agree that staging decreases the amount of time a home spends on the market, and 44% of buyer’s agents see higher offers for staged homes. 

There’s plenty of strategy and research behind the process, so it’s smart to consider a professional. Reach out for a connection to one of our recommended home stagers who can help your property show its full potential. 


  1. EMPLOY A COMPETITIVE PRICING STRATEGY

While it’s tempting to list your property at the highest possible price, that approach can backfire. Homes that are overpriced tend to sit on the market, which can drive away potential buyers—and drive down offers. 

Alternatively, if you price your home competitively, which is either at or slightly below market value, it can be among the nicest that buyers see within their budgets. This can ultimately lead to a higher sales price and fewer concessions. 

To help you list at the right price, we will do a comparative market analysis, or CMA. This integral piece of research will help us determine an ideal listing price based on the amount that comparable properties have recently sold for in your neighborhood. 

Without this data, you risk pricing your home too high (and getting no offers) or too low (and leaving money on the table). Combined with our local market insights, we’ll help you find that sweet spot that will attract the best offers while maximizing your profit margin. 


  1. OFFER ALTERNATIVE FINANCING

Conventional mortgages, while widely used, may not be accessible to everyone. For example, higher mortgage rates and home prices have made it difficult for some homebuyers to pass the required mortgage stress test. 

Consequently, certain alternatives, like vendor take-back (VTB) mortgages, are becoming increasingly popular. A VTB mortgage is a unique financing arrangement in which the seller of a property provides a loan to the buyer for all or a portion of the purchase price. 

Buyers who don’t qualify for a traditional mortgage can be highly motivated to purchase from a seller offering a VTB loan. Sellers, consequently, can benefit too, by commanding a higher price or collecting more interest on their capital than they could from a standard investment. Depending on the seller’s circumstances, there may also be certain tax advantages. 

It’s important to note, however, that there are risks involved. Therefore, both buyers and sellers should seek legal and financial advice before entering into a VTB mortgage agreement to ensure all aspects are properly structured and understood. If interested, we can refer you to the appropriate professionals for help. 


  1. USE A PROVEN PROPERTY MARKETING PLAN

Gone are the days when it was enough to put a “for sale” sign in your yard and place a listing on the MLS. A strategic marketing plan is now essential to get your home in front of as many interested and qualified buyers as possible. 

The truth is, buyers who don’t know about your house can’t make an offer. That’s why we utilize a multi-step approach to marketing that starts with identifying your target audience, effectively positioning your home in the market, and communicating its unique value. We then use a variety of distribution channels to connect with potential buyers and performance-based metrics to monitor and improve our campaign results. 

Our proven approach can have a big impact on the success of your sale. Reach out to learn more about our multi-step marketing plan and discuss how we can use it to generate interest and offers for your home. 


  1. WORK WITH AN AGENT WHO UNDERSTANDS YOUR AREA

To get the best offers possible, you need a real estate agent who knows your area inside and out.  Any agent can pull comparable sales data, but in a quickly-evolving market, even the latest comps can lag the current market reality. We have our fingers on the pulse of the local market because we’re working directly with sellers like you. We also represent local buyers who are active in the market, searching for homes like yours. 

That puts us in an ideal position to help you price your home for a quick sale and maximum profit. And since we hear first-hand what local buyers want, we can help you prep your home to broaden its appeal and highlight its most-coveted features. Additionally, we can use our extensive network of local agents to solicit feedback and get your home in front of more potential buyers. 

All of these factors can add up to a significant difference in your profit: According to a U.S.-based study, in 2021, the typical home sold by owner went for $225,000 compared to a median price of $330,000 for agent-assisted home sales. 


LET’S GET MOVING 

Are you ready to get a great offer for your home? Our multifaceted approach can help you maximize your real estate returns. Reach out for a free home value assessment and customized sales plan to get started! 


The above references an opinion and is for informational purposes only.  It is not intended to be financial, legal, or tax advice. Consult the appropriate professionals for advice regarding your individual needs.

 Be sure to reach out to Nicole Shantz – Sales Representative for The Riz Team and discuss the current market conditions

Nicole Shantz

Sales Representative

Book a call with me! Click https://linktr.ee/NicoleShantz

c. 519.591.7413

o. 519.578.7300

e. nicole@therizteam.com

w. www.therizteam.com

a. 71 Weber St. E., Kitchener, Ontario, N2H 1C6 

Sources: 

National Post – https://nationalpost.com/moneywise-pro/high-interest-rates-are-still-a-problem-for-potential-homebuyers-here-is-advice-for-navigating-the-real-estate-market 

Bankrate – https://www.bankrate.com/real-estate/prelisting-inspection/ 

RE/MAX Canada – https://blog.remax.ca/best-home-renovations-biggest-roi/ 

Journal of Real Estate Research – https://www.researchgate.net/publication/5142154_Landscaping_and_House_Values_An_Empirical_Investigation 

National Association of Realtors – https://www.nar.realtor/infographics/staged-for-success 

The Balance – https://www.thebalancemoney.com/looking-twice-at-overpriced-homes-1798671 

Real Estate Magazine – https://realestatemagazine.ca/the-return-of-the-vendor-take-back-mortgage/ 

RE/MAX Canada – https://blog.remax.ca/how-to-take-advantage-of-the-vendor-take-back-mortgage/ 

National Association of Realtors – https://www.nar.realtor/research-and-statistics/quick-real-estate-statistics

Kitchener Waterloo Market Snapshot September 2023

Wednesday, October 4th, 2023

Surge of New Listings in September Against Low Number of Sales

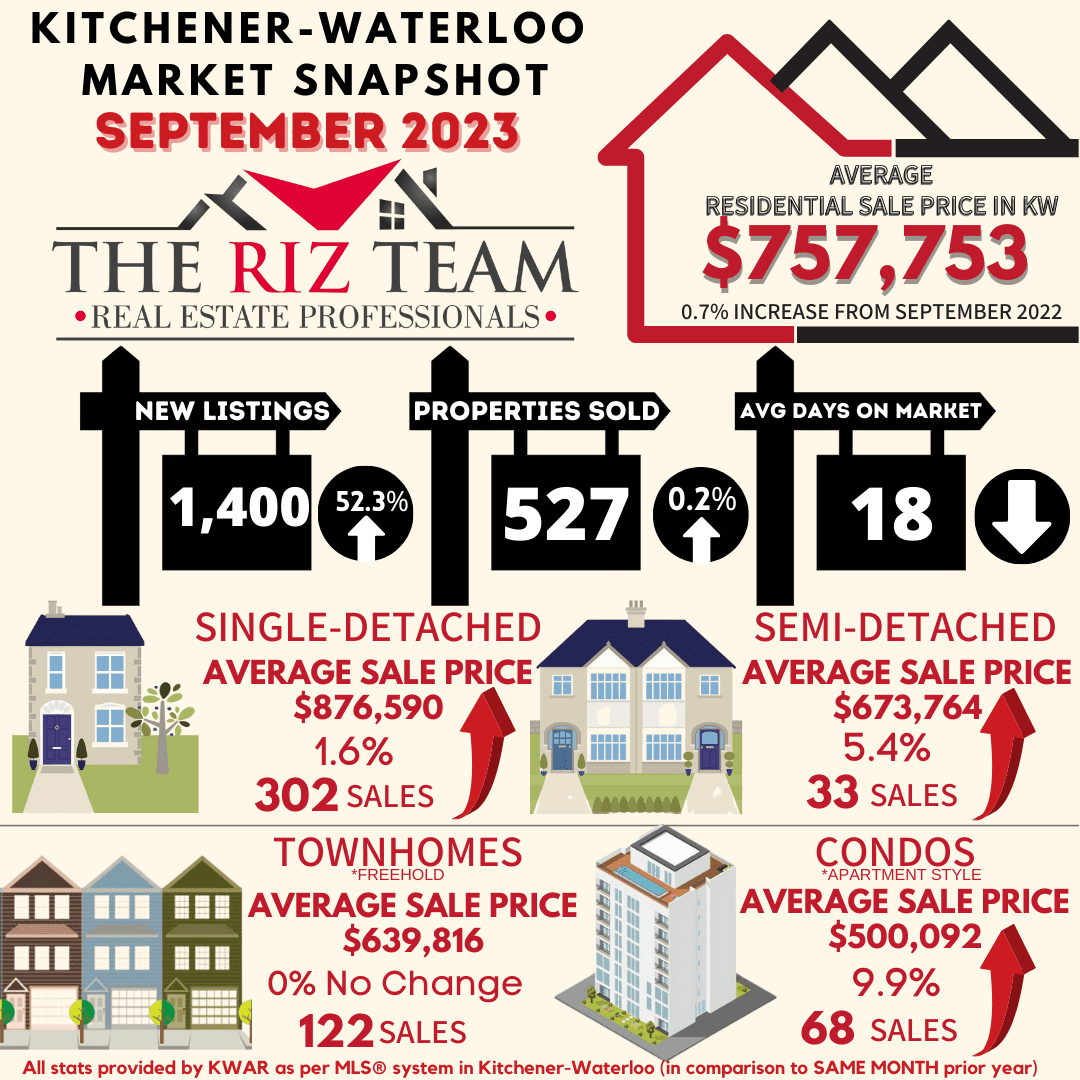
This article will provide a comprehensive snapshot of the KW real estate market for September 2023.

“The number of homes sold last month was very close to last year’s decade-low for the month of September,” says Megan Bell, president of WRAR.  “At the same time, we had a record number of new listings for the month of September.” 

If you are considering to Sell your home or Buy a home in the next short while it would be highly beneficial for you to connect with one of our Team Agents at

The Riz Team

Do you want to know what your home is worth today? Click Below for our Online No Obligation Market EvaluationClick HereClick Here

WATERLOO REGION, ON (October 4, 2023) — In September, there were 527 homes sold through the Multiple Listing Service® (MLS®) System of the Waterloo Region Association of REALTORS® (WRAR), representing an increase of 0.2 per cent compared to the previous year and a decline of 27.1 per cent compared to the previous 5-year average for the month.

“The number of homes sold last month was very close to last year’s decade-low for the month of September,” says Megan Bell, president of WRAR.  “At the same time, we had a record number of new listings for the month of September.”

Total residential sales in September included 302 detached (down 4.7 per cent from September 2022), and 122 townhouses (up 25.8 per cent). Sales also included 68 condominium units (up 9.7 per cent) and 33 semi-detached homes (down 34.0 per cent).

In September, the average sale price for all residential properties in Waterloo Region was $757,753. This represents a 0.7 per cent increase compared to September 2022 and a 0.3 per cent decrease compared to August 2023.

  • The average price of a detached home was $876,590. This represents a 1.6 per cent increase from September 2022 and a decrease of 0.5 per cent compared to August 2023.
  • The average sale price for a townhouse was $639,816. This represents no change from September 2022 and a decrease of 2.9 per cent compared to August 2023.
  • The average sale price for an apartment-style condominium was $500,092. This represents an increase of 9.9 per cent from September 2022 and an increase 3.1 per cent compared to August 2023.
  • The average sale price for a semi was $673,764. This represents an increase of 5.4 per cent compared to September 2022 and an increase 0.1 per cent compared to August 2023.

WRAR cautions that average sale price information can be useful in establishing long-term trends but should not be used as an indicator that specific properties have increased or decreased in value. The MLS® Home Price Index (HPI) provides the best way to gauge price trends because averages are strongly distorted by changes in the mix of sales activity from one month to the next.

092023_Average_Sales_Price-By_Property_Type

MLS® Home Price Index Benchmark Price

  Kitchener-Waterloo Cambridge
Benchmark Type: September 2023 Monthly % Change Yr./Yr. % Change September 2023 Monthly % Change Yr./Yr. % Change
Composite $734,600 -1.4 1.1 $741,300 -2.2 -0.6
Detached $832,900 -1.7 2.6 $766,100 -2.8 -0.2
Townhouse $630,300 -0.7 1.8 $677,700 1.2 -0.8
Apartment $475,300 0.0 -1.5 $501,500 0.1 -8.8


September 2023 HPI Image for Stats Release

“There was a significant surge of new listings in September, resulting in the largest number of homes being on the market since March 2016,” said Bell. “For buyers with the financing to be house hunting in September, they would have found more favourable conditions in terms of supply than we have seen in a while.”

At the same time, WRAR’s president points to the recent poll the association conducted, which shows over one-quarter of Waterloo Region residents are considering moving to a more affordable location.

“WRAR recently released a report highlighting that Waterloo region’s residents are struggling under the affordability crisis, with four in ten reporting that they live in housing that is unaffordable,” said Bell.

Local REALTORS® call for action to build more missing middle housing as nearly 4 in 10 (38%) residents report living in unaffordable homes.

There were 1,400 new listings added to the MLS® System in Waterloo Region last month, an increase of 52.3 per cent compared to September of last year and a 30.5 per cent increase compared to the previous ten-year average for September.

The total number of homes available for sale in active status at the end of September was 1,448, an increase of 48.8 per cent compared to September of last year and 9.5 per cent above the previous ten-year average of 1322 listings for September.

There were 2.6 months of inventory at the end of September, an 85.7 per cent increase compared to last year and 34.7 per cent above the previous 10-year average. The number of months of inventory represents how long it would take to sell off current inventories at the current sales rate.

The average number of days to sell in September was 18, compared to 23 days in September 2022. The previous 5-year average is 20 days.

With the next scheduled Bank of Canada interest rate announcement set for October 25, buyers might be on the sidelines, waiting to see what unfolds. WRAR understands that some buyers may be unsure about their next steps. That’s why we encourage these buyers to reach out to local Realtors who can provide them with valuable insights about the current state of the local market and cater to their specific needs.


View our HPI tool here to learn more: https://wrar.ca/hpi/

Click on any of the graphs below for an interactive view.

092023_Average_Sales_Price
092023_Average_Sales_Price_Township
092023_Average_Sales_Price-By_Property_Type
092023_Months_supply_of_homes_for_sale
092023_Median_sales_price-by_propety_type
092023_Average_Sales_Price-By_Property_Type2
092023_Average_days_on_market

WRAR cautions that average sale price information can help identify long-term trends but should not be to indicate that specific properties have increased or decreased in value. The average sale price is calculated based on the total dollar volume of all properties sold. Months Supply is the inventory of homes for sale at the end of a given month, divided by the average monthly closed sales from the last 12 months. Those requiring specific information on property values should contact a Waterloo Region REALTOR®. REALTORS® have their fingers on the pulse of the market. They know the questions to ask, the areas to probe and what to look for so that you get a complete picture of the property and community you’re considering.


Kitchener Waterloo Market Snapshot August 2023

Wednesday, September 6th, 2023

Soft Home Sales in August Coupled with Strong Listing Activity

If you are considering to Sell your home or Buy a home in the next short while it would be highly beneficial for you to connect with one of our Team Agents at

The Riz Team

Do you want to know what your home is worth today? Click Below for our Online No Obligation Market EvaluationClick Here

Click Here to Evaluate your home

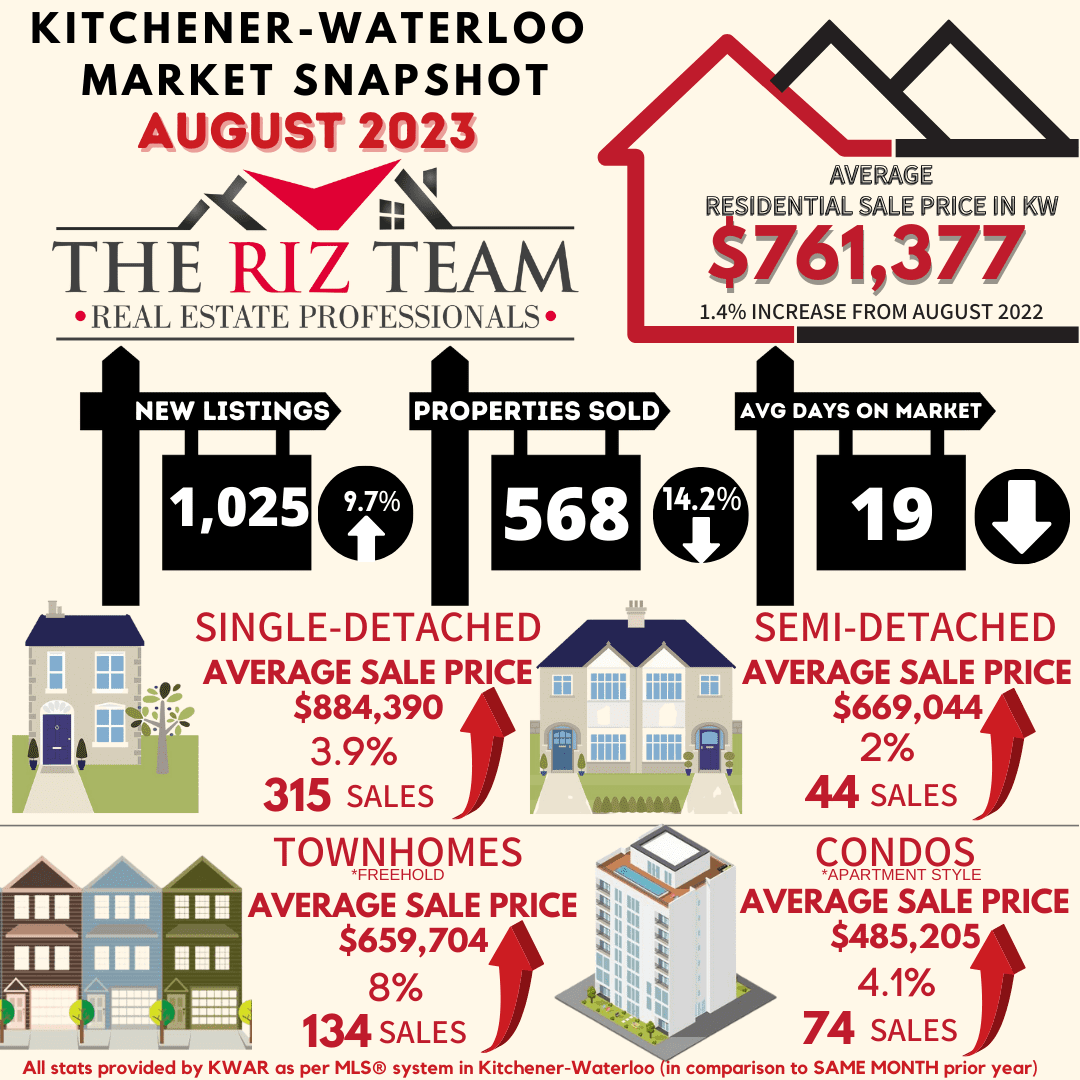
WATERLOO REGION, ON (September 6, 2023) — In August, there were 568 homes sold through the Multiple Listing Service® (MLS®) System of the Waterloo Region Association of REALTORS® (WRAR), representing a decrease of 14.2 per cent compared to the previous year and a decline of 23.5 per cent compared to the previous 5-year average for the month.

“For the first time in a decade we saw August’s home sales slip under the 600-unit mark,” says Megan Bell, president of WRAR.”  “Home sales were softer than normal last month, which is not surprising given the current borrowing environment.”

Total residential sales in August included 315 detached (down 24.1 per cent from August 2022), and 134 townhouses (up 12.6 per cent). Sales also included 74 condominium units (up 10.4 per cent) and 44 semi-detached homes (down 27.9 per cent).

In August, the average sale price for all residential properties in Waterloo Region was $761,377. This represents a 1.4 per cent increase compared to August 2022 and a 4.4 per cent decrease compared to July 2023.

  • The average price of a detached home was $884,390. This represents a 3.9 per cent increase from August 2022 and a decrease of 3.9 per cent compared to July 2023.
  • The average sale price for a townhouse was $659,704. This represents a 8.0 per cent increase from August 2022 and a decrease of 1.7 per cent compared to July 2023.
  • The average sale price for an apartment-style condominium was $485,205. This represents an increase of 4.1 per cent from August 2022 and a decrease of 2.3 per cent compared to July 2023.
  • The average sale price for a semi was $669,044. This represents an increase of 2.0 per cent compared to August 2022 and a decrease of 0.3 per cent compared to July 2023.

WRAR cautions that average sale price information can be useful in establishing long-term trends but should not be used as an indicator that specific properties have increased or decreased in value. The MLS® Home Price Index (HPI) provides the best way to gauge price trends because averages are strongly distorted by changes in the mix of sales activity from one month to the next.

August Average Sales Price - By Property Type 09062023

MLS® Home Price Index Benchmark Price

  Kitchener-Waterloo Cambridge
Benchmark Type: August 2023 Monthly % Change Yr./Yr. % Change August 2023 Monthly % Change Yr./Yr. % Change
Composite $745,100 -2.6 1.1 $758,000 -0.9 1.4
Detached $846,900 -2.5 3.3 $788,100 -1.1 3.3
Townhouse $634,900 -2.1 1.4 $669,300 0.9 -5.5
Apartment $475,400 -2.0 -5.2 $501,000 1.7 -12.4
HPI August 2023

“Home buyers had the advantage of strong listing activity in August, which helped to provide a little more choice and temper prices,” says Bell. “But affordability remains a top concern for many who are looking to get into the market and finding it a challenge to resolve what they want with what they can afford.”

WRAR’s president points out that while market-wide, inventory levels were up 7.6 per cent in August, this was mainly due to the Townhouse/Condo segment, where inventory increased by 35.3 per cent. The property type with the most supply in the market is the condo segment with 3.3 months supply, compared to 1.8 months supply in the detached home category.

“Right now, buyers may find it easier to get into a condominium, which can be a great choice for both first time buyers, and anyone looking for a lifestyle change.”

There were 1,025 new listings added to the MLS® System in Waterloo Region last month, an increase of 9.7 per cent compared to August of last year and a 11.7 per cent increase compared to the previous ten-year average for August.

The total number of homes available for sale in active status at the end of August was 1,094, an increase of 7.6 per cent compared to August of last year and 14.9 per cent below the previous ten-year average of 1431 listings for August.

There were 2.0 months of inventory at the end of August, unchanged from the end of July and in line with the previous 10-year average. The number of months of inventory represents how long it would take to sell off current inventories at the current sales rate.

The average number of days to sell in August was 19, compared to 23 days in August 2022. The previous 5-year average is 21 days.

View our HPI tool here to learn more: https://wrar.ca/hpi/

Click on any of the graphs below for an interactive view.

August Average Sales Price
August Average Sales Price - Township 09062023
Sales By Property Type 09062023
Supply of Homes 09062023
Median Sales - By Property type 09062023
Average Sales Price - By Property Type 09062023
Average Days on Market 09062023

Kitchener Waterloo Market Snapshot July 2023

Thursday, August 3rd, 2023

Strong Listing Activity in July

If you are considering to Sell your home or Buy a home in the next short while it would be highly beneficial for you to connect with one of our Team Agents at

The Riz Team

Do you want to know what your home is worth today? Click Below for our Online No Obligation Market EvaluationClick Here

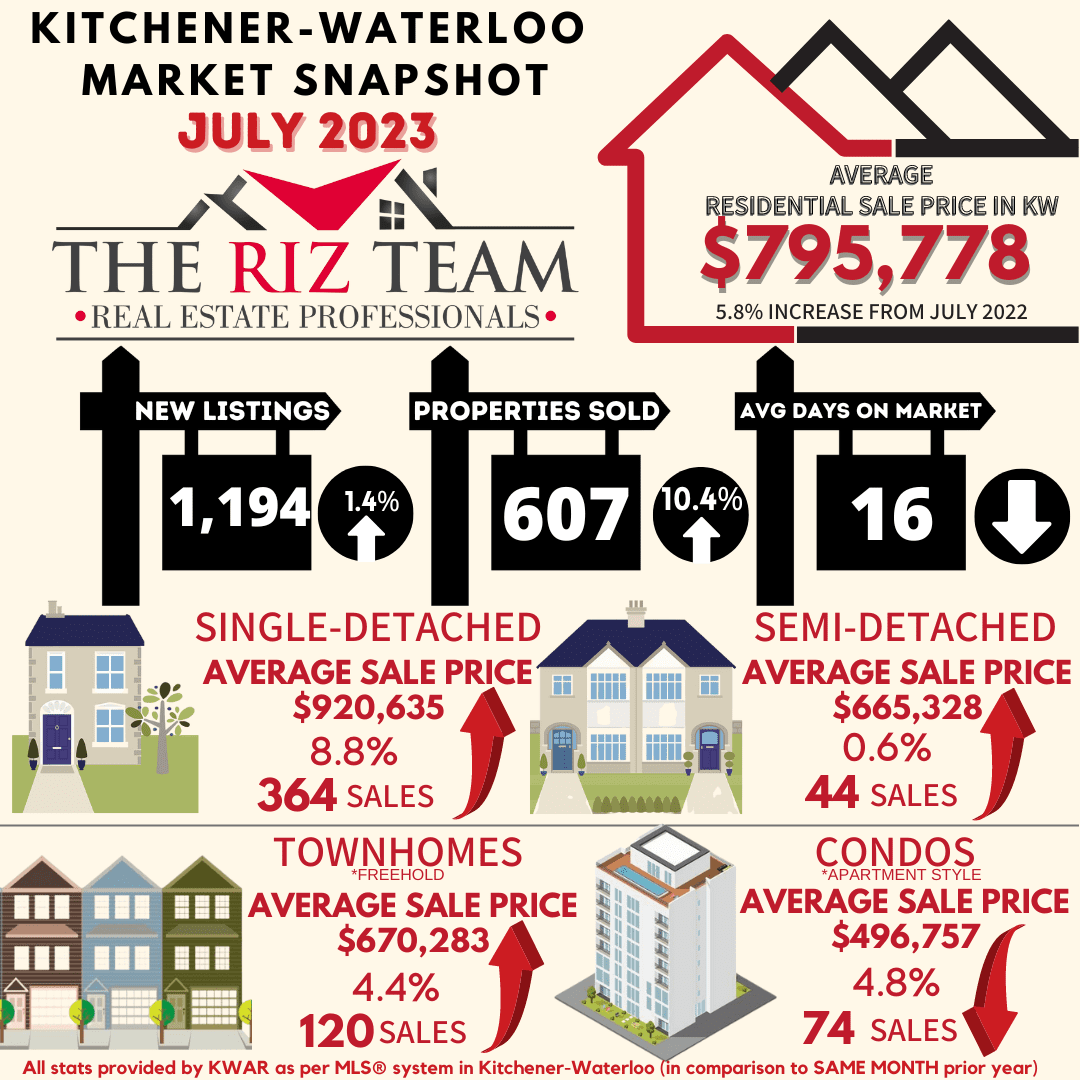
WATERLOO REGION, ON (August 3, 2023) — In July, there were 607 homes sold through the Multiple Listing Service® (MLS®) System of the Waterloo Region Association of REALTORS® (WRAR), representing an increase of 10.4 per cent compared to the previous year and a decline of 21.6 per cent compared to the previous 5-year average for the month.

“The Waterloo Region residential real estate market experienced some growth in terms of unit sales and supply in July, with home prices showing moderate fluctuations,” says Bell. “Despite the Bank of Canada’s most recent interest rate hike, we saw more sellers coming off the sidelines with new listing activity reaching its second highest level for the month of July in over a decade.”

Total residential sales in July included 364 detached (up 8.3 per cent from July 2022), and 120 townhouses (up 7.1 per cent). Sales also included 74 condominium units (up 15.6 per cent) and 44 semi-detached homes (up 22.2 per cent).

In July, the average sale price for all residential properties in Waterloo Region was $795,778. This represents a 5.8 per cent increase compared to July 2022 and a 5.2 per cent decrease compared to June 2023.

  • The average price of a detached home was $920,635. This represents an 8.8 per cent increase from July 2022 and a decrease of 8.4 per cent compared to June 2023.
  • The average sale price for a townhouse was $670,283. This represents a 4.4 per cent increase from July 2022 and an increase of 0.5 per cent compared to June 2023.
  • The average sale price for an apartment-style condominium was $496,757. This represents a decrease of 4.8 per cent from July 2022 and an increase of 5.6 per cent compared to June 2023.
  • The average sale price for a semi was $665,328. This represents an increase of 0.6 per cent compared to July 2022 and a decrease of 3.8 per cent compared to June 2023.

WRAR cautions that average sale price information can be useful in establishing long-term trends but should not be used as an indicator that specific properties have increased or decreased in value. The MLS® Home Price Index (HPI) provides the best way to gauge price trends because averages are strongly distorted by changes in the mix of sales activity from one month to the next.

July Average Sales Price by Property Type

MLS® Home Price Index Benchmark Price

Kitchener-Waterloo Cambridge
Benchmark Type: July 2023 Monthly % Change Yr./Yr. % Change July 2023 Monthly % Change Yr./Yr. % Change
Composite $765,000 -1.7 1.8 $764,600 -1.8 -1.2
Detached $869,000 -2.3 4.4 $797,100 -2.2 1.2
Townhouse $648,700 0.6 -0.3 $663,200 0.5 -11.9
Apartment $484,900 1.2 -5.5 $492,600 2.2 -14.8


July 2023 HPI Image for Stats Release

“In this ever-evolving market, demand persists despite the changing landscape. Increased listing activity is certainly welcomed to help offset the lack of supply and pent-up demand,” says Bell. “Working with a local REALTOR® is vital in navigating these shifting influences during the homebuying and selling process. Waterloo Region properties remain highly sought-after due to our diverse economy and desirable community, solidifying us in a competitive market.”

There were 1,194 new listings added to the MLS® System in Waterloo Region last month, an increase of 1.4 per cent compared to July of last year and a 10.8 per cent increase compared to the previous ten-year average for July.

The total number of homes available for sale in active status at the end of July was 1,107, a decrease of 14.8 per cent compared to July of last year and 22.6 per cent below the previous ten-year average of 1431 listings for July.

There were 2.0 months of inventory at the end of July, up slightly from the end of June and in line with the previous 10-year average. The number of months of inventory represents how long it would take to sell off current inventories at the current sales rate.

The average number of days to sell in July was 16, compared to 18 days in July 2022. The previous 5-year average is 18 days.

View our HPI tool here to learn more: https://wrar.ca/hpi/

Click on any of the graphs below for an interactive view.

average sales price by municipality
average sales price by township
monthly sales by property type
monthly supply of homes for sale
monthly median sales price by property type
monthly average sales price by property type
monthly average days on market

WRAR cautions that average sale price information can help identify long-term trends but should not be to indicate that specific properties have increased or decreased in value. The average sale price is calculated based on the total dollar volume of all properties sold. Months Supply is the inventory of homes for sale at the end of a given month, divided by the average monthly closed sales from the last 12 months. Those requiring specific information on property values should contact a Waterloo Region REALTOR®. REALTORS® have their fingers on the pulse of the market. They know the questions to ask, the areas to probe and what to look for so that you get a complete picture of the property and community you’re considering.


Kitchener Waterloo Market Snapshot May 2023

Friday, June 2nd, 2023

Waterloo Region Buyer and Listing Activity Ramps Up In May

If you are considering to Sell your home or Buy a home in the next short while it would be highly beneficial for you to connect with one of our Team Agents at

The Riz Team

Do you want to know what your home is worth today? Click Below for our Online No Obligation Market EvaluationClick HereClick here to see what your home is worth in today's market!!!

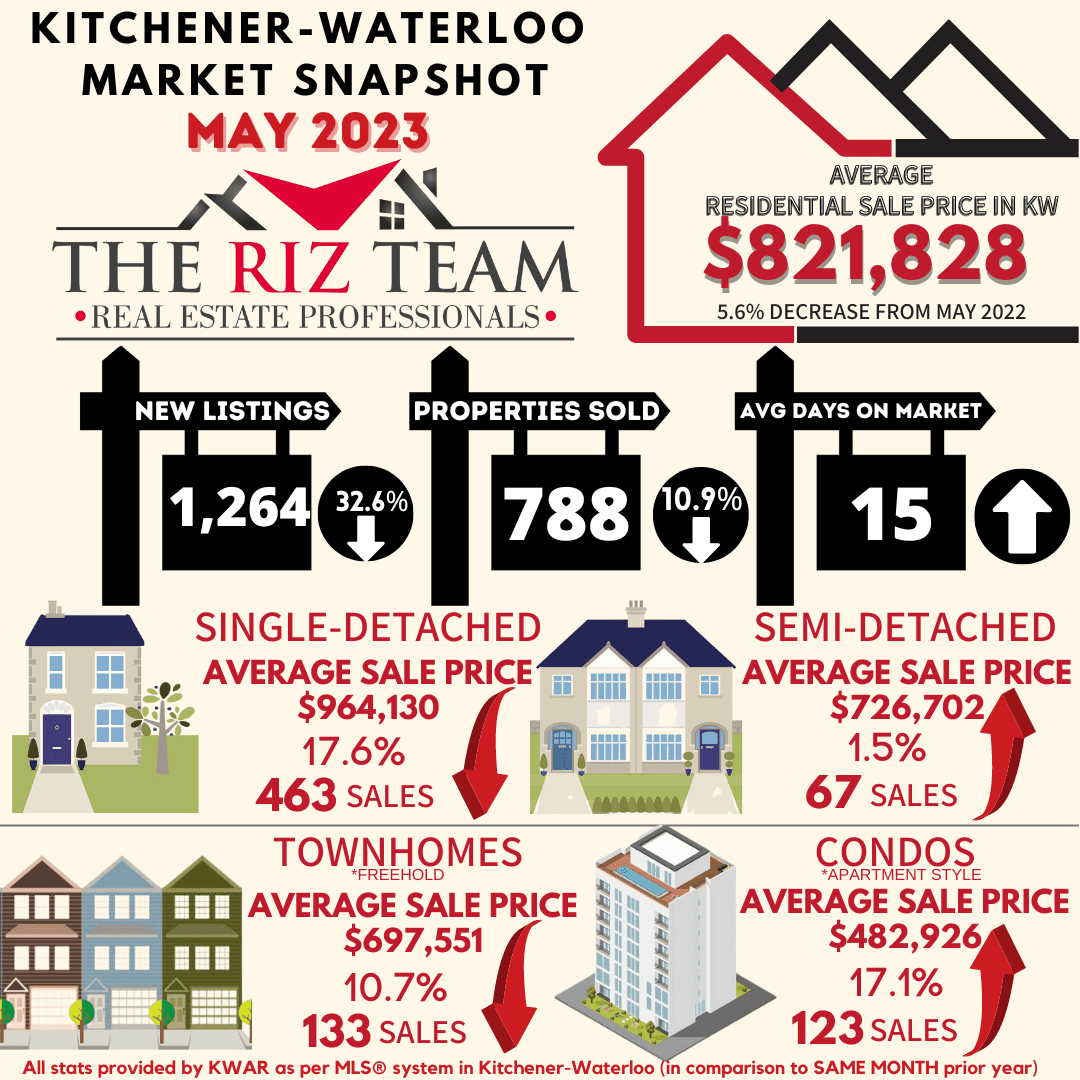
WATERLOO REGION, ON (June 2, 2023) — In May there were 788 homes sold through the Multiple Listing Service® (MLS®) System of the Waterloo Region Association of REALTORS® (WRAR), representing a decrease of 10.9 per cent compared to the previous year and a decline of 12.6 per cent compared to the previous 5-year average for the month.

“The spring market is in full swing with robust buyer and listing activity observed in May,” says Megan Bell, president of WRAR. “It’s encouraging to witness a significant uptick in listing activity compared to April, and we remain optimistic that this positive momentum will carry into June. However, it’s worth noting that the number of listings being added to the MLS® System continues to be historically low.”

Total residential sales in May included 463 detached (down 17.6 per cent from May 2022), and 133 townhouses (down 10.7 percent). Sales also included 123 condominium units (up 17.1 per cent) and 67 semi-detached homes (up 1.5 per cent).

In May, the average sale price for all residential properties in Waterloo Region was $821,828 This represents a 5.6  per cent decrease compared to May 2022 and a 3.1 per cent increase compared to April 2023.

  • The average price of a detached home was $964,130. This represents a 2.8 per cent decrease from May 2022 and an increase of 4.2 per cent compared to April 2023.
  • The average sale price for a townhouse was $697,551. This represents a 2.4 per cent decrease from May 2022 and an increase of 5.0 per cent compared to April 2023.
  • The average sale price for an apartment-style condominium was $482,926. This represents a decrease of 11.8 per cent from May 2022 and a decrease of 1.4 per cent compared to April 2023.
  • The average sale price for a semi was $726,702. This represents an increase of 1.1 per cent compared to May 2022 and an increase of 5.8 per cent compared to April 2023.

WRAR cautions that average sale price information can be useful in establishing long-term trends but should not be used as an indicator that specific properties have increased or decreased in value. The MLS® Home Price Index (HPI) provides the best way to gauge price trends because averages are strongly distorted by changes in the mix of sales activity from one month to the next.

may average sales price by property type

MLS® Home Price Index Benchmark Price

Kitchener-Waterloo Cambridge
Benchmark Type: May 2023 Monthly % Change Yr./Yr. % Change May 2023 Monthly % Change Yr./Yr. % Change
Composite $777,500 2.4 -7.7 $791,000 4.2 -5.5
Detached $887,800 2.5 -5.4 $831,100 4.7 -3.1
Townhouse $634,300 2.7 -13.9 $652,200 1.6 -17.5
Apartment $487,600 2.3 -8.9 $480,700 0.1 -17.8


May 2023 HPI Image for Stats Release

“Waterloo Region properties remain in high demand, driven by our diverse economy and the desirability of our community, we continue to be in a seller’s market,” says Bell. “With limited inventory and a relatively low number of new listings being added to the MLS® system, buyers face intensified competition while sellers receive increasingly competitive offers.”

There were 1,264 new listings added to the MLS® System in Waterloo Region last month, a decrease of 32.6 per cent compared to May of last year and an 11.8 per cent decrease compared to the previous ten-year average for May.

The total number of homes available for sale in active status at the end of May was 900, a decrease of 24.9 per cent compared to May of last year and 41.0 per cent below the previous ten-year average of 1524 listings for May.

The number of months of inventory is up 13.3 per cent compared to May of last year, but still historically low at 1.7 months. The number of months of inventory represents how long it would take to sell off current inventories at the current sales rate.

The average number of days to sell in May was 15, compared to 11 days in May 2022. The previous 5-year average is 16 days.

View our HPI tool here to learn more: https://wrar.ca/hpi/

Click on any of the graphs below for an interactive view.

Average Sales price by municipality
average sales price by township
monthly sales by property type
monthly supply of homes for sale
monthly median sales price by property type
monthly average sales price by property type
monthly average days on market


Kitchener Waterloo Market Snapshot April 2023

Thursday, May 4th, 2023

Demand Remains Strong as Home Prices Increase Month-Over-Month

If you are considering to Sell your home or Buy a home in the next short while it would be highly beneficial for you to connect with one of our Team Agents at

The Riz Team

Do you want to know what your home is worth today? Click Below for our Online No Obligation Market EvaluationClick Here

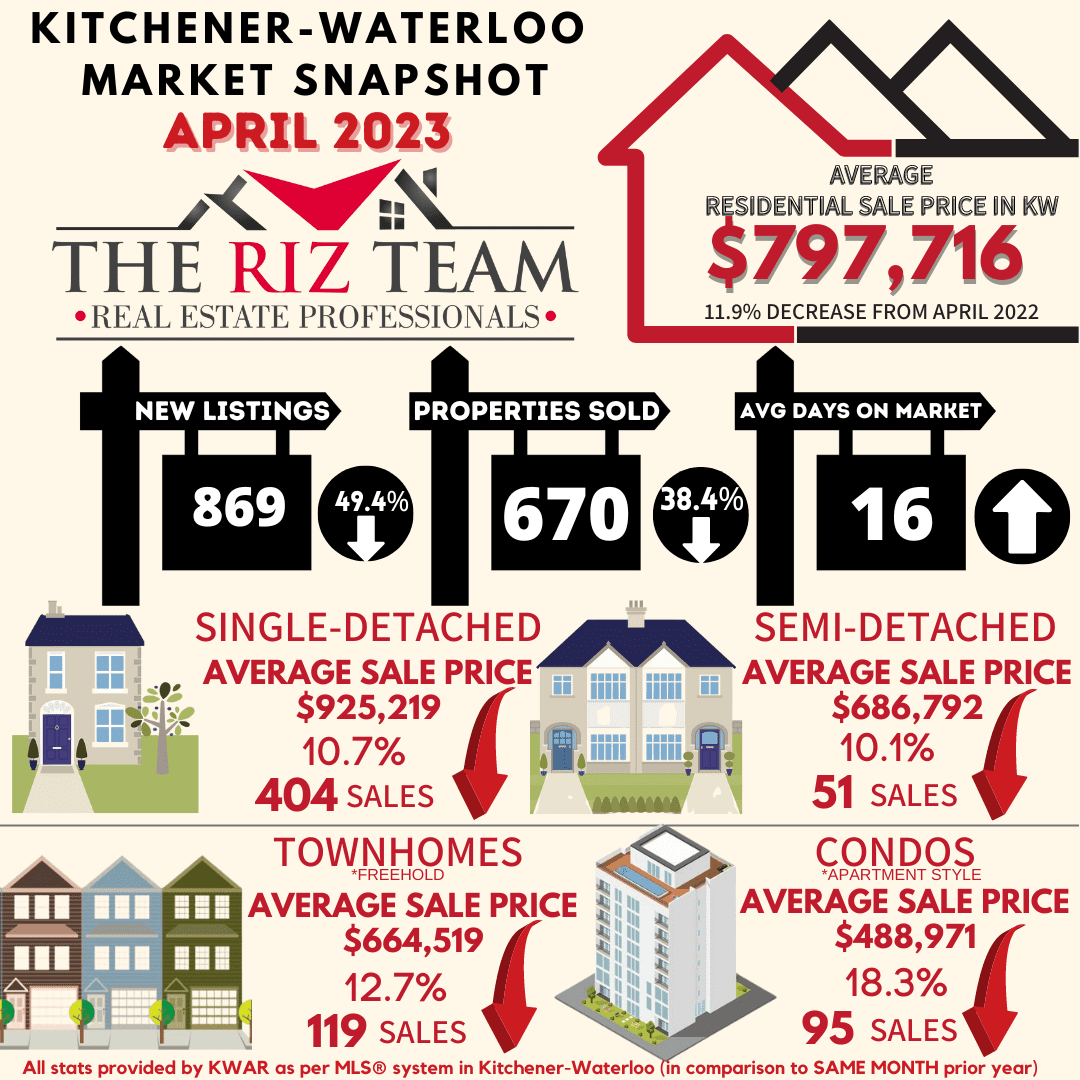
WATERLOO REGION, ON (May 4, 2023) — Sales volume through the Multiple Listing Service® (MLS®) System of the Waterloo Region Association of REALTORS® (WRAR) remained subdued last month, with 670 homes sold in April, representing a decrease of 22.0 per cent compared to April 2022 and 18.0 percent below the previous 5-year average for the month.

“The local spring market is off to a slower than usual start with half the number of new listings hitting the market than this time last year,” says Megan Bell, president of WRAR. “However, with demand continuing to outstrip supply, we saw prices increase on a month-over-month basis as total sales volume continues to waver well below historical figures for the month of April.”

Total residential sales in April included 404 detached (down 22.8 per cent from April 2022), and 119 townhouses (down 20.7 per cent). Sales also included 95 condominium units (down 18.1 per cent) and 51 semi-detached homes (down 25.0 per cent).

In April, the average sale price for all residential properties in Waterloo Region was $797,716. This represents an 11.9 per cent decrease compared to April 2022 and a 2.6 per cent increase compared to March 2023.

  • The average price of a detached home was $925,219. This represents a 10.7 per cent decrease from April 2022 and an increase of 1.7 per cent compared to March 2023.
  • The average sale price for a townhouse was $664,519. This represents a 12.7 per cent decrease from April 2022 and an increase of 3.9 per cent compared to March 2023.
  • The average sale price for an apartment-style condominium was $488,971. This represents a decrease of 18.3 per cent from April 2022 and an increase of 1.5 per cent compared to March 2023.
  • The average sale price for a semi was $686,792. This represents a decrease of 10.1 per cent compared to April 2022 and a decrease of 1.9 per cent compared to March 2023.

WRAR cautions that average sale price information can be useful in establishing long-term trends but should not be used as an indicator that specific properties have increased or decreased in value. The MLS® Home Price Index (HPI) provides the best way to gauge price trends because averages are strongly distorted by changes in the mix of sales activity from one month to the next.

WR April 2023 Price Chart

MLS® Home Price Index Benchmark Price

Kitchener-Waterloo Cambridge
Benchmark Type: April 2023 Monthly % Change Yr./Yr. % Change April 2023 Monthly % Change Yr./Yr. % Change
Composite $759,600 2.7 -14.7 $774,500 3.8 -12.8
Detached $865,100 3.0 -13.0 $809,300 4.3 -12.0
Townhouse $611,600 1.9 -20.3 $647,000 0.8 -17.1
Apartment $484,900 2.3 -13.4 $491,900 1.8 -16.0


April 2023 HPI Image for Stats Release


“Waterloo Region remains a sellers’ market, and while prices have fallen in comparison to last year, we anticipate that home prices will continue to increase steadily,” says Bell. “Some stability in mortgage rates has brought about a return of buyer activity as we begin to observe a return of multiple offer scenarios, bidding wars, and a decrease in the number of days properties take to sell.”

There were 869 new listings added to the MLS® System in Waterloo Region last month, a decrease of 49.4 per cent compared to April of last year and a 33.2 per cent decrease compared to the previous ten-year average for April.

The total number of homes available for sale in active status at the end of April was 703, a decrease of 25.9 per cent compared to April of last year and 49.7 per cent below the previous ten-year average of 1397 listings for April.

The number of months of inventory is up 8.3 per cent compared to April of last year, but still historically low at 1.3 months. The number of months of inventory represents how long it would take to sell off current inventories at the current sales rate.

The average number of days to sell in April was 16, compared to 9 days in April 2022. The previous 5-year average is 16 days.

View our HPI tool here to learn more: https://wrar.ca/hpi/

Click on any of the graphs below for an interactive view.

Average Sales Price Municipalities
Average Sales Price Townships
Monthly Sales by Property Type
Monthly Supply of Homes for Sale
Median Sales Price by Property Type
Average Sales Price by Property Type
Monthly Average Days on Market

WRAR cautions that average sale price information can help identify long-term trends but should not be to indicate that specific properties have increased or decreased in value. The average sale price is calculated based on the total dollar volume of all properties sold. Months Supply is the inventory of homes for sale at the end of a given month, divided by the average monthly closed sales from the last 12 months. Those requiring specific information on property values should contact a Waterloo Region REALTOR®. REALTORS® have their fingers on the pulse of the market. They know the questions to ask, the areas to probe and what to look for so that you get a complete picture of the property and community you’re considering.

Kitchener-Waterloo Market Snapshot December 2021

Wednesday, January 5th, 2022

Average Price of a Detached Home Reaches Million-dollar Milestone in December

HOME SALES IN 2021 SMASHED LAST YEAR’S RECORD-BREAKING TOTAL BY OVER 1000 UNITS

The 7,581 residential homes sold through the Multiple Listing System (MLS® System) of the Kitchener-Waterloo Association of REALTORS® (KWAR) in 2021 represent an increase of 18.3 per cent compared to last year’s record-setting number of sales that ended the year 2020.

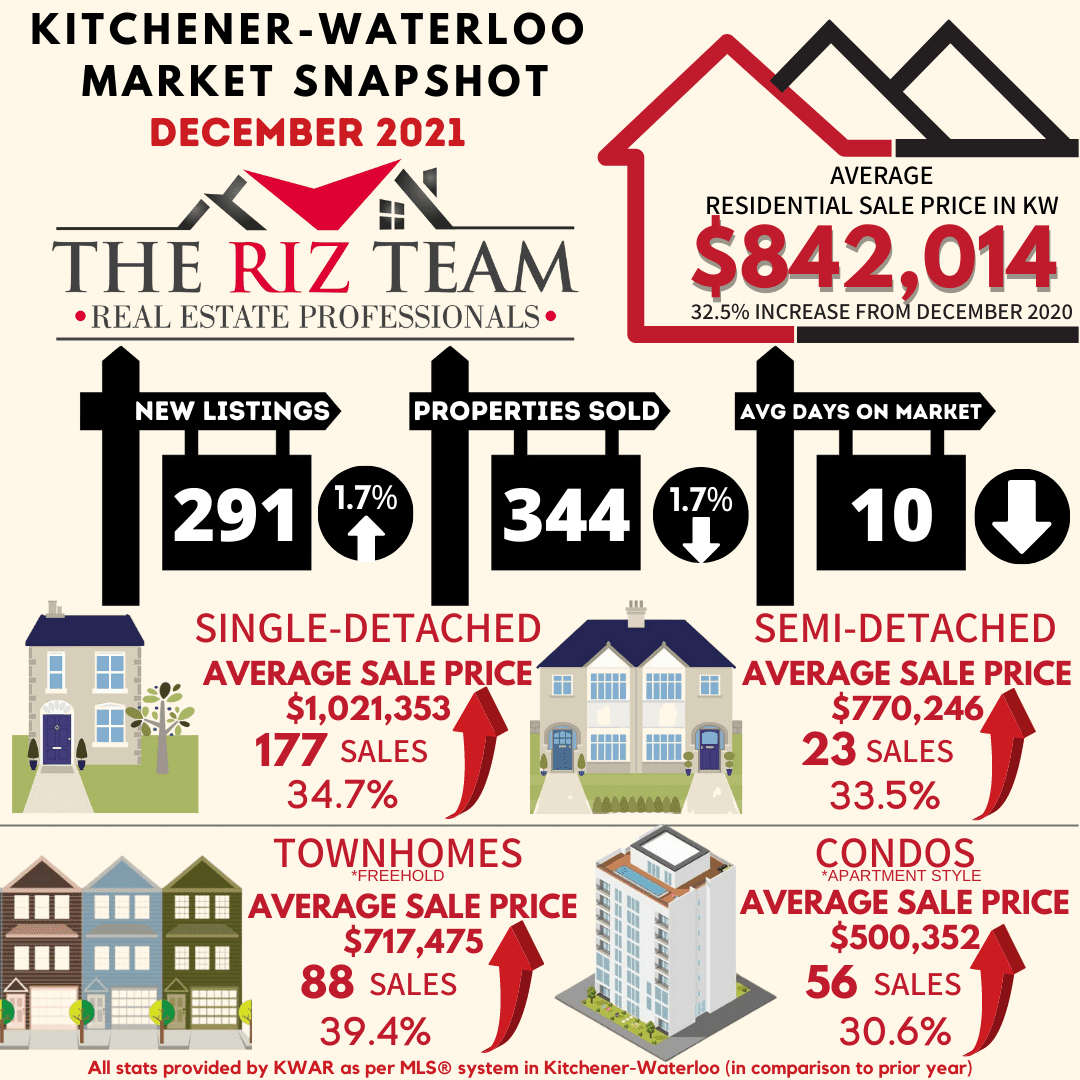
On a monthly basis, there were 344 residential homes sold last month, a decrease of 1.7 percent compared to the same month last year.

“Home sales in 2021 have absolutely smashed last year’s record by more than 1,000 units,” says KWAR’s president, Megan Bell. “While this is a good time to sell your home, it remains a tremendously difficult market for buyers. Affordability for all types of housing within our community continues to be a concern which we expect to continue throughout 2022.”

Total residential sales in December included 177 detached (down 12.4 per cent from December 2020), and 56 condominium units (down 11.1 per cent). Sales also included 23 semi-detached homes (up 9.5 per cent) and 88 townhouses (up 37.5 per cent).

For 2021, total residential sales included 4,272 detached (up 10.8 per cent), and 1,127 condominium units (up 43.4 per cent). Sales also included 578 semi-detached homes (up 31.1 per cent) and 1,602 townhouses (up 20.9 per cent).

In December, the average sale price for all residential properties in the Kitchener-Waterloo area was $842,014. This represents a 32.5 per cent increase over December 2020 and a 2.5 per cent increase compared to November 2021.

  • The average price of a detached home was $1,021,353. This represents a 34.7 per cent increase from December 2020 and an increase of 3.4 per cent compared to November 2021.
  • The average sale price for an apartment-style condominium was $500,352. This represents an increase of 30.6 per cent from December 2020 and an increase of 1.0 per cent compared to November 2021.
  • The average sale price for a townhouse was $717,475. This represents a 39.4 per cent increase from December 2020 and an increase of 2.1 per cent compared to November 2021.
  • The average sale price for a semi was $770,246. This represents an increase of 33.5 per cent compared to December 2020 and an increase 7.3 per cent compared to November 2021.

On a year-to-date basis, the average sale price for all residential properties in the Kitchener-Waterloo area increased 25.8 per cent to $770,596 compared to 2020.

  • The year-to-date average price of a detached home was $920,726. This represents a 28.0 per cent increase compared to 2020.
  • The year-to-date average sale price for an apartment-style condominium was $448,208. This represents an increase of 17.3 compared to 2020
  • The year-to-date average sale price for a townhouse was $632,875. This represents an increase of 34.9 per cent compared to 2020.
  • The year-to-date average sale price for a semi was $673,543. This represents an increase of 29.4 per cent compared to 2020.

KWAR cautions that average sale price information can be useful in establishing long-term trends but should not be used as an indicator that specific properties have increased or decreased in value. The MLS® Home Price Index (HPI) provides the best way to gauge price trends because averages are strongly distorted by changes in the mix of sales activity from one month to the next.

The MLS® HPI composite benchmark price for all residential properties in Kitchener-Waterloo was $851,700 in December. This represents a 32.1 per cent increase over December 2020 and a 3.2 per cent increase compared to November 2021.

  • The benchmark price for a detached home was $945,600. This represents a 33.5 per cent increase from December 2020 and 3.3 per cent increase compared to November 2021.
  • The benchmark price for an apartment-style condominium was $412,700. This represents a 21.1 per cent increase from December 2020 and a 3.7 per cent increase compared to November 2021.
  • The benchmark price for a townhouse is $647,000. This represents a 40.0 per cent increase from December 2020 and a 3.0 per cent increase compared to November 2021.

There were 291 new listings added to the MLS® System in KW and area last month, an increase of 1.7 per cent compared to December of last year, and a 14.6 per cent increase compared to the previous ten-year average for December.

On a year-to-date basis, there were 9,040 new listings added to the MLS® System in KW and area in 2021, an increase of 11.5 per cent compared to 2020, and a 3.8 per cent increase compared to the previous ten-year annual average.

The total number of homes available for sale in active status at the end of December was 104, a decrease of 45.3 per cent compared to December of last year, and 85.7 per cent below the previous ten-year average of 727 listings for December.

The number of months of inventory touched an all time low of 0.2 in December. Inventory has settled at under 1 month for fourteen consecutive months. The number of months of inventory represents how long it would take to sell off current inventories at the current rate of sales.

“Supply not keeping up with demand was a steady refrain in 2021, and unfortunately I expect that will continue to be the case in the year ahead,” says Bell. “We need all levels of government working together to bring more supply into the housing market.”

The average number of days to sell in December stayed at 10 days, compared to 16 days in December 2020 and a previous 5-year average of 28 days.

The average days to sell in 2021 was 10 days, compared to 16 days in 2020 and a previous 5-year average of 22 days.

Those requiring specific information on property values should contact a local REALTOR®.  Working with a Realtor is the best way to get a complete picture of the property and community you are considering.

View our HPI tool here to learn more: https://kwar.ca/hpi-dashboard

Historical Sales By Property Type


Months Supply of Homes for Sale


Historical Median Sales Price – By Property Type

Historical Average Sales Price – By Property Type

Average Days on Market

KWAR cautions that average sale price information can be useful in establishing long term trends but should not be used as an indicator that specific properties have increased or decreased in value. The average sale price is calculated based on the total dollar volume of all properties sold. Months Supply is the inventory of homes for sale at the end of a given month, divided by the average monthly closed sales from the last 12 months Those requiring specific information on property values should contact a local REALTOR®. REALTORS® have their fingers on the pulse of the market. They know the questions to ask, the areas to probe and what to look for so that you get a complete picture of the property and community you’re considering.

Kitchener-Waterloo Market Snapshot November 2021

Friday, December 3rd, 2021

A NEW RECORD HIGH FOR NUMBER OF HOME SALES IN NOVEMBER AND AN ALL-TIME RECORD LOW SUPPLY READING

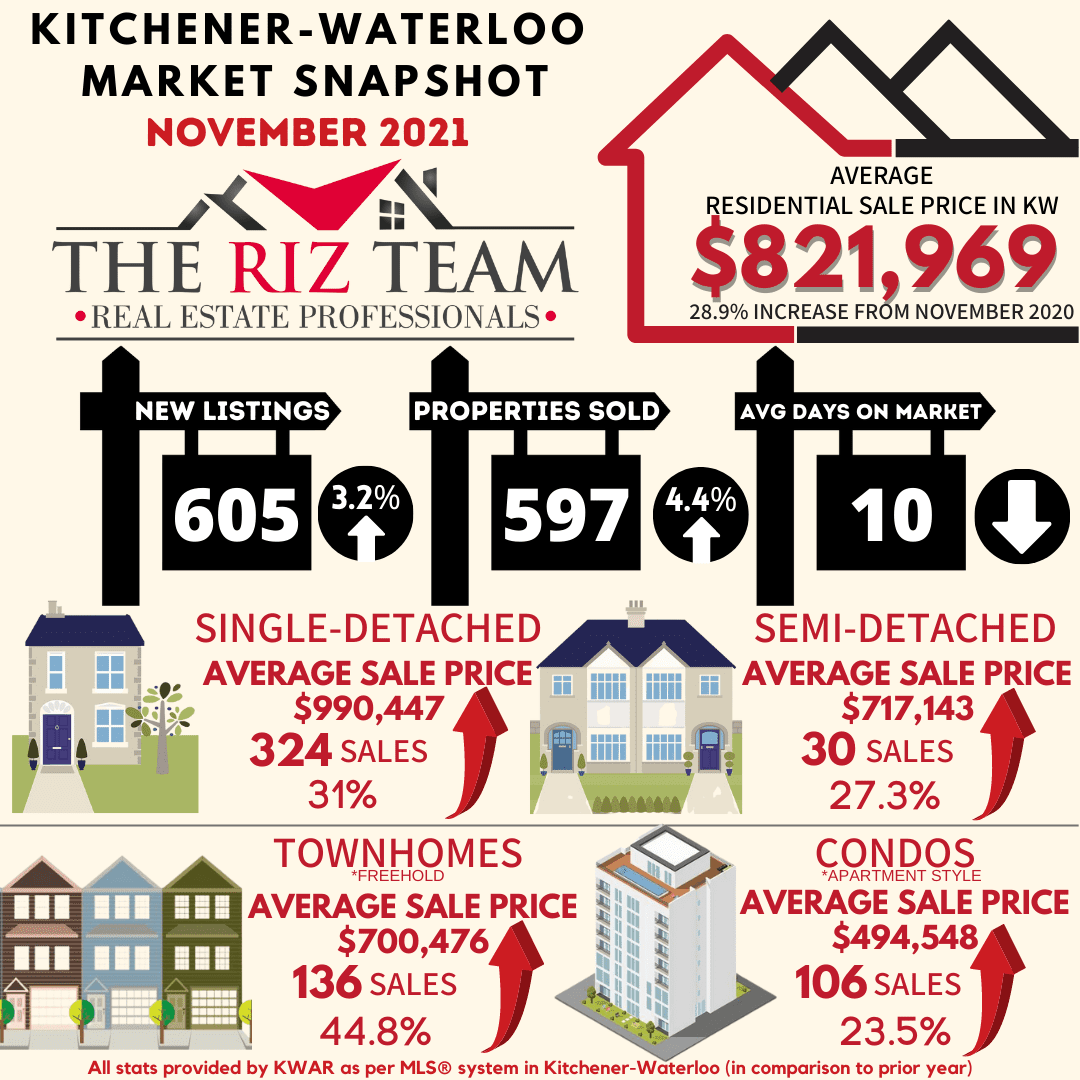
KITCHENER-WATERLOO, ON (December 3, 2021) –– There were 597 residential homes sold last month through the Multiple Listing Service® (MLS® System) of the Kitchener-Waterloo Association of REALTORS® (KWAR) setting a new record high for November. Compared to the same month last year, November sales were up 4.4% and on par with last month. The previous ten-year average number of residential sales for November is 446.

“The elevated pace of home sales we’ve seen for the past year and a half showed no sign of slowing down in November,” says KWAR’s president, Megan Bell. “Despite some speculation of there being a housing market correction in store for Waterloo Region, sustained homebuying demand combined with a record low level of inventory in November produced continued price growth in the MLS® HPI benchmark price.”

Total residential sales in November included 324 detached (down 3.9 per cent from November 2020), and 106 condominium units (up 27.7 per cent). Sales also included 30 semi-detached homes (down 25 per cent) and 136 townhouses (up 21.4 per cent).

In November, the average sale price for all residential properties in the Kitchener-Waterloo area was $821,969. This represents a 28.9 per cent increase over November 2020 and a 2 per cent decrease compared to October 2021.

  • The average price of a detached home was $990,447. This represents a 31 per cent increase from November 2020 and a decrease of 0.6 per cent compared to October 2021.
  • The average sale price for an apartment-style condominium was $494,548. This represents an increase of 23.5 per cent from November 2020 and an increase of 7.1 per cent compared to October 2021.
  • The average sale price for a townhouse was $700,476. This represents a 44.8 per cent increase from November 2020 and an increase of 0.9 per cent compared to October 2021.
  • The average sale price for a semi was $717,143. This represents an increase of 27.3 per cent compared to November 2020 and a decrease of 1.3 per cent compared to October 2021.

KWAR cautions that average sale price information can be useful in establishing long-term trends but should not be used as an indicator that specific properties have increased or decreased in value. The MLS® Home Price Index (HPI) provides the best way to gauge price trends because averages are strongly distorted by changes in the mix of sales activity from one month to the next.

The MLS® HPI composite benchmark price for all residential properties in Kitchener-Waterloo was $825,000 in November. This represents a 34.1 per cent increase over November 2020 and a 2.6 per cent increase compared to October 2021.

  • The benchmark price for a detached home was $915,800. This represents a 35.8 per cent increase from November 2020 and 3.2 per cent increase compared to October 2021.
  • The benchmark price for an apartment-style condominium was $398,000. This represents a 16.7 per cent increase from November 2020 and a 2.1 per cent decrease compared to October 2021.
  • The benchmark price for a townhouse is $627,900. This represents a 45.5 per cent increase from November 2020 and a 4.0 per cent increase compared to October 2021.

“Lack of supply continues to be the refrain in November,” says Bell. “With inventory hitting an all time low it is a tough time to be house hunting right now.”

There were 605 new listings added to the MLS® System in KW and area last month, an increase of 3.2 per cent compared to November of last year, and a 14.6 per cent decrease compared to the previous ten-year average for November.

The total number of homes available for sale in active status at the end of November was 207, a decrease of 40.2 per cent compared to November of last year, and 80.7 per cent below the previous ten-year average of 1,071 listings for November.

The number of months of inventory reached an all time low of 0.3 in November. Inventory has settled at under 1 month for thirteen consecutive months. The number of months of inventory represents how long it would take to sell off current inventories at the current rate of sales.

The average number of days to sell in November stayed at 10 days, compared to 14 days in November 2020 and a previous 5-year average of 24 days.

Bell notes that while the housing market typically slows down around the holiday season, she still expects to see a busier than normal December. “There is growing anxiety out there among buyers caused by the fear of missing out against rumblings of interest rates eventually going up in the year ahead.”

Those requiring specific information on property values should contact a local REALTOR®.  Working with a Realtor is the best way to get a complete picture of the property and community you are considering.

View our HPI tool here to learn more: https://kwar.ca/hpi-dashboard

Historical Sales by Property Type 


Months Supply of Homes for Sale

Historical Median Sales Price – By Property Type

Historical Average Sales Price – By Property Type

Average Days on Market

KWAR cautions that average sale price information can be useful in establishing long term trends but should not be used as an indicator that specific properties have increased or decreased in value. The average sale price is calculated based on the total dollar volume of all properties sold. Months Supply is the inventory of homes for sale at the end of a given month, divided by the average monthly closed sales from the last 12 months Those requiring specific information on property values should contact a local REALTOR®. REALTORS® have their fingers on the pulse of the market. They know the questions to ask, the areas to probe and what to look for so that you get a complete picture of the property and community you’re considering.

Kitchener-Waterloo Market Snapshot July 2021

Thursday, August 5th, 2021


VERY LOW INVENTORY COMBINED WITH STRONG DEMAND KEEPS HOME PRICES HUMMING IN JULY

“Although home sales slowed down to some degree in July compared to June, overall demand remains very strong,” says Nicole Pohl, President of KWAR. “The current inventory of homes available for sale in the Kitchener-Waterloo and area is extremely low, making Waterloo Region one of the most competitive markets in Ontario.”

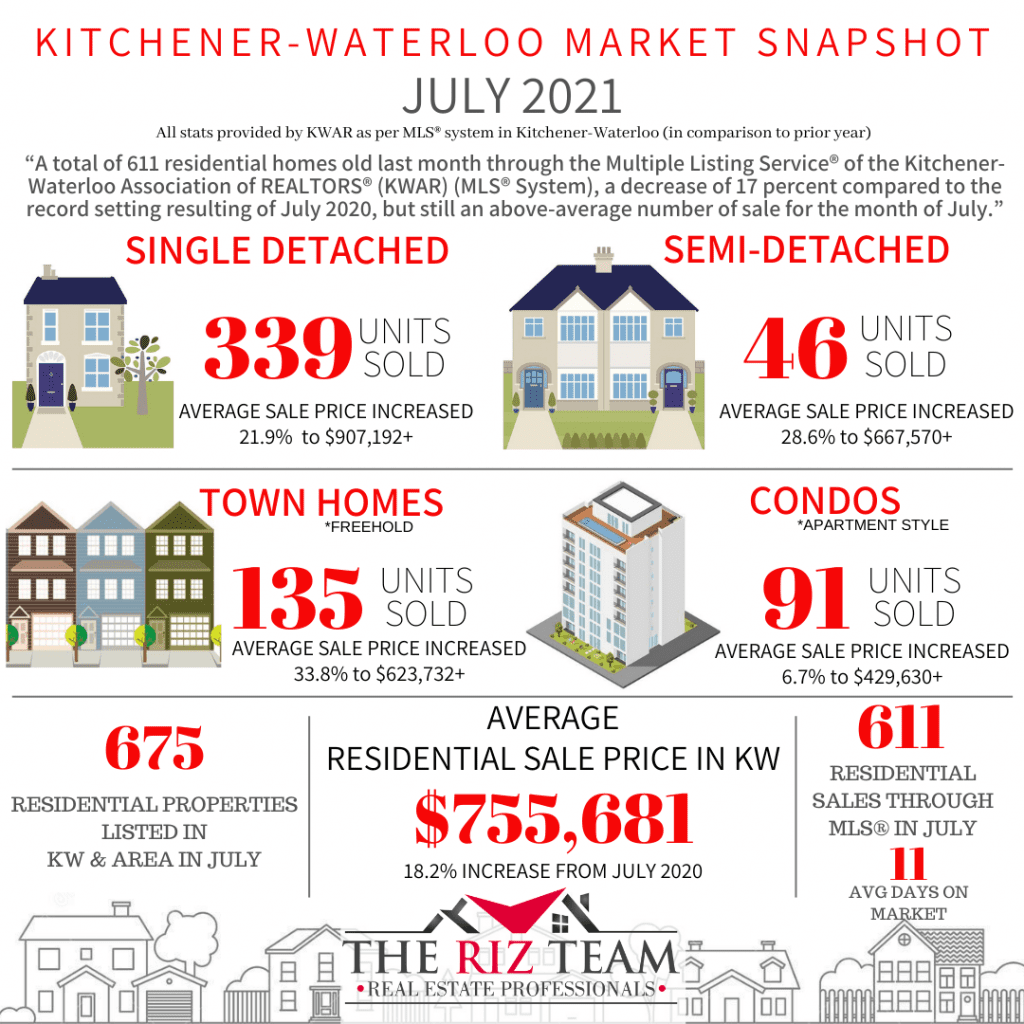
Total residential sales in July included 339 detached (down 27.1 per cent from July 2020), and 91 condominium units (up 30 per cent). Sales also included 46 semi-detached homes (down 4.2) and 135 townhouses (down 11.8 per cent).

In July, the average sale price for all residential properties in the Kitchener-Waterloo area was $755,681. This represents a 18.2 per cent increase over July 2020 and a 0.6 per cent decrease compared to June 2021.

      • The average price of a detached home was $907,192. This represents a 21.9 per cent increase from July 2020 and a decrease of 1.4 per cent compared to June 2021.
      • The average sale price for an apartment-style condominium was $429,630. This represents an increase of 6.7 per cent from July 2020 and a decrease of 3.6 per cent compared to June 2021.
      • The average sale price for a townhouse was $623,732. This represents a 33.8 per cent increase from July 2020 and an increase of 5.4 per cent compared to June 2021.
      • The average sale price for a semi was $667,570. This represents an increase of 28.6 per cent compared to July 2020 and an increase of 2.9 per cent compared to June 2021.

KWAR cautions that average sale price information can be useful in establishing long-term trends but should not be used as an indicator that specific properties have increased or decreased in value. The MLS® Home Price Index (HPI) provides the best way to gauge price trends because averages are strongly distorted by changes in the mix of sales activity from one month to the next.

The MLS® HPI composite benchmark price for all residential properties in Kitchener-Waterloo was $748,700 in July. This represents a 30.5 per cent increase over July 2020 and a 0.4 per cent increase compared to June 2021.

  • The benchmark price for a detached home was $822,300. This represents a 31.1 per cent increase from July 2020 and 0.2 per cent increase compared to June 2021.
  • The benchmark price for an apartment-style condominium was $385,900. This represents a 19.5 per cent increase from July 2020 and a 3.3 per cent increase compared to June 2021.
  • The benchmark price for a townhouse is $564,500. This represents a 40 per cent increase from July 2020 and a 0.4 per cent decrease compared to June 2021.

“The housing market took a bit of a breather last month,” notes Pohl. “July is typically a quieter month with families taking vacation, and with the region coming out of lockdown there were certainly more staycations happening.  But we do anticipate the market will pick up steam again and it will be another busy fall.”

There were 675 new listings added to the MLS® System in KW and area last month, a decrease of 24 per cent compared to July of last year, and a 14.4 per cent decrease compared to the previous ten-year average for July.

The total number of homes available for sale in active status at the end of July was 281, a decrease of 52.7 per cent compared to July of last year, and 79.1 per cent below the previous ten-year average of 1,346 listings for July.

The number of months of inventory was 0.4 in July, a decline from 0.5 months in June. Inventory has numbered less than 1 month since October. The number of months of inventory represents how long it would take to sell off current inventories at the current rate of sales.

The average number of days to sell in July was 11 days, compared to 17 days in July 2020 and a previous 5-year average of 22 days.

Those requiring specific information on property values should contact a local REALTOR®.  Working with a Realtor is the best way to get a complete picture of the property and community you are considering.

View our HPI tool here to learn more: https://kwar.ca/hpi-dashboard

Historical Sales By Property Type

Months Supply of Homes for Sale

Historical Median Sales Price – By Property Type

Historical Average Sales Price – By Property Type

Average Days on Market

KWAR cautions that average sale price information can be useful in establishing long-term trends but should not be used as an indicator that specific properties have increased or decreased in value. The average sale price is calculated based on the total dollar volume of all properties sold. Months Supply is the inventory of homes for sale at the end of a given month, divided by the average monthly closed sales from the last 12 months Those requiring specific information on property values should contact a local REALTOR®. REALTORS® have their fingers on the pulse of the market. They know the questions to ask, the areas to probe and what to look for so that you get a complete picture of the property and community you’re considering.

Kitchener-Waterloo Market Snapshot June 2021

Tuesday, July 6th, 2021

Number of Home Sales Set New June Record

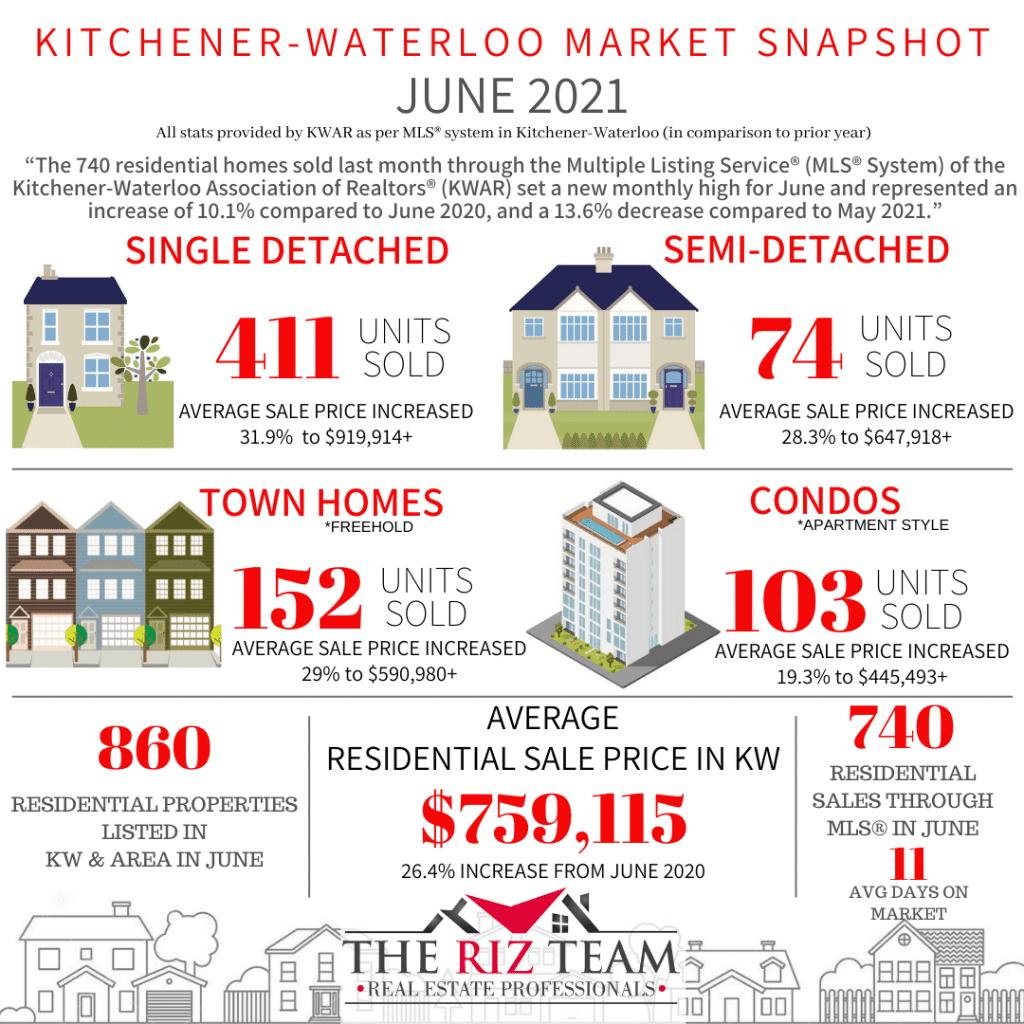
KITCHENER-WATERLOO, ON (July 6, 2021) –– The 740 residential homes sold last month through the Multiple Listing Service® (MLS® System) of the Kitchener-Waterloo Association of REALTORS® (KWAR) set a new monthly high for June and represented an increase of 10.1 per cent compared to June 2020, and a 13.6 per cent decrease compared to May 2021.

“The number of homes sold in the Kitchener-Waterloo area these past 6 months surpasses any previous 6 months of activity through our MLS® System,” says Nicole Pohl, President of KWAR. “Since the beginning of the year, we have reported 4,393 home sales in Kitchener-Waterloo and area, which is remarkable.”

Total residential sales during this second quarter (April, May, June) are up 83.7 per cent compared to last year. On a year-to-date basis, they are up 65.7 per cent.

Total residential sales in June included 411 detached (down 0.2 per cent from June 2020), and 103 condominium units (up 51.5 per cent). Sales also included 74 semi-detached homes (on par) and 152 townhouses (up 14.3 per cent).

In June, the average sale price for all residential properties in the Kitchener-Waterloo area was $759,115. This represents a 26.4 per cent increase over June 2020 and a 2.6 per cent increase compared to May 2021.

      • The average price of a detached home was $919,914. This represents a 31.9 per cent increase from June 2020 and an increase of 5.9 per cent compared to May 2021.
      • The average sale price for an apartment-style condominium was $445,493. This represents an increase of 19.3 per cent from June 2020 and a decrease of 2.3 per cent compared to May 2021.
      • The average sale price for a townhouse was $590,980. This represents a 29 per cent increase from June 2020 and a decrease of 1.9 per cent compared to May 2021.
      • The average sale price for a semi was $647,918. This represents an increase of 28.3 per cent compared to June 2020 and a decrease of 1.8 per cent compared to May 2021.

KWAR cautions that average sale price information can be useful in establishing long-term trends but should not be used as an indicator that specific properties have increased or decreased in value. The MLS® Home Price Index (HPI) provides the best way to gauge price trends because averages are strongly distorted by changes in the mix of sales activity from one month to the next.

The MLS® HPI composite benchmark price for all residential properties in Kitchener-Waterloo was $745,800 in June. This represents a 32.1 per cent increase over June 2020 and a 0.4 per cent decrease compared to May 2021.

The benchmark price for a detached home was $820,800. This represents a 32.7 per cent increase from June 2020 and 0.6 per cent increase compared to May 2021.

      • The benchmark price for an apartment-style condominium was $373,400. This represents a 17 per cent increase from June 2020 and a 0.1 per cent decrease compared to May 2021.
      • The benchmark price for a townhouse is $566,900. This represents a 45 per cent increase from June 2020 and a 1.4 per cent decrease compared to May 2021.

“The greatest challenge of the housing market continues to be the limited supply of existing homes to purchase,” says Pohl. “What we could use right now is for more homes to get built to help meet the robust buyer demand which continues to exceed supply.”

There were 860 new listings added to the MLS® System in KW and area last month, a decrease of 6.6 per cent compared to June of last year, and a 5.4 per cent decrease compared to the previous ten-year average for June.

The total number of homes available for sale in active status at the end of June was 365, a decrease of 43 per cent compared to June of last year, and 73.9 per cent below the previous ten-year average of 1,400 listings for June.

The number of months of inventory was 0.5 in June, a decline from 0.7 months in May. Inventory has numbered less than 1 month since October. The number of months of inventory represents how long it would take to sell off current inventories at the current rate of sales.

The average number of days to sell in June was 11 days, compared to 17 days in June 2020 and a previous 5-year average of 20 days.

Those requiring specific information on property values should contact a local REALTOR®.  Working with a Realtor is the best way to get a complete picture of the property and community you are considering.

View our HPI tool here to learn more: https://kwar.ca/hpi-dashboard

Historical Sales By Property Type

Months Supply of Homes for Sale

Historical Median Sales Price – By Property Type

Historical Average Sales Price – By Property Type

Average Days on Market Chart


© Copyright 2017, Real Estate Websites by Redman Technologies Inc. | Privacy Policy | Disclaimer | Sitemap

MLS®, REALTOR®, and the associated logos are trademarks of The Canadian Real Estate Association.

The data included on this website is deemed to be reliable, but is not guaranteed to be accurate by the Kitchener-Waterloo Real Estate Board. The trademarks REALTOR®, REALTORS® and the REALTOR® logo are controlled by The Canadian Real Estate Association (CREA) and identify real estate professionals who are members of CREA. Used under license.