Friday, February 2nd, 2024
Waterloo Region’s Housing Market Shows Signs of Improvement in January
If you are considering to Sell your home or Buy a home in the next short while it would be highly beneficial for you to connect with one of our Team Agents at
Do you want to know what your home is worth today? Click Below for our Online No Obligation Market Evaluation
“We are optimistic that this year will have more stability than last,” says Moura. “With the Bank of Canada holding steady at a 5.0% benchmark interest rate, they recognize the overall economy has slowed down. However, housing is a key metric, and we expect the Bank to maintain a balanced response so long as housing continues with moderate growth in 2024 rather than any dramatic increases.”
President Moura points out that navigating shifting markets is a challenge and encourages consumers to work with a local REALTOR to ensure they receive the depth of local market knowledge required to protect their interests.
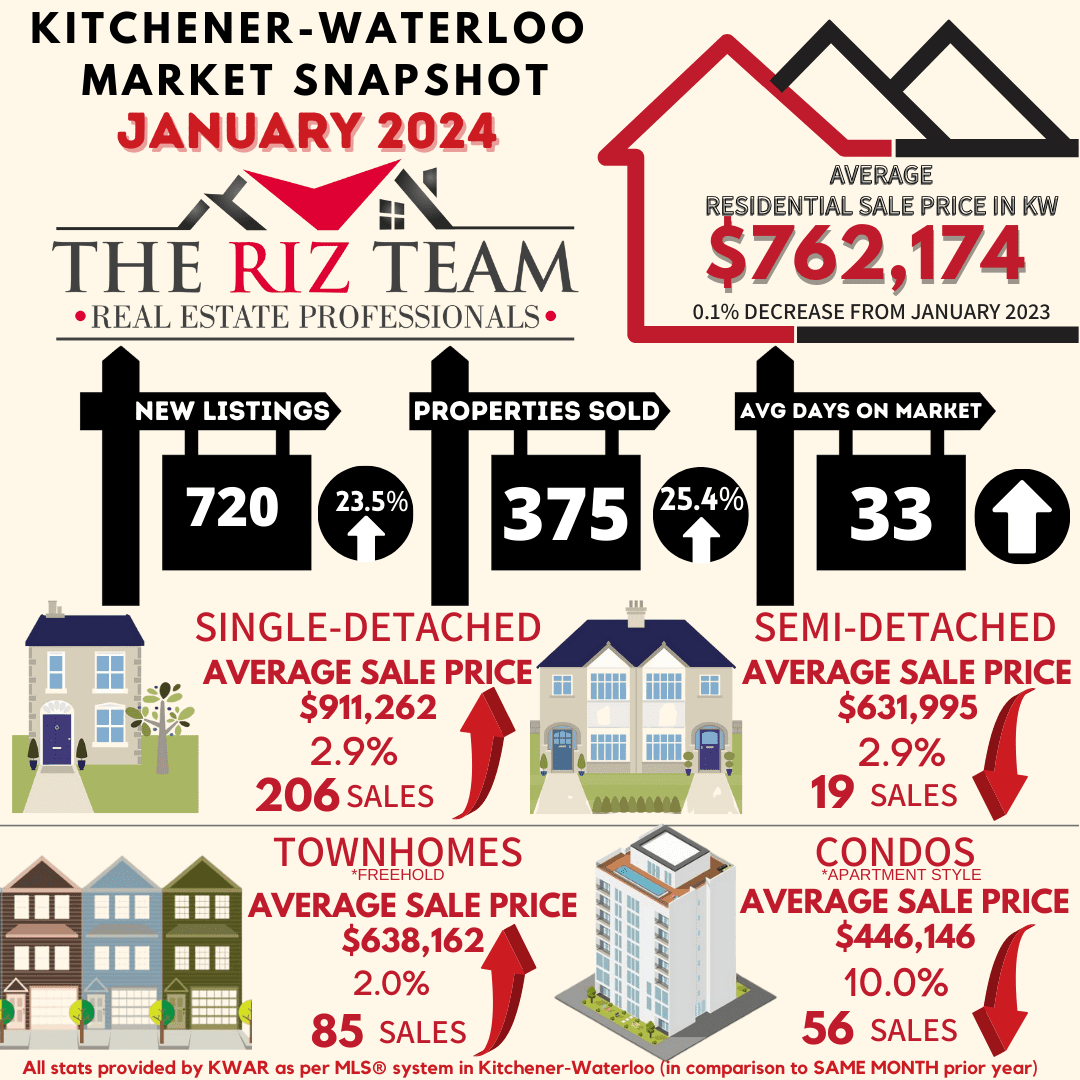
There was 720 new listings added to the MLS® System in Waterloo Region last month, an increase of 23.5 per cent compared to January last year and a 3.9 per cent decrease compared to the previous ten-year average for January.
The total number of homes available for sale in active status at the end of January was 855 an increase of 33.4 per cent compared to January of last year and 1.2 per cent below the previous ten-year average of 865 listings for January.
At the end of January, there were 1.5 months of inventory, a 50.0 percent increase compared to last year and 15.4 percent above the previous 10-year average. The number of months of inventory represents how long it would take to sell off current inventories at the current sales rate.
“With the exception of condo apartment property types, we saw mostly yearly and monthly price gains across the housing types,” says Moura. “This is because there is more supply in the condo segment (2.8 months) compared to the other property types.”
The average number of days to sell in January was 33, compared to 25 days in January 2023. The previous 5-year average is 20 days.
These statistics provide a snapshot of the real estate market in the Waterloo Region in January, showing both positive and challenging aspects for buyers and sellers. WRAR encourages buyers to reach out to local Realtors for valuable insights about the current state of the local market and to receive tailored advice based on their specific needs.
View our HPI tool here to learn more: https://wrar.ca/hpi/
WRAR cautions that average sale price information can help identify long-term trends but should not be to indicate that specific properties have increased or decreased in value. The average sale price is calculated based on the total dollar volume of all properties sold. Months Supply is the inventory of homes for sale at the end of a given month, divided by the average monthly closed sales from the last 12 months. Those requiring specific information on property values should contact a Waterloo Region REALTOR®. REALTORS® have their fingers on the pulse of the market. They know the questions to ask, the areas to probe and what to look for so that you get a complete picture of the property and community you’re considering.
Tags: buyers, for sale, kitchener for sale, kitchener real estate, kitchener-waterloo, kitchener-waterloo association of realtors, real estate market, riz jadavji, Royal Lepage Wolle Realty, sales representative, the riz team, Waterloo Buyers, Waterloo Homes, waterloo real estate, Waterloo Sellers
Posted in Kitchener Buyers, Kitchener Sellers, Market Stats, Market Update, Real Estate News, Realtor Tips, Waterloo Buyers, Waterloo Sellers | Comments Off on Kitchener Waterloo Market Snapshot January 2024


