Waterloo Region Housing Market Ends 2025 with Rising Inventory and Declining Sales…
“In Waterloo Region, we observed an increase in new listings coming onto the market in 2025, accompanied by softening sales and longer selling times. This trend occurred during a year when affordability remained a challenge for many aspiring homebuyers, as global and economic uncertainty contributed to a weaker housing market. With the downward pressure on housing prices, and more options for buyers, it proved to be a good year for those first-time buyers who were able to get into the market,” says Christal Moura, spokesperson for the Waterloo Region Market.
“As we look ahead to 2026, we anticipate a more stable market, particularly with the introduction of new government incentives. Both the provincial and federal governments have announced plans to remove the Harmonized Sales Tax (HST) from new homes up to $1 million for first-time buyers. This initiative should make homes more affordable and help boost the housing market, however, we would like to see this policy expanded to all homebuyers, to make an even greater impact,” says Moura.
If you are considering to SELL your home or BUY a home in the next short while,
it would be highly beneficial for you to connect with one of our Team Agents at
Do you want to know what your home is worth today? Click Below for our Online No Obligation Market Evaluation:


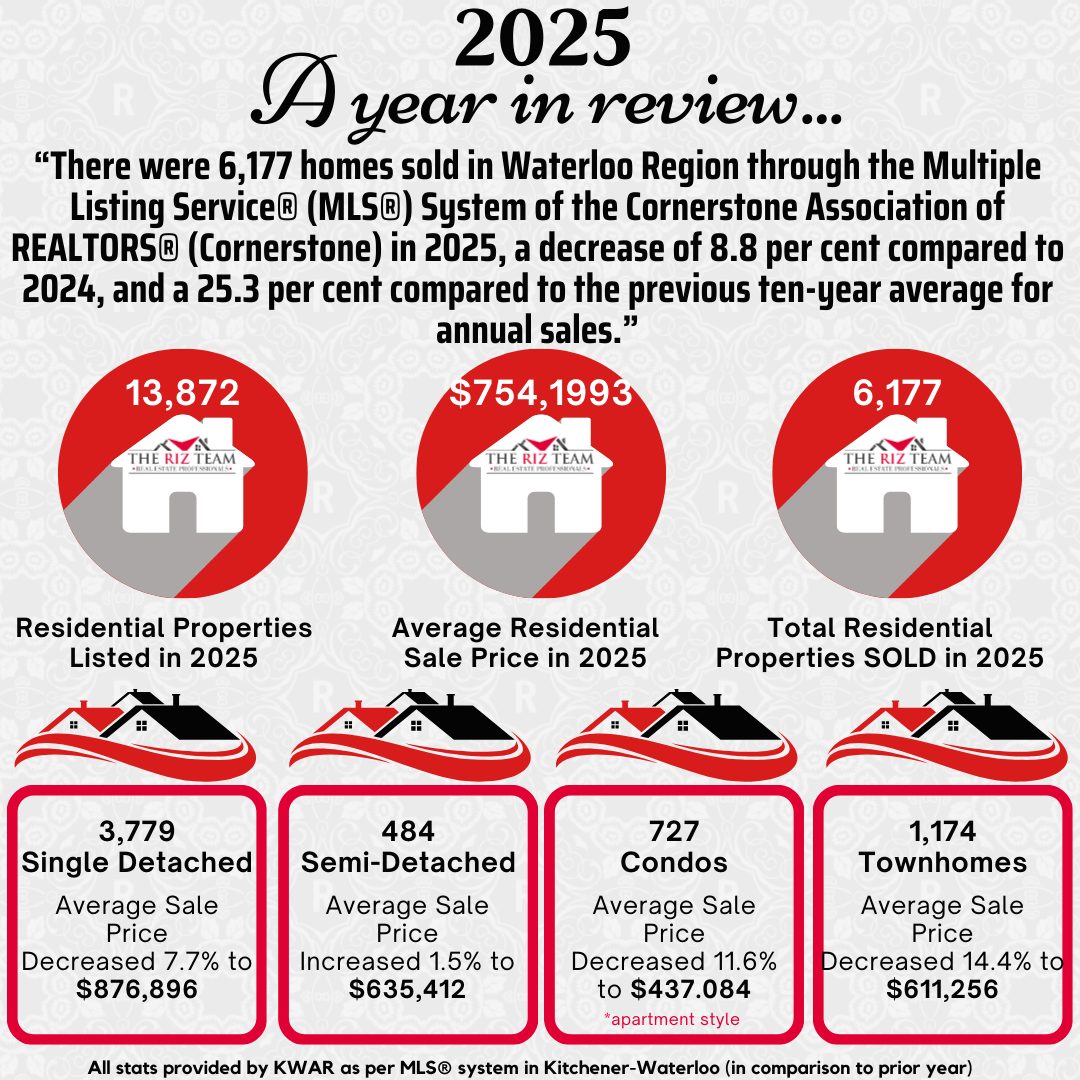
WATERLOO REGION, ON (January 7, 2026) —There were 6,177 homes sold in Waterloo Region through the Multiple Listing Service® (MLS®) System of the Cornerstone Association of REALTORS® (Cornerstone) in 2025, a decrease of 8.8 per cent compared to 2024, and a 25.3 per cent compared to the previous ten-year average for annual sales.
On a monthly basis, 306 homes were sold in December, a decrease of 9.5 per cent compared to the same period last year and a decrease of nearly 19.5 per cent compared to the average number of homes sold in the previous ten years for the same month.
“In Waterloo Region, we observed an increase in new listings coming onto the market in 2025, accompanied by softening sales and longer selling times. This trend occurred during a year when affordability remained a challenge for many aspiring homebuyers, as global and economic uncertainty contributed to a weaker housing market. With the downward pressure on housing prices, and more options for buyers, it proved to be a good year for those first-time buyers who were able to get into the market,” says Christal Moura, spokesperson for the Waterloo Region Market.
“As we look ahead to 2026, we anticipate a more stable market, particularly with the introduction of new government incentives. Both the provincial and federal governments have announced plans to remove the Harmonized Sales Tax (HST) from new homes up to $1 million for first-time buyers. This initiative should make homes more affordable and help boost the housing market, however, we would like to see this policy expanded to all homebuyers, to make an even greater impact,” says Moura.
Total residential sales in December included 192 detached homes (no change from December 2024), and 52 townhouses (down 39.1 per cent). Sales also included 35 condominium units (down 14.6 per cent) and 26 semi-detached homes (up 23.8 per cent).
For 2025, total residential sales included 3,779 detached (down 7.7 per cent), and 1,174 townhouses (down 14.4 per cent). Sales also included 727 condominium units (down 11.6 per cent) and 484 semi-detached homes (up 1.5 per cent).
In December, the average sale price for all residential properties in Waterloo Region was $716,911. This represents a 5.9 per cent decrease compared to December 2024 and a 0.5 per cent increase compared to November 2025.
- The average sale price of a detached home was $839,394. This represents a 6.0 per cent decrease from December 2024 and an increase of 1.4 per cent compared to November 2025.
- The average sale price for a townhouse was $568,249. This represents a 9.8 per cent decrease from December 2024 and a decrease of 4.4 per cent compared to November 2025.
- The average sale price for an apartment-style condominium was $366,784. This represents a 22.9 per cent decrease from December 2024 and a decrease of 13.1 per cent compared to November 2025.
- The average sale price for a semi was $601,535. This represents a decrease of 6.7 per cent compared to December 2024 and a decrease of 5.6 per cent compared to November 2025.

Year-to-date, the average sale price for all residential properties in Waterloo Region decreased 3.7 per cent to $754,199 compared to 2024.
- The year-to-date average price of a detached home was $876,896. This represents a 3.7 per cent decrease compared to 2024.
- The year-to-date average sale price for a townhouse was $611,256. This represents a 4.3 per cent decrease compared to 2024.
- The year-to-date average sale price for an apartment-style condominium was $437,084. This represents a 7.4 per cent decrease compared to 2024.
- The year-to-date average sale price for a semi was $635,412. This represents a decrease of 4.1 per cent compared to 2024.

CORNERSTONE cautions that average sale price information can help establish long-term trends but does not indicate specific properties have increased or decreased in value. The MLS® Home Price Index (HPI) provides the best way to gauge price trends because averages are strongly distorted by changes in the mix of sales activity from one month to the next.
Monthly MLS® Home Price Index Benchmark Price (HPI)
|
|
Kitchener-Waterloo |
Cambridge |
| Benchmark Type: |
December 2025 |
Monthly % Change |
Yr./Yr. % Change |
December 2025 |
Monthly % Change |
Yr./Yr. % Change |
| Composite |
$640,100 |
-0.4 |
-8.8 |
$674,300 |
-1.6 |
-6.1 |
| Single Family |
$752,200 |
-0.3 |
-8.1 |
$714,100 |
-2.0 |
-5.8 |
| Townhouse |
$527,600 |
-0.6 |
-8.8 |
$597,100 |
-0.4 |
-4.5 |
| Apartment |
$392,000 |
-0.9 |
-11.6 |
$430,600 |
-1.3 |
-8.3 |
Annual MLS® Home Price Index Benchmark Price
|
|
Kitchener-Waterloo |
Cambridge |
| Benchmark Type: |
2025 |
Yr./Yr. % Change |
2025 |
Yr./Yr. % Change |
| Composite |
$679,600 |
-5.4% |
$712,200 |
-4.0% |
| Detached |
$799,800 |
-5.1% |
$756,300 |
-3.4% |
| Townhouse |
$554,400 |
-6.3% |
$617,500 |
-4.0% |
| Apartment |
$415,500 |
-7.50% |
$451,600 |
-5.9% |

There were 375 new listings added to the MLS® System in Waterloo Region last month, an increase of 6.5 per cent compared to December last year, and an 11.3 per cent increase compared to the previous ten-year average for December.
In 2025, 13,872 new listings were added to Cornerstone’s MLS® System in the Waterloo Region, an increase of 5.2 per cent compared to 2024, and a 15.7 per cent increase compared to the previous ten-year annual average.
At the end of December, there were 1,188 homes available for sale in active status, representing a 15.9% increase from the same month last year. This number surpasses the previous ten-year average of 595 homes in December.
The total inventory across the market increased by 27.8 percent, resulting in a 2.3-month supply of all property types by the end of December. Condominium apartments had the highest inventory, with 4.9 months’ supply, followed by townhouses with 3.0 months’ supply and detached homes with 1.7 months’ supply. The number of months of inventory represents the time it would take to sell all current inventories at the current sales rate.
The average time to sell a home in December was 45 days, which is 6 days longer than the previous month. In December 2024, it took 36 days for a home to sell, and the five-year average was 24 days.
View our HPI tool here to learn more: https://www.cornerstone.inc/stats/
Click on any of the graphs below for an interactive view.

Cornerstone Association of REALTORS® cautions that average sale price information can help identify long-term trends but should not indicate that specific properties have increased or decreased in value. The average sale price is calculated based on the total dollar volume of all properties sold. Months’ Supply is the inventory of homes for sale at the end of a given month, divided by the average monthly closed sales from the last 12 months. Those requiring specific information on property values should contact a Waterloo Region REALTOR®. REALTORS® have their fingers on the pulse of the market. They know the questions to ask, the areas to probe and what to look for to get a complete picture of the property and community you’re considering.