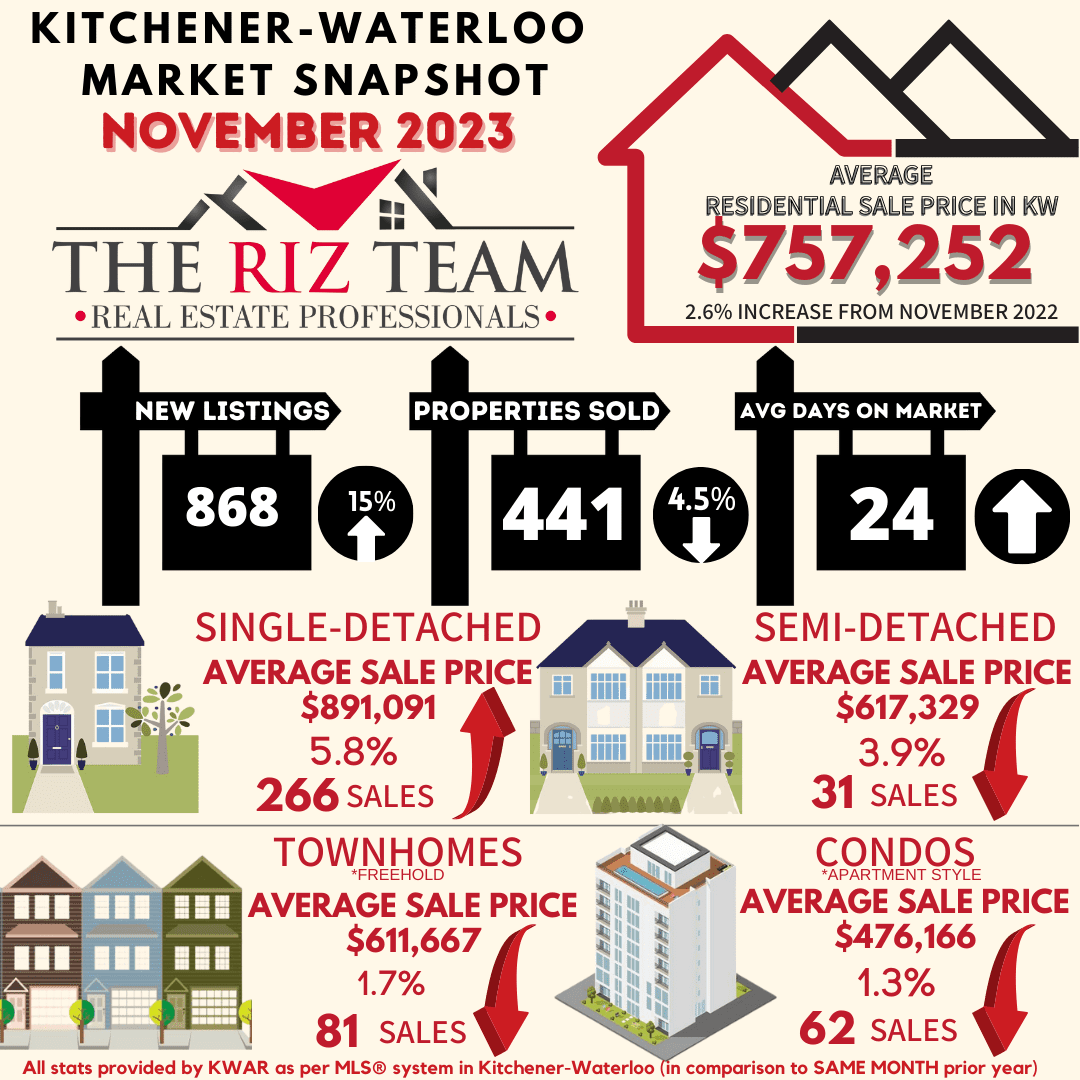
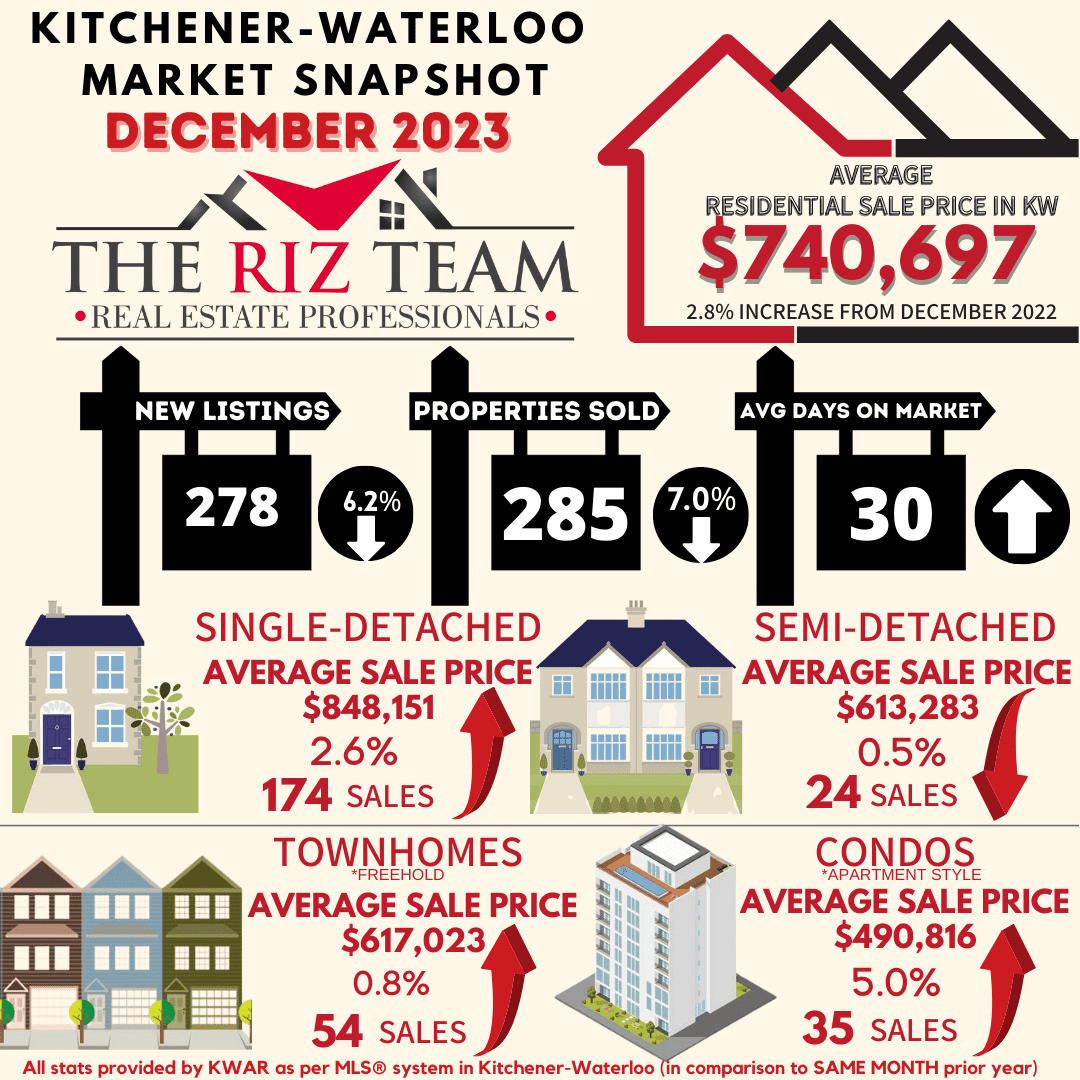
Kitchener Waterloo Market Snapshot March 2024
April 4th, 2024Waterloo Region Home Sales Sluggish in March, Prices Steady
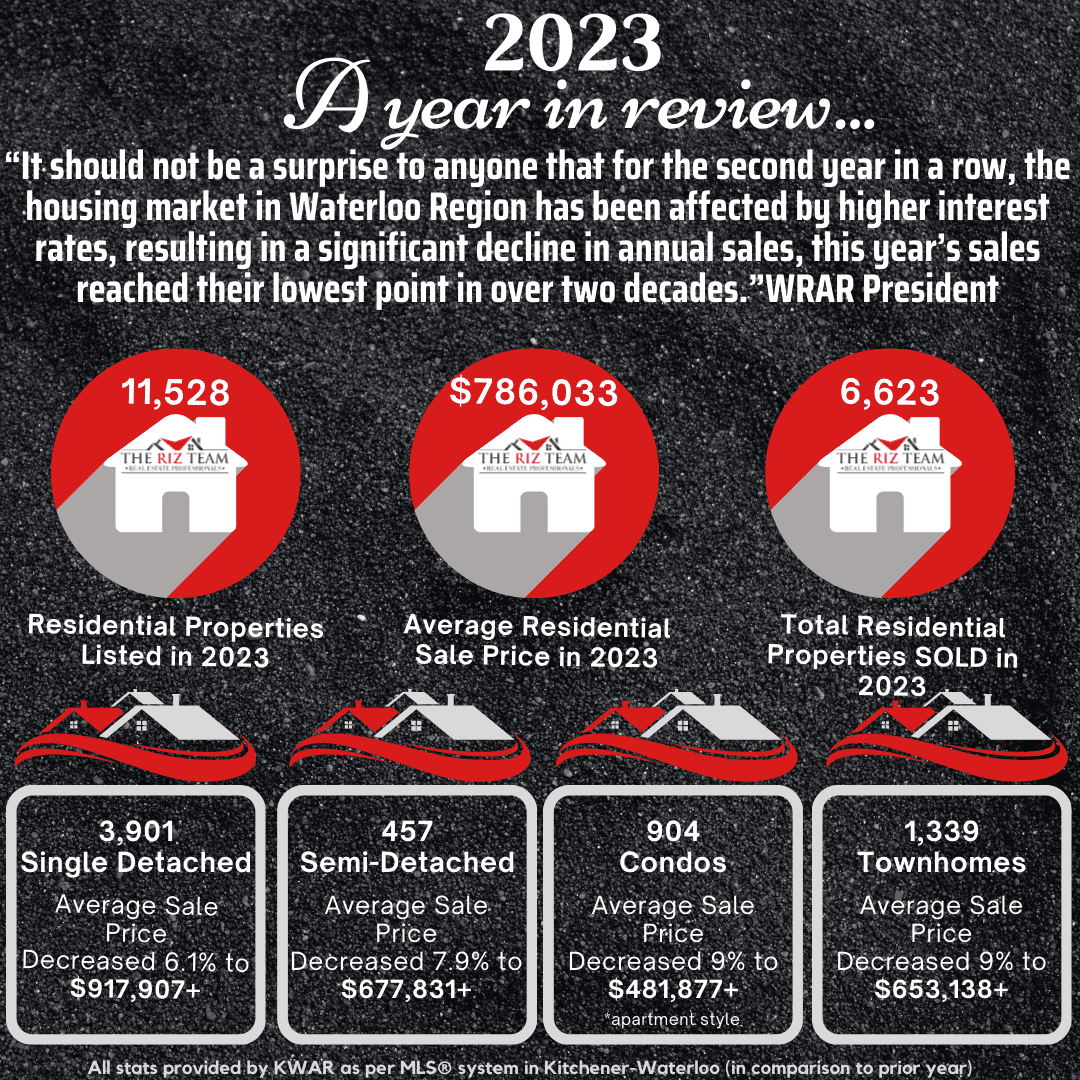
Despite the challenging market conditions, the first quarter of 2024 saw an increase in home sales, marking an 8.0 per cent rise compared to the previous year. However, these figures still fall short of the first-quarter sales of the past decade.
“While home sales in Waterloo Region hit a record low for March in over two decades, we’re also witnessing a positive trend,” says Christal Moura, president of WRAR. Over the past three months, prices and activity have started to pick up, and I expect this momentum will continue into the spring.”
If you are considering to Sell your home or Buy a home in the next short while it would be highly beneficial for you to connect with one of our Team Agents at
The Riz Team
Do you want to know what your home is worth today? Click Below for our Online No Obligation Market Evaluation
WATERLOO REGION, ON (April 4, 2024) —In March, a total of 596 homes were sold via the Multiple Listing Service® (MLS®) System of the Waterloo Region Association of REALTORS® (WRAR). This represents a decrease of 3.2% compared to the same period last year and a decline of 33.4% compared to the average number of homes sold in the previous 5 years for the same month.
Despite the challenging market conditions, the first quarter of 2024 saw an increase in home sales, marking an 8.0 per cent rise compared to the previous year. However, these figures still fall short of the first-quarter sales of the past decade.
“While home sales in Waterloo Region hit a record low for March in over two decades, we’re also witnessing a positive trend,” says Christal Moura, president of WRAR. Over the past three months, prices and activity have started to pick up, and I expect this momentum will continue into the spring.”
Total residential sales in March included 344 detached (down 3.9 per cent from March 2023), and 127 townhouses (down 0.8 per cent). Sales also included 86 condominium units (down 1.1 per cent) and 37 semi-detached homes (down 11.9 per cent).
In March, the average sale price for all residential properties in Waterloo Region was $806,279. This represents a 3.6 per cent increase compared to March 2023 and a 6.6 per cent increase compared to February 2024.
- The average price of a detached home was $954,342. This represents a 4.9 per cent increase from March 2023 and an increase of 7.3 per cent compared to February 2024.
- The average sale price for a townhouse was $667,810. This represents a 4.4 per cent increase from March 2023 and an increase of 6.0 per cent compared to February 2024.
- The average sale price for an apartment-style condominium was $483,085. This represents an increase of 0.3 per cent from March 2023 and an increase of 5.3 per cent compared to February 2024.
- The average sale price for a semi was $680,039. This represents a decrease of 2.9 per cent compared to March 2023 and an increase of 1.0 per cent compared to February 2024.

MLS® Home Price Index Benchmark Price |
||||||
| Kitchener-Waterloo | Cambridge | |||||
| Benchmark Type: | March 2024 | Monthly % Change | Yr./Yr. % Change | March 2024 | Monthly % Change | Yr./Yr. % Change |
| Composite | $740,900 | 1.6 | 0.0 | $747,500 | 0.7 | 0.9 |
| Detached | $853,800 | 1.5 | 1.3 | $780,100 | 0.8 | 1.1 |
| Townhouse | $614,900 | 2.3 | 1.3 | $652,400 | 0.6 | 2.4 |
| Apartment | $461,900 | 2.1 | -0.7 | $490,500 | 2.8 | 3.4 |

“Home prices have been gradually increasing since December, which is a typical trend,” explains Moura. “The rate and extent of further increases will depend on the willingness and patience of potential home buyers who have been waiting for lower interest rates before making their purchase. With the Bank of Canada not anticipated to make any rate changes before its June meeting, some potential home buyers may feel stuck in limbo.”
The president of WRAR recommends that anyone interested in buying or selling a property in Waterloo Region seek advice from a local REALTOR® regarding the current market conditions. This will enable them to make an informed decision that aligns with their goals and priorities.
There were 1,023 new listings added to the MLS® System in Waterloo Region last month, an increase of 18.7 per cent compared to March last year and a 15.9 per cent decrease compared to the previous ten-year average for March.
The total number of homes available for sale in active status at the end of March was 1,081 an increase of 54.0 per cent compared to March of last year and 1.1 per cent below the previous ten-year average of 1,093 listings for March.
At the end of March, there were 1.9 months of inventory, a 58.3 percent increase compared to last year and 18.8 percent above the previous 10-year average. The number of months of inventory represents how long it would take to sell off current inventories at the current sales rate.
The average number of days to sell in March was 19, the same number as March 2023. The previous 5-year average is 18 days.
These statistics provide a snapshot of the real estate market in the Waterloo Region in March, showing both positive and challenging aspects for buyers and sellers. WRAR encourages buyers to reach out to local Realtors for valuable insights about the current state of the local market and to receive tailored advice based on their specific needs.
View our HPI tool here to learn more: https://wrar.ca/hpi/
Average Sales Price – Municipality

Average Sales Price – Township

Monthly Sales By Property Type

Monthly Supply of Homes for Sale

Monthly Supply of Homes for Sale – By Property Type

Monthly Median Sales Price – By Property Type

Monthly Average Sales Price – By Property Type

Monthly Average Days on Market

WRAR cautions that average sale price information can help identify long-term trends but should not be to indicate that specific properties have increased or decreased in value. The average sale price is calculated based on the total dollar volume of all properties sold. Months Supply is the inventory of homes for sale at the end of a given month, divided by the average monthly closed sales from the last 12 months. Those requiring specific information on property values should contact a Waterloo Region REALTOR®. REALTORS® have their fingers on the pulse of the market. They know the questions to ask, the areas to probe and what to look for so that you get a complete picture of the property and community you’re considering.


")
")