The Riz Team Blog

Kitchener Market Snapshot for February 2020

March 6th, 2020 by Riz Jadavji


STRONG HOME SALES IN FEBRUARY

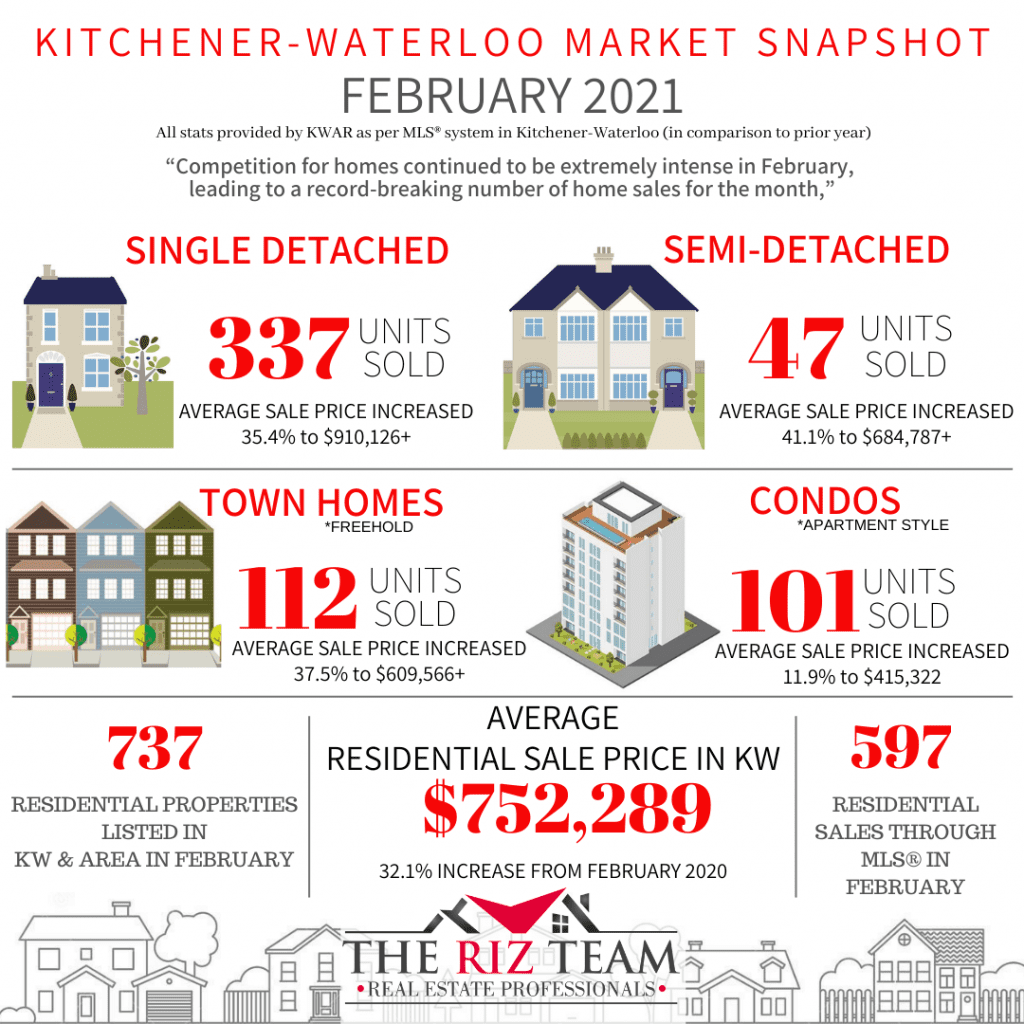
KITCHENER-WATERLOO, ON (March 5, 2020) ––There were 467 residential homes sold through the Multiple Listing System (MLS® System) of the Kitchener-Waterloo Association of REALTORS® in February, an increase of 36.5 per cent compared to the same month last year, and 15.3 per cent above the previous 10-year average.


“After a few consecutive months of sluggish home sales, home buying activity in February was much stronger,” says Colleen Koehler, President of KWAR.


Total residential sales in February included 272 detached homes (up 52 per cent), and 62 condominium units (up 14.8 per cent) which includes any property regardless of style (i.e. semis, townhomes, apartment, detached etc.). Sales also included 32 semi-detached homes (up 33.3 per cent) and 101 freehold townhouses (up 18.8 per cent).


The average sale price of all residential properties sold in February increased 16.3 per cent to $571,023 compared to the same month last year, while detached homes sold for an average price of $673,825 an increase of 13.2 per cent. During this same period, the average sale price for an apartment-style condominium was $371,923 for an increase of 16.4 per cent. Townhomes and semis sold for an average of $443,382 (up 12.9 per cent) and $485,831 (up 8.4 per cent) respectively.


The median price of all residential properties sold in February increased 18.2 per cent to $550,050 and the median price of a detached home during the same period increased 18.6 per cent to $630,000.


“Like many other markets across the province, the story of our local housing market continues to be one of supply and demand,” says Koehler. “Market-wide, the number of homes available for sale is simply not keeping up with the number of people wanting to purchase a home in the Kitchener-Waterloo area.”


REALTORS® listed 609 residential properties in KW and area last month, an increase of 7.8 per cent compared to February of 2019, and a decrease of 5.9 per cent in comparison to the previous ten-year average for February. The total number of homes available for sale in active status at the end of February was 447, a decrease of 39.4 per cent compared to February of last year, and 62 per cent below the previous ten-year average of 1,179 listings for February. The number of Months Supply (also known as absorption rate) in February was just 0.9 months, 40 per cent below the same period last year. The previous ten-year average supply of homes for February was 2.55 months, and in the past 5 years the average supply for February was 1.76 months.


KWAR’s president points out that now more than ever sellers should avail themselves of a REALTOR®. “With a multitude of buyers jumping on a scarcity of properties for sale, many homes are selling for more than the asking price.  A REALTOR® will ensure you have maximum exposure to these buyers through the MLS® System and will manage the intricate process of any multiple offers professionally.”


The average days to sell in February was 17 days, compared to 26 days in February 2019.


KWAR cautions that average sale price information can be useful in establishing long term trends but should not be used as an indicator that specific properties have increased or decreased in value. The average sale price is calculated based on the total dollar volume of all properties sold. Months Supply is the inventory of homes for sale at the end of a given month, divided by the average monthly closed sales from the last 12 months Those requiring specific information on property values should contact a local REALTOR®. REALTORS® have their fingers on the pulse of the market. They know the questions to ask, the areas to probe and what to look for so that you get a complete picture of the property and community you’re considering.


Historical Sales By Property Type


Months Supply of Homes for Sale


Historical Median Sales Price – By Property Type


Historical Average Sales Price – By Property Type


Historical Sales – By Price Range


Average Days on Market

Kitchener Market Snapshot for January 2020

February 5th, 2020 by Riz Jadavji

Kitchener Market Snapshot January 2020


Fewer Home Sales in January as the Number of Homes for Sale Continues to Elude Buyers in Kitchener- Waterloo

“For the third consecutive month sales were down in January,” says Colleen Koehler, President of KWAR.  “Slower January sales are a result of fewer homes being put up for sale. This is causing further price acceleration as we have enough willing and able home buyers contending for those few homes that are available.”

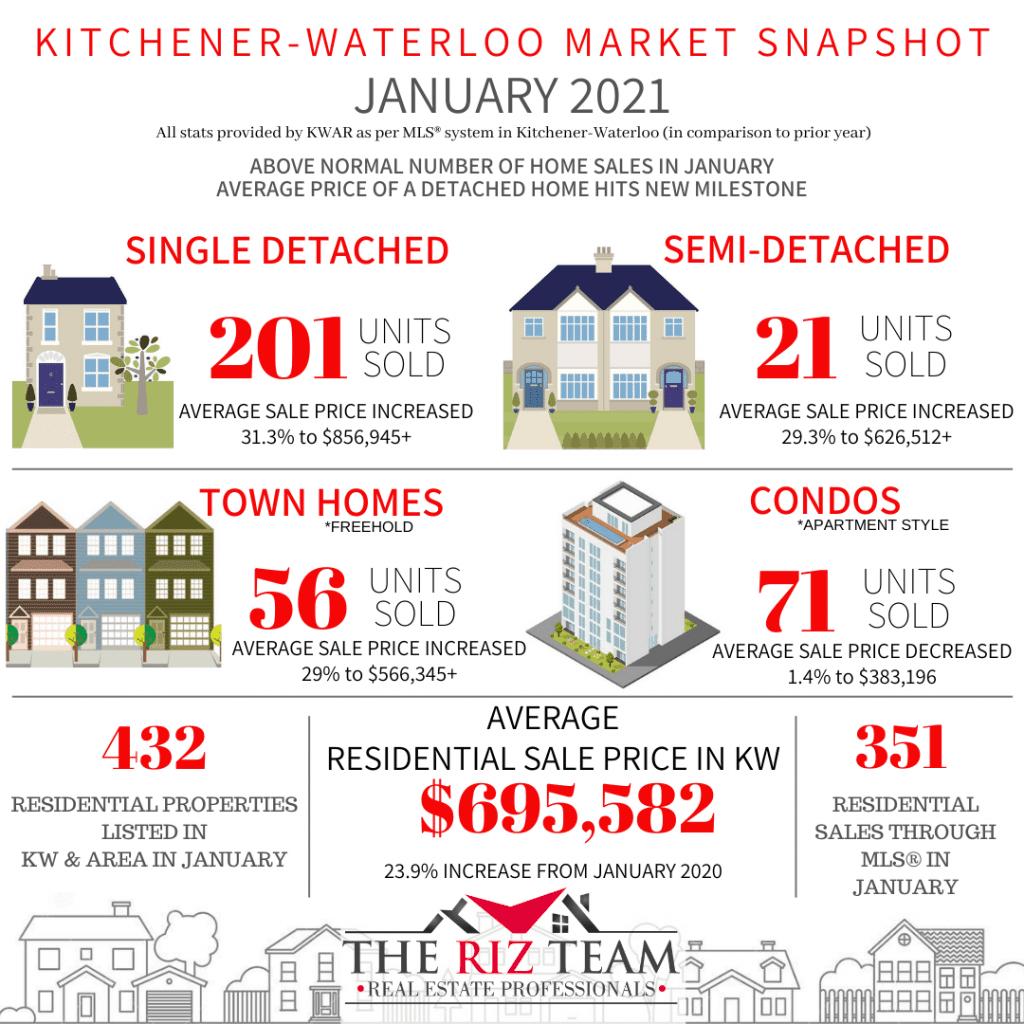
Total residential sales in January included 153 detached homes (down 19 per cent), and 39 condominium units (up 18.2 per cent) which includes any property regardless of style (i.e. semis, townhomes, apartment, detached etc.). Sales also included 21 semi-detached homes (on par) and 68 freehold townhouses (up 7.9 per cent).

The average sale price of all residential properties sold in January increased 15.7 per cent to $561,029 compared to the same month last year, while detached homes sold for an average price of $670,944 an increase of 18.8 per cent. During this same period, the average sale price for an apartment-style condominium was 382,636 for an increase of 26.1 per cent. Townhomes and semis sold for an average of $439,765 (up 20.3 per cent) and $484,190 (up 18.7 per cent) respectively.

The median price of all residential properties sold in January increased 17.3 per cent to $536,000 and the median price of a detached home during the same period increased 22.6 per cent to $650,000.

“Consumers can’t buy what’s not there. The available number of homes for sale, or lack thereof, continued to evade home buyers in January,” says Koehler. “There is no doubt we would be reporting more sales if we had the inventory to match the demand.”

Koehler notes Kitchener-Waterloo and area continues to be an exceptionally attractive place to buy a home and a creditworthy buyer can negotiate an attractive interest rate with their mortgage lender.

REALTORS® listed 464 residential properties in KW and area last month, a drop of 21.1 per cent compared to January of 2019, and a decrease of 35.4 per cent in comparison to the previous ten-year average for January. The total number of homes available for sale in active status at the end of January was 392, a decrease of 38.7 per cent compared to January of last year, and 63.7 per cent below the previous ten-year average of 1,080 listings for January. The number of Months Supply (also known as absorption rate) in January was just 0.8 months, 38.5 per cent below the same period last year. The previous ten-year average supply of homes for January was 2.32 months, however, in the past 5 years the average supply for January was 1.96 months.

The average days to sell in January was 22 days, compared to 27 days in January 2019.


Historical Sales By Property Type  

Months Supply of Homes for Sale 

Historical Average Sales Price – By Property Type 

Historical Sales – By Price Range 

Average Days on Market


Kitchener Market Snapshot for 2019

January 6th, 2020 by Riz Jadavji

Kitchener Market Snapshot for 2019

2019 A STEADFAST YEAR FOR HOME SALES IN KW

Sales Dip in DecemberWhile Prices Continue to Escalate 

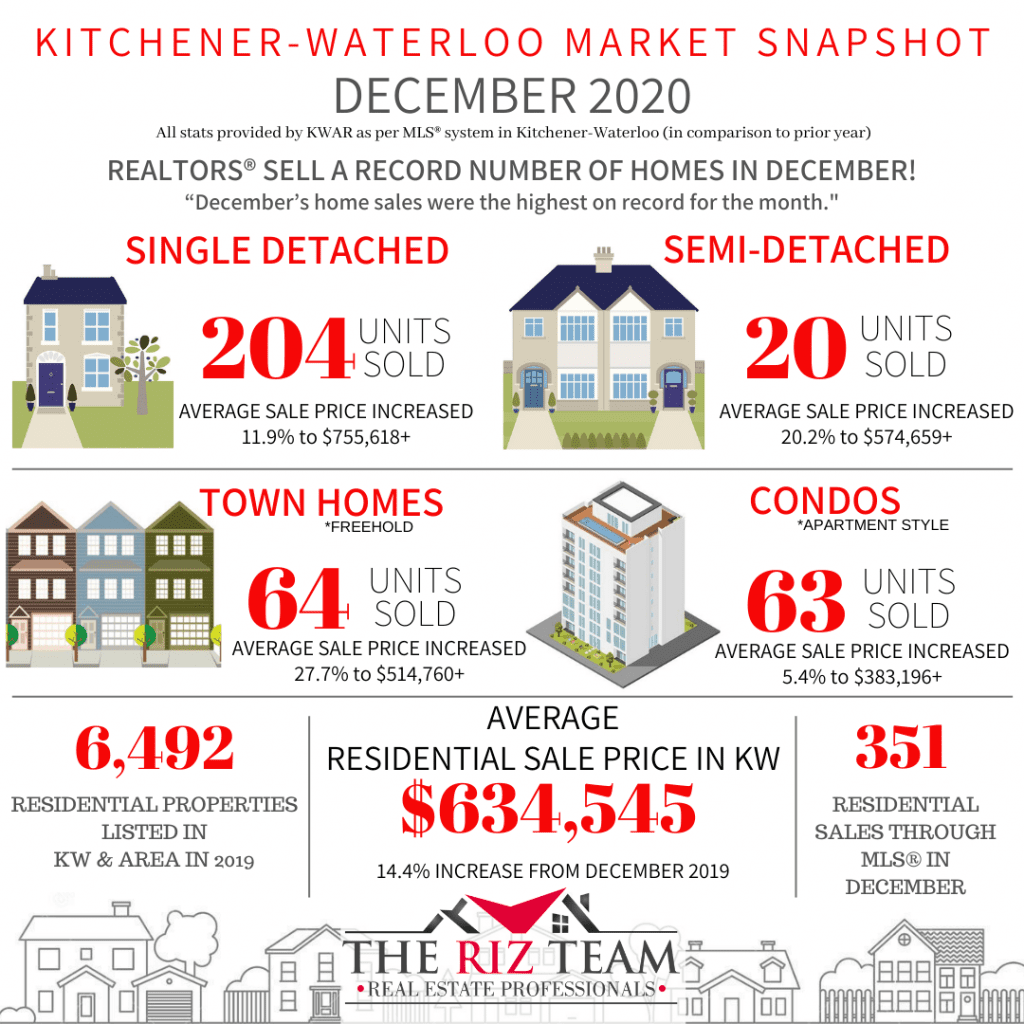
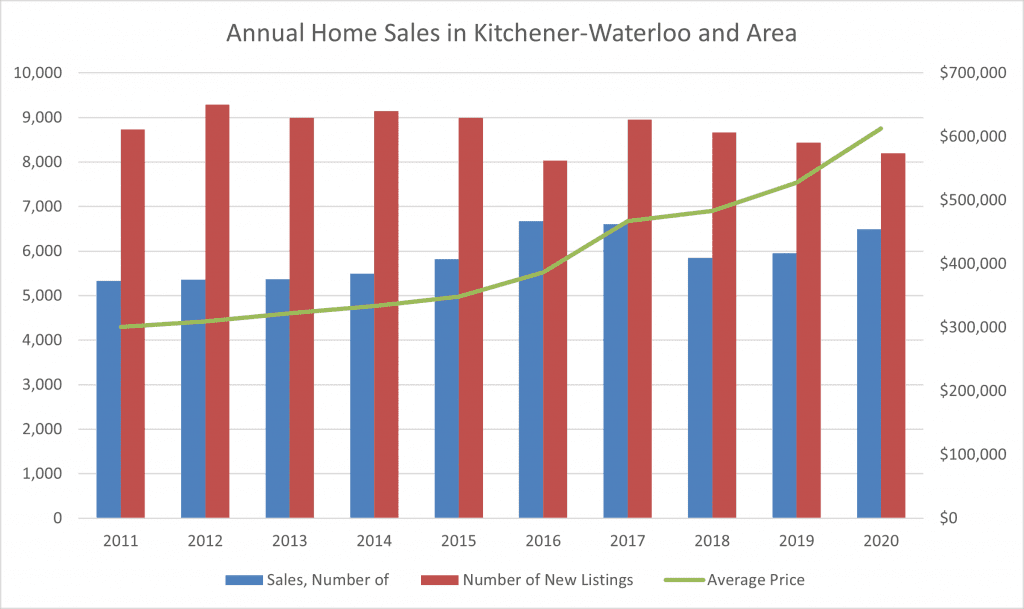
KITCHENER-WATERLOO, ON (Jan 6, 2020) ––There were 5,925 residential homes sold through the Multiple Listing System (MLS® System) of the Kitchener-Waterloo Association of REALTORS® in 2019, an increase of 1.6 per cent compared to 2018. Contrasted to past years, 2019’s annual sales were 2.3 per cent below the previous 5-year average, and 3 per cent above the previous 10-year average.

On a monthly basis, sales dipped 9 percent compared to last year, with 244 home sales in the month of December.

“Overall, it was a steadfast pace of home sales in 2019,” says Colleen Koehler, President of KWAR.  “When annual home sales in Kitchener-Waterloo hit near 6000 transactions, I consider it to be a strong real estate market.”

Total residential sales in 2019 included 3,590 detached (up 5.9 per cent), and 648 condominium units (down 7.8 per cent) which includes any property regardless of style (i.e. semis, townhomes, apartment, detached etc.). Sales also included 421 semi-detached homes (down 0.7 per cent) and 1,266 freehold townhouses (down 3.7 per cent).

The average sale price of all residential properties sold in 2019 increased 9.3 per cent to $527,718 compared to 2018. Detached homes sold for an average price of $614,743 an increase of 7.1 per cent compared to 2018. During this same period, the average sale price for an apartment style condominium was 332,409 for an increase of 9.6 per cent. Townhomes and semis sold for an average of $409,979 (up 10 per cent) and $439,844 (up 11 per cent) respectively.

The median price of all residential properties sold last year increased 10.1 per cent to $490,000 and the median price of a detached home during the same period increased 8.6 per cent to $570,000.

“In 2019, the lack of supply continued to be a hurdle for anyone who was trying to buy their first home, move-up from their current residence, or downsize. This ongoing state of the market caused further escalation of home prices in 2019. With interest rates expected to stay low in the year ahead combined with Waterloo region’s ongoing growth, I expect 2020 will see more price gains alongside a steady increase in sales,” says Koehler.

The number of months of inventory averaged 1.5 throughout the year, hitting its highest point in May when there was 2.1 months of supply, and ending the year at 0.7 (3-4 months supply is historically normal for Waterloo region). The average days to sell in 2019 was 23 days, compared to 24 days in 2018 and a previous 10-year average of 38 days.

Dollar volume of all residential real estate sold last year increased 10.9 per cent to $3.1 Billion compared with 2018.

While the majority of residential MLS® System activity is properties for sale, REALTORS® are increasingly representing landlords and tenants. Last year 733 residential leases occurred through KWAR’s MLS® System, which is on par with last year and, 2.5 times as many as just four years ago.

Historical Sales by Property Type

Months Supply of Homes for Sale

Historical Median Sales Price – By Property Type

Average Sales Price – By Property Type
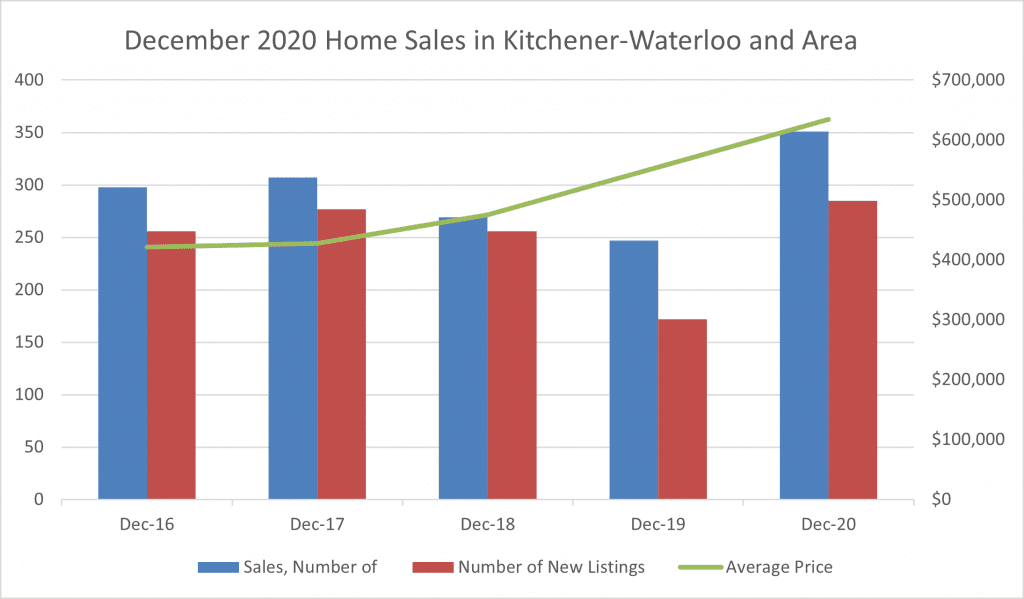
Historical Sales – By Price Range

Average Days on Market

Christmas Shortbread Cookies

December 10th, 2019 by Riz Jadavji

Shortbread Christmas Cookies are easy to make and loaded with festive sprinkles, making the perfect addition to your holiday cookie platter!

INGREDIENTS 

1 cup salted butter, cold and cut into pieces

½ cup granulated sugar

1 teaspoon vanilla extract or almond extract

2 ¼ cups all-purpose flour

Optional: red and green sprinkles

Read More Here!

NOVEMBER MARKET SNAPSHOT

December 4th, 2019 by Riz Jadavji

SLOWER HOME SALES—BIG PRICE GAINS IN NOVEMBER   

KITCHENER-WATERLOO, ON (December 4, 2019) ––424 residential properties sold through the Multiple Listing System (MLS® System) of the Kitchener-Waterloo Association of REALTORS® (KWAR) in November, a decrease of 12.4 per cent compared to the same month last year.

Home sales in November included 265 detached (down 1.5 per cent), and 46 condominium apartments (down 28.1 per cent). Sales also included 75 townhouses (down 38.5 per cent) and 38 semi-detached homes (up 31 per cent).

“Home sales were slower in November,” says Colleen Koehler, KWAR President. “However, looking at the last six months of activity combined, unit sales are up four per cent over last year, and trending above average,” says Koehler.

The average sale price of all residential properties sold in November increased by 18.7 per cent to $566,866 compared to November 2018. Detached homes sold for an average price of $660,071 an increase of 14.2 per cent compared to November of last year. During this same period, the average sale price for an apartment-style condominium was $342,561 for an increase of 13 per cent. Townhomes and semis sold for an average of $443,633 (up 22.4 per cent) and $431,635 (up 3.5 per cent) respectively.

The median price of all residential properties sold last month increased 17.6 per cent to $516,500 and the median price of a detached home during the same period increased by 14.7 per cent to $596,250.

The average days it took to sell a home in November was 27 days, which is one day less than it took in November 2018.

REALTORS® listed 432 residential properties in K-W and area last month, a decrease of 27.9 per cent compared to November of 2018, and a decrease of 17.5 per cent in comparison to the previous ten-year average for the month of November. The total number of homes available for sale in active status at the end of November totalled 553, a decrease of 34 per cent compared to November of last year, and well below the previous ten-year average of 1,252 listings for November. Months Supply of Homes for sale stood at 1.1 months in November, which is 35.3 percent lower than the same period last year. The previous ten-year average months supply of homes for November was 2.68.

Koehler points to the number of new jobs being created and business investment in the area as factors contributing to the continuing state of demand for homes outpacing inventory.

“People moving to this area from other places is continuing to be a significant factor for our market. These buyers are selling wherever they are coming from and buying here, removing homes from the inventory but not putting anything in. This has pushed up prices by decreasing inventory while demand persists,” says Koehler. “Prices are increasing because homebuyer demand is exceeding the number of homes on the market—as we learned at our Housing Market Insight event last week—this trend will continue throughout 2020.”

Koehler believes the price growth we’re seeing in the Waterloo region is also an indication of the success of our local economy and the value consumers place on homeownership. She advises homebuyers and sellers work with a REALTOR® who is a member of the Kitchener-Waterloo Association of REALTORS® to help them navigate this highly competitive and complex real estate market.

DIY CHRISTMAS WREATH

November 27th, 2019 by Riz Jadavji

Need a great holiday craft project? Here is list on how to make different Christmas wreaths that perfectly fit your taste, looks great on your door, and is fun to make! Whether your taste in holiday decor is clean and minimalist or bold and glitzy, you’ll find a DIY Christmas wreath to make this holiday season in the list below!

READ MORE: http://bit.ly/2XPcKNy

DIY Pumpkin Spice Latte

November 21st, 2019 by Riz Jadavji

Enjoy this coffeehouse-style Pick-Me-Up Pumpkin Spice Latte drink anytime. Pumpkin melts right into the coffee and adds body and natural flavor. This is a great satisfying specialty beverage for all year round.

INGREDIENTS

1 cup strong coffee

2/3 cup Evaporated Milk

1/3 cup 100% Pure Pumpkin

2 teaspoons granulated sugar or more to taste

1/4 teaspoon pumpkin pie spice or ground cinnamon

1 teaspoon pure vanilla extract

Whipped cream (optional)

READ INSTRUCTIONS HERE

D.I.Y. LIGHT BULB DECOR

November 15th, 2019 by Riz Jadavji

D.I.Y. Beaded Showpiece! Wait before you throw out your old bulbs. Reuse the bulbs to make your room extraordinary! Here are ways to make your home look beautiful and brighter with these d.i.y. bulbs!
READ MORE: http://bit.ly/2Oeek7f

OCTOBER MARKET SNAPSHOT

November 5th, 2019 by Riz Jadavji

STRONG HOME SALES CONTINUE IN OCTOBER IN FACE OF LOW INVENTORY

KITCHENER-WATERLOO, ON (November 5, 2019) ––538 residential properties sold through the Multiple Listing System (MLS® System) of the Kitchener-Waterloo Association of REALTORS® (KWAR) in October, an increase of 4.1 per cent compared to the same month last year.

Home sales in October included 334 detached (up 11.3 per cent), and 65 condominium apartments (up 1.6 per cent). Sales also included 108 townhouses (down 6.1 per cent) and 31 semi-detached homes (down 18.4 per cent).

“Home sales were up again last month led by strong sales of detached single family properties,” says Brian Santos, KWAR President.

The average sale price of all residential properties sold in October increased by 9.1 per cent to $533,288 compared to October 2018. Detached homes sold for an average price of $610,840 (an increase of 6.2 per cent compared to October of last year. During this same period, the average sale price for an apartment-style condominium was $333,895 for an increase of 6.7 per cent. Townhomes and semis sold for an average of $434,035 (up 11.2 per cent) and $461,590 (up 14.3 per cent) respectively.

The median price of all residential properties sold last month increased 12.4 per cent to $500,000 and the median price of a detached home during the same period increased by 8.3 per cent to $568,950.

The average days it took to sell a home in October was 22 days, which is three days fewer than it took in October 2018.

REALTORS® listed 670 residential properties in K-W and area last month, a decrease of 12.4 per cent compared to October of 2018, and a decrease of 3.3 per cent in comparison to the previous ten-year average for the month of October. The total number of homes available for sale in active status at the end of October totalled 691, a decrease of 26.5 per cent compared to October of last year, and well below the previous ten-year average of 1,412 listings for October. Months Supply of Homes for sale stood at 1.4 months in October, which is 26.3 percent lower than the same period last year. The previous ten-year average months supply of homes for October was 3.03.

“Seasonal strength in October is common as people to look to make moves before Winter. With a scarcity of listings, buyers continue to snap up properties in the Kitchener-Waterloo area at a robust rate,” says Santos.

In this highly competitive real estate market, Santos emphasizes the importance of working with a local REALTOR® who has a complete understanding of our unique region and its market dynamics.

5 CRITERIA FOR PRICING A HOME

October 21st, 2019 by Riz Jadavji

When you put your home up for sale, one of the best ways to determine the asking price is to look at comparable sales. There’s rarely a perfect apples-to-apples comparison, so a pricing decision often relies on comparisons to several recent sales in the area. Here are five criteria to look for in a sales comparison.

  1. Location: Homes in the same neighborhood typically follow the same market trends. Comparing your home to another in the same neighborhood is a good start, but comparing it to homes on the same street or block is even better.
  2. Date of sale: It varies by location, but housing markets can see a ton of fluctuation in a short time period. It‘s best to use the most recent sales data available.
  3. Home build: Look for homes with similar architectural styles, numbers of bathrooms and bedrooms, square footage, and other basics.
  4. Features and upgrades: Remodeled bathrooms and kitchens can raise a home’s price, and so can less flashy upgrades like a new roof or HVAC system. Be sure to look for similar bells and whistles.
  5. Sale types: Homes that are sold as short sales or foreclosures are often in distress or sold at a lower price than they’d receive from a more typical sale. These homes are not as useful for comparisons.

© Copyright 2017, Real Estate Websites by Redman Technologies Inc. | Privacy Policy | Disclaimer | Sitemap

MLS®, REALTOR®, and the associated logos are trademarks of The Canadian Real Estate Association.

The data included on this website is deemed to be reliable, but is not guaranteed to be accurate by the Kitchener-Waterloo Real Estate Board. The trademarks REALTOR®, REALTORS® and the REALTOR® logo are controlled by The Canadian Real Estate Association (CREA) and identify real estate professionals who are members of CREA. Used under license.