Kitchener Market Snapshot for February 2020
STRONG HOME SALES IN FEBRUARY
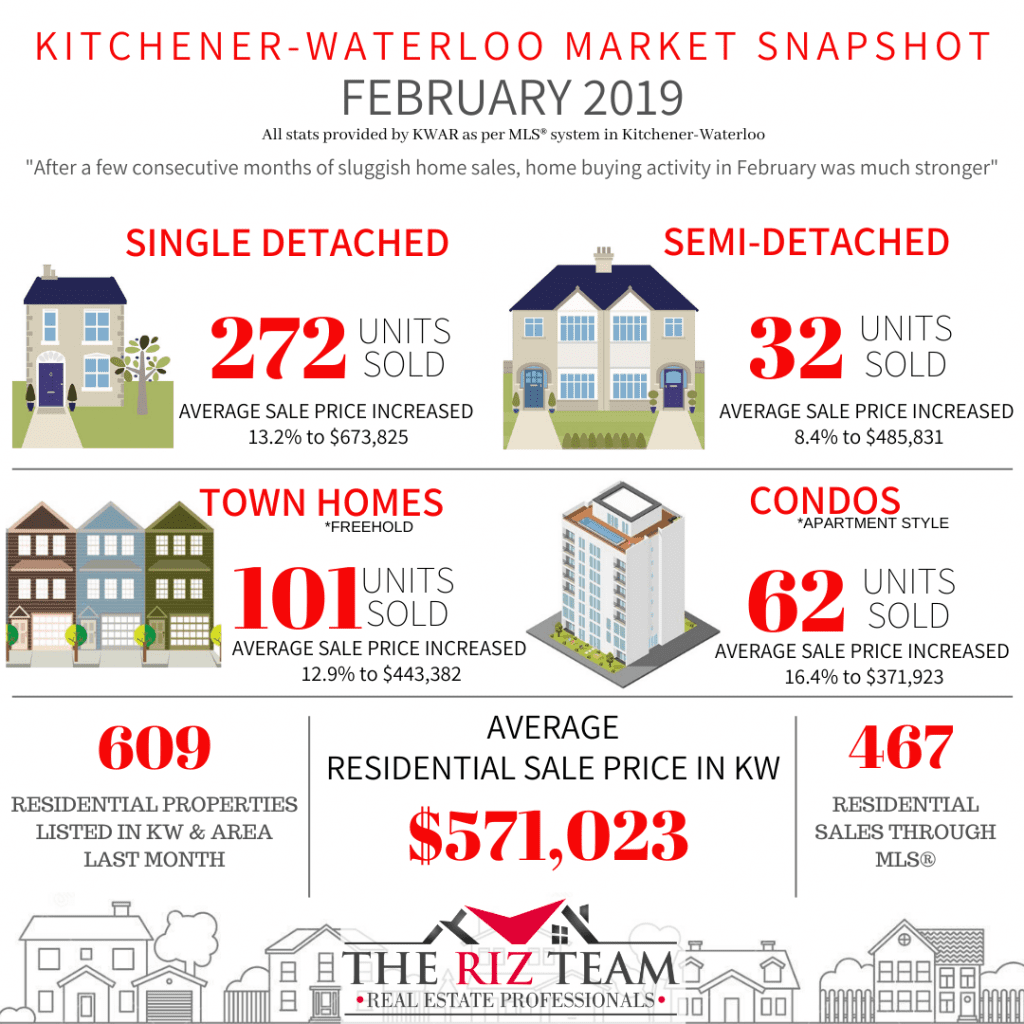
KITCHENER-WATERLOO, ON (March 5, 2020) ––There were 467 residential homes sold through the Multiple Listing System (MLS® System) of the Kitchener-Waterloo Association of REALTORS® in February, an increase of 36.5 per cent compared to the same month last year, and 15.3 per cent above the previous 10-year average.
“After a few consecutive months of sluggish home sales, home buying activity in February was much stronger,” says Colleen Koehler, President of KWAR.
Total residential sales in February included 272 detached homes (up 52 per cent), and 62 condominium units (up 14.8 per cent) which includes any property regardless of style (i.e. semis, townhomes, apartment, detached etc.). Sales also included 32 semi-detached homes (up 33.3 per cent) and 101 freehold townhouses (up 18.8 per cent).
The average sale price of all residential properties sold in February increased 16.3 per cent to $571,023 compared to the same month last year, while detached homes sold for an average price of $673,825 an increase of 13.2 per cent. During this same period, the average sale price for an apartment-style condominium was $371,923 for an increase of 16.4 per cent. Townhomes and semis sold for an average of $443,382 (up 12.9 per cent) and $485,831 (up 8.4 per cent) respectively.
The median price of all residential properties sold in February increased 18.2 per cent to $550,050 and the median price of a detached home during the same period increased 18.6 per cent to $630,000.
“Like many other markets across the province, the story of our local housing market continues to be one of supply and demand,” says Koehler. “Market-wide, the number of homes available for sale is simply not keeping up with the number of people wanting to purchase a home in the Kitchener-Waterloo area.”
REALTORS® listed 609 residential properties in KW and area last month, an increase of 7.8 per cent compared to February of 2019, and a decrease of 5.9 per cent in comparison to the previous ten-year average for February. The total number of homes available for sale in active status at the end of February was 447, a decrease of 39.4 per cent compared to February of last year, and 62 per cent below the previous ten-year average of 1,179 listings for February. The number of Months Supply (also known as absorption rate) in February was just 0.9 months, 40 per cent below the same period last year. The previous ten-year average supply of homes for February was 2.55 months, and in the past 5 years the average supply for February was 1.76 months.
KWAR’s president points out that now more than ever sellers should avail themselves of a REALTOR®. “With a multitude of buyers jumping on a scarcity of properties for sale, many homes are selling for more than the asking price. A REALTOR® will ensure you have maximum exposure to these buyers through the MLS® System and will manage the intricate process of any multiple offers professionally.”
The average days to sell in February was 17 days, compared to 26 days in February 2019.
KWAR cautions that average sale price information can be useful in establishing long term trends but should not be used as an indicator that specific properties have increased or decreased in value. The average sale price is calculated based on the total dollar volume of all properties sold. Months Supply is the inventory of homes for sale at the end of a given month, divided by the average monthly closed sales from the last 12 months Those requiring specific information on property values should contact a local REALTOR®. REALTORS® have their fingers on the pulse of the market. They know the questions to ask, the areas to probe and what to look for so that you get a complete picture of the property and community you’re considering.
Historical Sales By Property Type

Months Supply of Homes for Sale

Historical Median Sales Price – By Property Type

Historical Average Sales Price – By Property Type

Historical Sales – By Price Range


Tags: buyers, for sale, Homes For Sale, kitchener, kitchener real estate, kitchener-waterloo, kitchener-waterloo association of realtors, KW Market Update, Market Update, real estate, real estate market, realtor, riz jadavji, royal lepage, Royal Lepage Wolle Realty, sales representative, the riz team, waterloo, Waterloo Buyers, waterloo for sale, Waterloo Homes, waterloo real estate, waterloo realtor, Waterloo Sellers