Kitchener Waterloo Market Snapshot April 2023
Demand Remains Strong as Home Prices Increase Month-Over-Month
If you are considering to Sell your home or Buy a home in the next short while it would be highly beneficial for you to connect with one of our Team Agents at
The Riz Team
Do you want to know what your home is worth today? Click Below for our Online No Obligation Market Evaluation
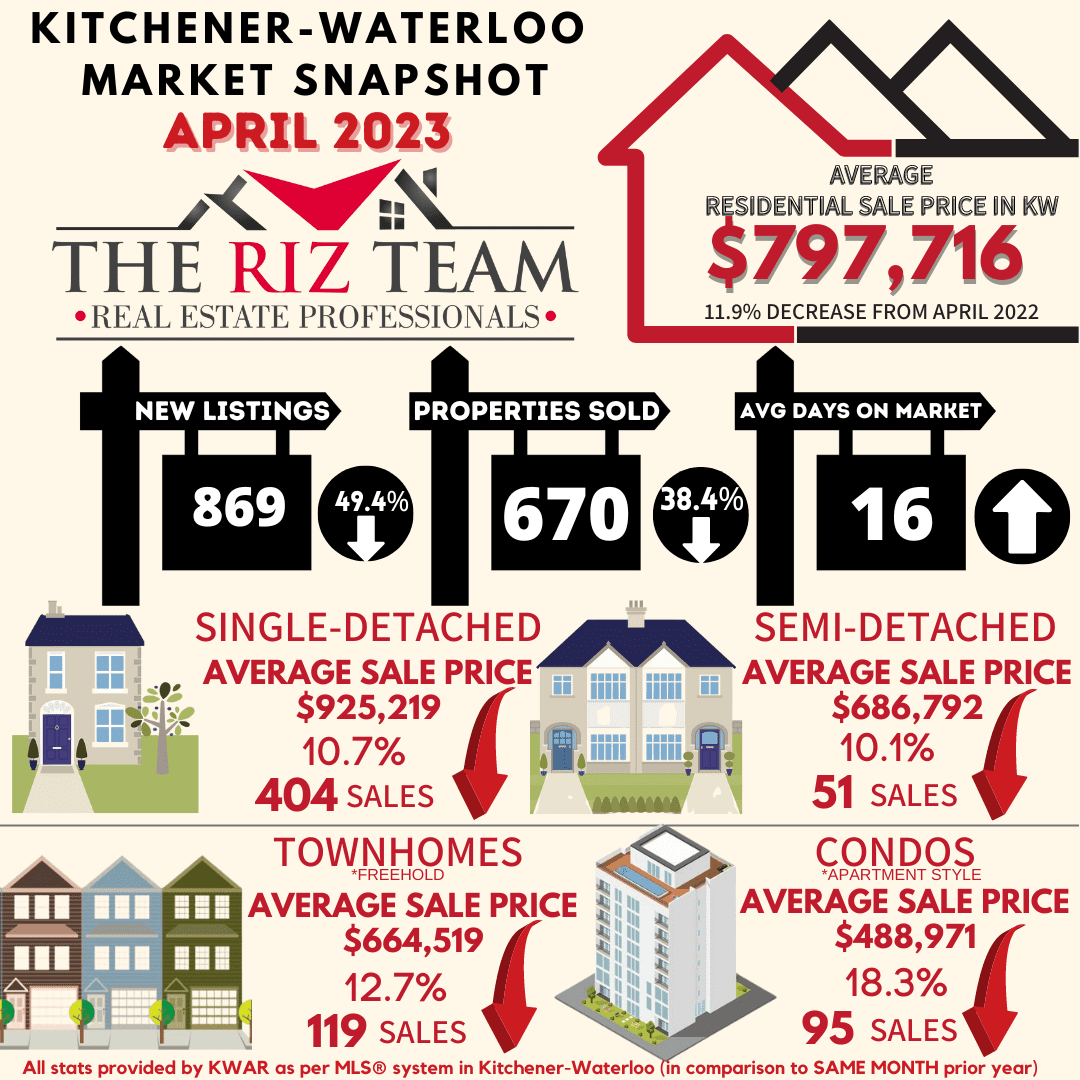
WATERLOO REGION, ON (May 4, 2023) — Sales volume through the Multiple Listing Service® (MLS®) System of the Waterloo Region Association of REALTORS® (WRAR) remained subdued last month, with 670 homes sold in April, representing a decrease of 22.0 per cent compared to April 2022 and 18.0 percent below the previous 5-year average for the month.
“The local spring market is off to a slower than usual start with half the number of new listings hitting the market than this time last year,” says Megan Bell, president of WRAR. “However, with demand continuing to outstrip supply, we saw prices increase on a month-over-month basis as total sales volume continues to waver well below historical figures for the month of April.”
Total residential sales in April included 404 detached (down 22.8 per cent from April 2022), and 119 townhouses (down 20.7 per cent). Sales also included 95 condominium units (down 18.1 per cent) and 51 semi-detached homes (down 25.0 per cent).
In April, the average sale price for all residential properties in Waterloo Region was $797,716. This represents an 11.9 per cent decrease compared to April 2022 and a 2.6 per cent increase compared to March 2023.
- The average price of a detached home was $925,219. This represents a 10.7 per cent decrease from April 2022 and an increase of 1.7 per cent compared to March 2023.
- The average sale price for a townhouse was $664,519. This represents a 12.7 per cent decrease from April 2022 and an increase of 3.9 per cent compared to March 2023.
- The average sale price for an apartment-style condominium was $488,971. This represents a decrease of 18.3 per cent from April 2022 and an increase of 1.5 per cent compared to March 2023.
- The average sale price for a semi was $686,792. This represents a decrease of 10.1 per cent compared to April 2022 and a decrease of 1.9 per cent compared to March 2023.
WRAR cautions that average sale price information can be useful in establishing long-term trends but should not be used as an indicator that specific properties have increased or decreased in value. The MLS® Home Price Index (HPI) provides the best way to gauge price trends because averages are strongly distorted by changes in the mix of sales activity from one month to the next.

MLS® Home Price Index Benchmark Price |
||||||
| Kitchener-Waterloo | Cambridge | |||||
| Benchmark Type: | April 2023 | Monthly % Change | Yr./Yr. % Change | April 2023 | Monthly % Change | Yr./Yr. % Change |
| Composite | $759,600 | 2.7 | -14.7 | $774,500 | 3.8 | -12.8 |
| Detached | $865,100 | 3.0 | -13.0 | $809,300 | 4.3 | -12.0 |
| Townhouse | $611,600 | 1.9 | -20.3 | $647,000 | 0.8 | -17.1 |
| Apartment | $484,900 | 2.3 | -13.4 | $491,900 | 1.8 | -16.0 |

“Waterloo Region remains a sellers’ market, and while prices have fallen in comparison to last year, we anticipate that home prices will continue to increase steadily,” says Bell. “Some stability in mortgage rates has brought about a return of buyer activity as we begin to observe a return of multiple offer scenarios, bidding wars, and a decrease in the number of days properties take to sell.”
There were 869 new listings added to the MLS® System in Waterloo Region last month, a decrease of 49.4 per cent compared to April of last year and a 33.2 per cent decrease compared to the previous ten-year average for April.
The total number of homes available for sale in active status at the end of April was 703, a decrease of 25.9 per cent compared to April of last year and 49.7 per cent below the previous ten-year average of 1397 listings for April.
The number of months of inventory is up 8.3 per cent compared to April of last year, but still historically low at 1.3 months. The number of months of inventory represents how long it would take to sell off current inventories at the current sales rate.
The average number of days to sell in April was 16, compared to 9 days in April 2022. The previous 5-year average is 16 days.
View our HPI tool here to learn more: https://wrar.ca/hpi/
Click on any of the graphs below for an interactive view.


WRAR cautions that average sale price information can help identify long-term trends but should not be to indicate that specific properties have increased or decreased in value. The average sale price is calculated based on the total dollar volume of all properties sold. Months Supply is the inventory of homes for sale at the end of a given month, divided by the average monthly closed sales from the last 12 months. Those requiring specific information on property values should contact a Waterloo Region REALTOR®. REALTORS® have their fingers on the pulse of the market. They know the questions to ask, the areas to probe and what to look for so that you get a complete picture of the property and community you’re considering.
Tags: buyers, for sale, Homes For Sale, Kitchener Buyers, kitchener-waterloo, kitchener-waterloo association of realtors, KW Market Update, realtor, Royal Lepage Wolle Realty, the riz team, waterloo, waterloo real estate, waterloo realtor, Waterloo Sellers
This entry was posted on Thursday, May 4th, 2023 at 1:05 pm and is filed under Kitchener Buyers, Kitchener Sellers, Market Stats, Market Update, Real Estate News, Waterloo Buyers, Waterloo Sellers. You can follow any responses to this entry through the RSS 2.0 feed. Both comments and pings are currently closed.