Posts Tagged ‘real estate market’
Monday, October 5th, 2020
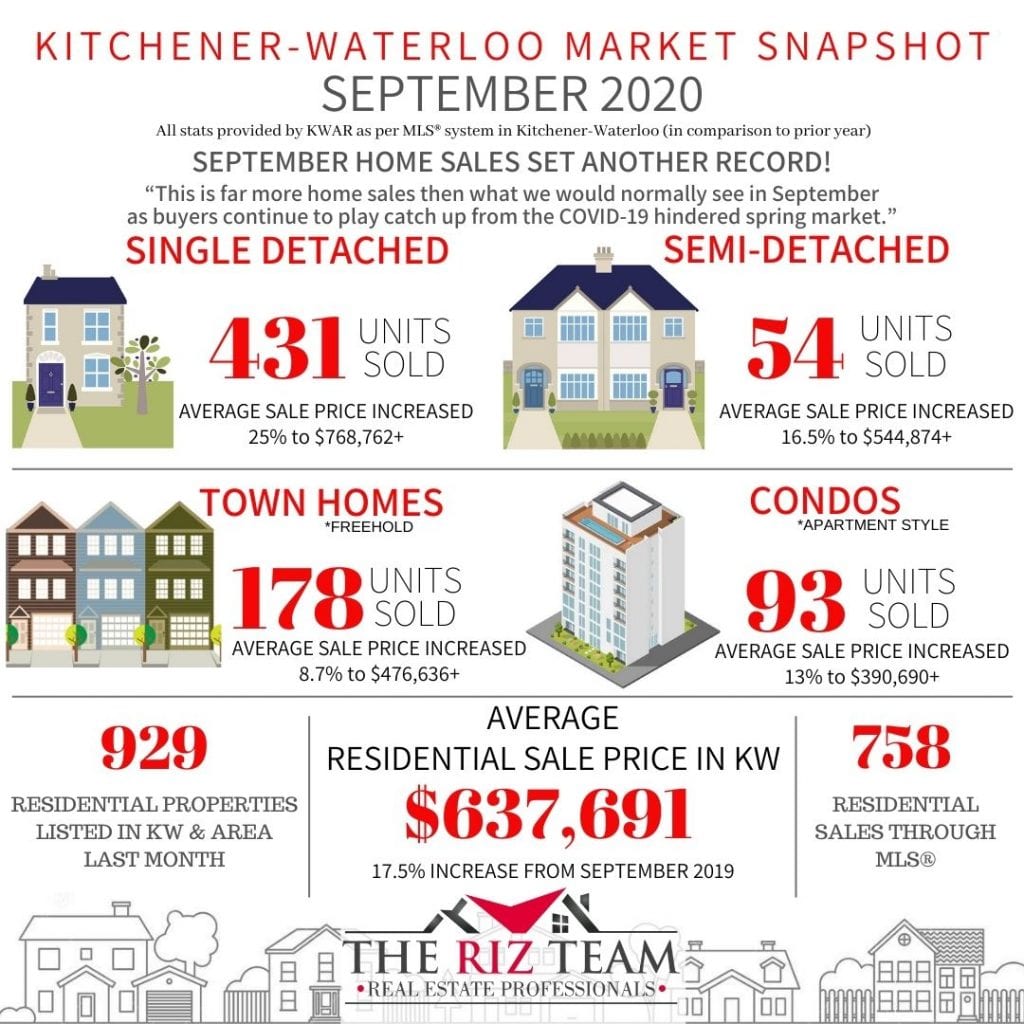
REALTORS® SELL A RECORD NUMBER OF HOMES IN SEPTEMBER
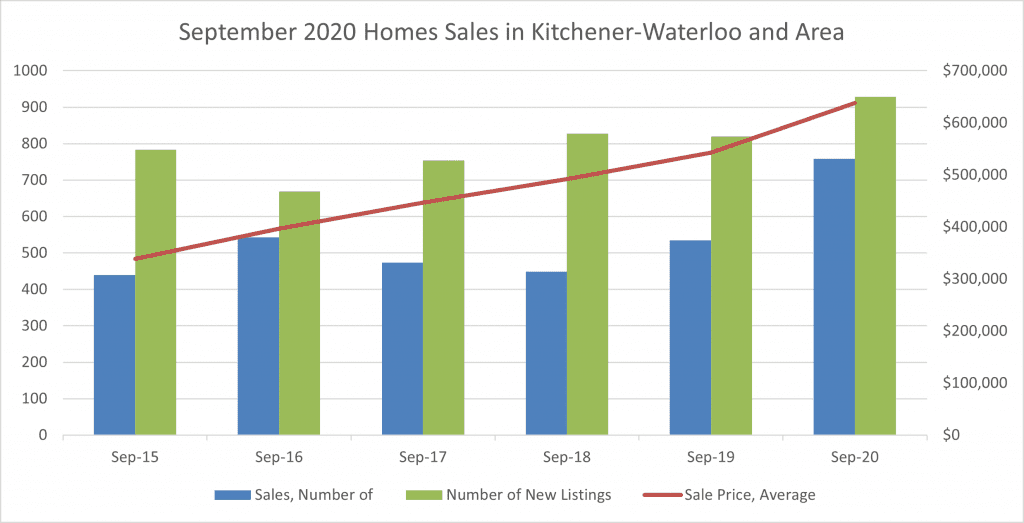
There were 758 residential homes sold through the Multiple Listing System (MLS® System) of the Kitchener-Waterloo Association of REALTORS® in September, the most ever recorded for the month. September’s home sales represented an increase of 41.6 per cent compared to the same month last year, and an increase of 8 per cent compared to the previous month. The previous ten-year average number of residential sales for September is 460.
“This is far more home sales then what we would normally see in September as buyers continue to play catch up from the COVID-19 hindered spring market,” said Colleen Koehler, President of KWAR. “While the pandemic has had devastating impacts on many aspects of our lives it has only solidified the importance of home and homeownership.”
Total residential sales in September included 431 detached homes (up 28.6 per cent from September 2019), and 93 condominium apartments (up 127 per cent). Sales also included 178 townhouses (up 43.5 per cent) and 54 semi-detached homes (up 59 per cent).
The average sale price of all residential properties sold in September increased 17.5 per cent to $637,691 compared to the same month last year, while detached homes sold for an average price of $768,762 an increase of 25 per cent. During this same period, the average sale price for an apartment-style condominium was $390,690 for an increase of 13 per cent. Townhomes and semis sold for an average of $ 476,636 (up 8.7 per cent) and $544,874 (up 16.5 per cent) respectively.
The median price of all residential properties sold in September increased 13.7 per cent to $580,250 and the median price of a detached home during the same period increased 16.5 per cent to $676,000.
“We saw more new listings coming to the market in September which was welcome,” said Koehler. “However, demand continues to outpace supply.”
There were 929 new listings added to the MLS® System in KW and area last month, an increase of 13 per cent compared to September of last year, and 17.7 per cent more than the previous ten-year average for September.
The number of Months Supply (also known as absorption rate) continues to be very low at just 1 month for the month of September. The previous ten-year average supply of homes for September was 3.3 months, and in the past 5 years, the average supply for September was 2.2 months.
The year-to-date number of residential sales has increased 2.6% over 2019 indicating that the decreased activity in April and May has been more than made up in the past four months.
KWAR’s president believes one of the results of the pandemic is that it has forced many employers to realize their staff can in fact work remotely. This has freed employees to migrate from some large urban areas to more affordable areas such as Waterloo Region that offers a higher quality of life.
To help encourage new listings and address our supply shortage, Ontario’s REALTORS® are asking the government to introduce a short-term Land Transfer Tax holiday. More information about this and other proposals can be read in the Ontario Real Estate Association’s (OREA) recently released policy report, Rebuilding Ontario: A Framework for Recovery.
The average days to sell in September was 14 days, compared to 23 days in September 2019.
KWAR cautions that average sale price information can be useful in establishing long term trends but should not be used as an indicator that specific properties have increased or decreased in value. The average sale price is calculated based on the total dollar volume of all properties sold. Months Supply is the inventory of homes for sale at the end of a given month, divided by the average monthly closed sales from the last 12 months Those requiring specific information on property values should contact a local REALTOR®. REALTORS® have their fingers on the pulse of the market. They know the questions to ask, the areas to probe and what to look for so that you get a complete picture of the property and community you are considering.
Tags: buyers, for sale, Homes For Sale, kitchener, kitchener real estate, kitchener-waterloo, kitchener-waterloo association of realtors, KW Market Update, Market Update, real estate, real estate market, realtor, riz jadavji, royal lepage, Royal Lepage Wolle Realty, sales representative, the riz team, waterloo, Waterloo Buyers, waterloo for sale, Waterloo Homes, waterloo real estate, waterloo realtor, Waterloo Sellers
Posted in Market Stats, Market Update | Comments Off on Kitchener Market Snapshot for September 2020
Thursday, September 3rd, 2020
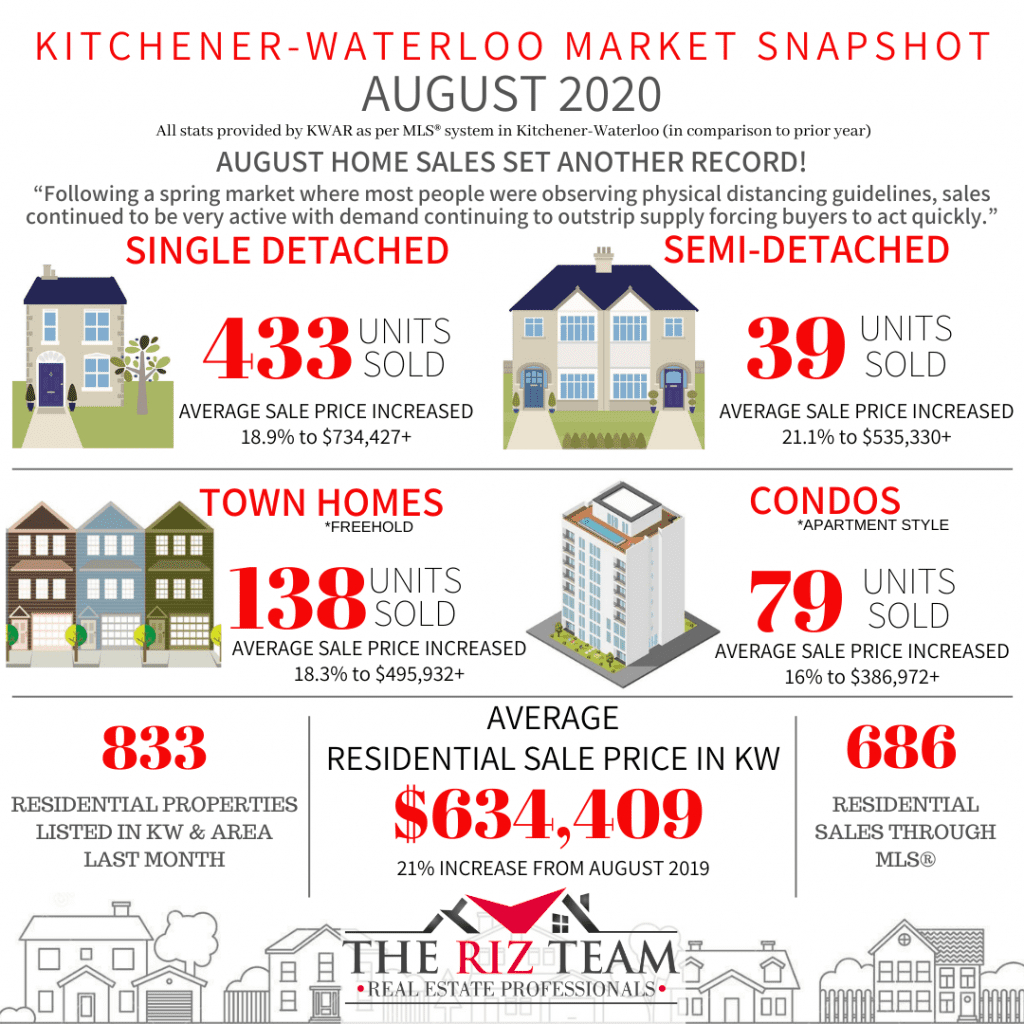
AUGUST HOME SALES SET ANOTHER RECORD
There were 686 residential homes sold through the Multiple Listing System (MLS® System) of the Kitchener-Waterloo Association of REALTORS® in August, the most ever recorded for the month. August’s home sales represented an increase of 48 per cent compared to the same month last year, and a decrease of 8 per cent compared to the previous month. The previous ten-year average number of residential sales for August is 470.
“Waterloo Region has had an extremely hot market all summer,” said Colleen Koehler, President of KWAR. ”Following a spring market where most people were observing physical distancing guidelines, sales in August continued to be very active with demand continuing to outstrip supply forcing buyers to act quickly.”
Total residential sales in August included 433 detached homes (up 61.5 per cent from August 2019), and 79 condominium apartments (up 38.5 per cent). Sales also included 138 townhouses (up 40 per cent) and 39 semi-detached homes (no change).
The average sale price of all residential properties sold in August increased 21 per cent to $634,409 compared to the same month last year, while detached homes sold for an average price of $734,427 an increase of 18.9 per cent. During this same period, the average sale price for an apartment-style condominium was $386,972 for an increase of 16 per cent. Townhomes and semis sold for an average of $495,932 (up 18.3 per cent) and $535,330 (up 21.1 per cent) respectively.
The median price of all residential properties sold in August increased 20.8 per cent to $597,955 and the median price of a detached home during the same period increased 17.4 per cent to $675,000.
“This summer, local home sales rebounded from the COVID-19 slow down we had in the spring,” said Koehler. “While not as heated as July, August sales were another month for the record books, as home buyers returned to the market with renewed intensity.”
There were 833 new listings added to the MLS® System in KW and area last month, an increase of 43.8 per cent compared to August of last year, and 26.4 per cent more than the previous ten-year average for August.
The number of Months Supply (also known as absorption rate) continues to be very low at just 1 month for the month of August. The previous ten-year average supply of homes for August was 3.3 months, and in the past 5 years, the average supply for August was 2.2 months.
The average days to sell in August was 16 days, compared to 26 days in August 2019.
Koehler notes real estate was deemed an essential service from the beginning of the lockdown and REALTORS® have been taking all the necessary precautions to ensure transactions are done safely. KWAR’s president advises consumers to talk to their Realtor® about what measures they will be taking to protect your health and safety as they help you on your real estate journey.
Please note: regular stats charts are not available due to system maintenance. The stats charts will be posted here when available.
Tags: buyers, for sale, Homes For Sale, kitchener, kitchener real estate, kitchener-waterloo, kitchener-waterloo association of realtors, KW Market Update, Market Update, real estate, real estate market, realtor, riz jadavji, royal lepage, Royal Lepage Wolle Realty, sales representative, the riz team, waterloo, Waterloo Buyers, waterloo for sale, Waterloo Homes, waterloo real estate, waterloo realtor, Waterloo Sellers
Posted in Market Stats, Market Update | Comments Off on Kitchener Market Snapshot for August 2020
Saturday, August 8th, 2020
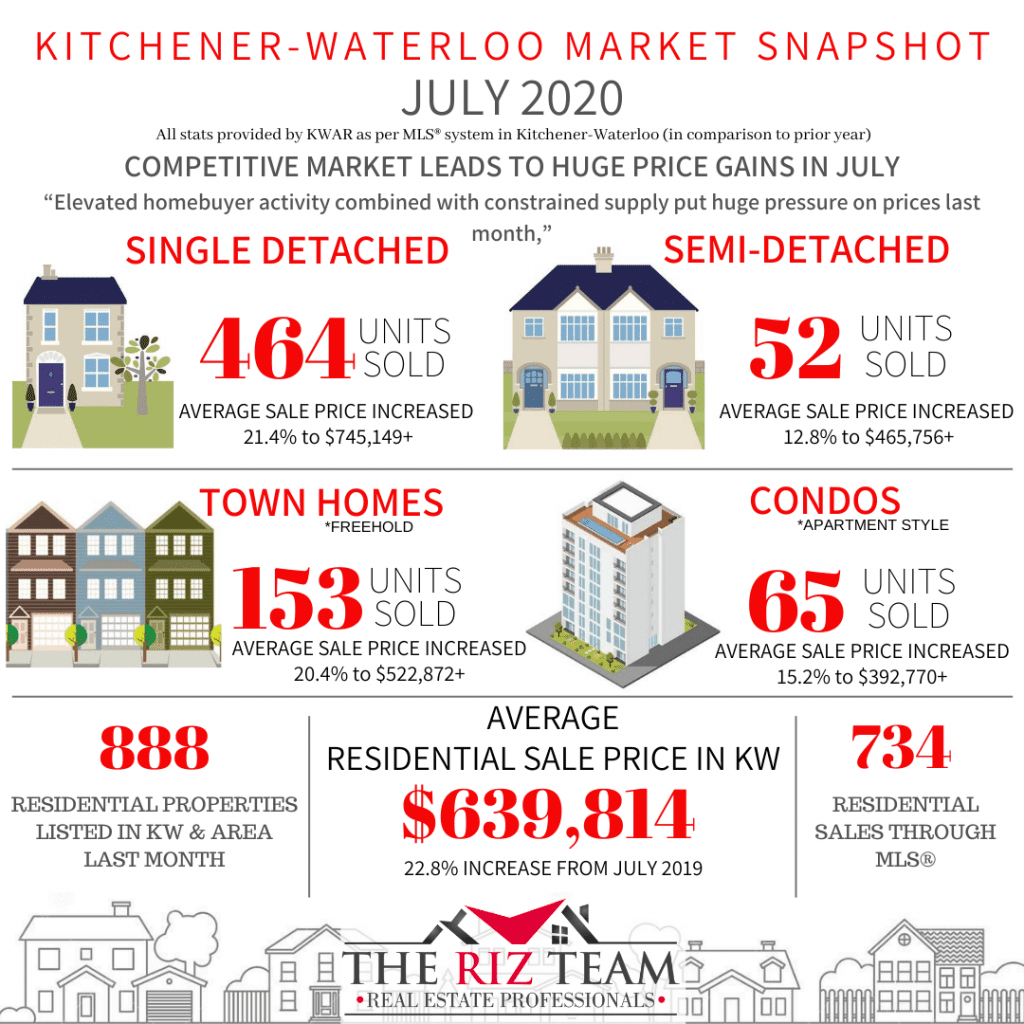
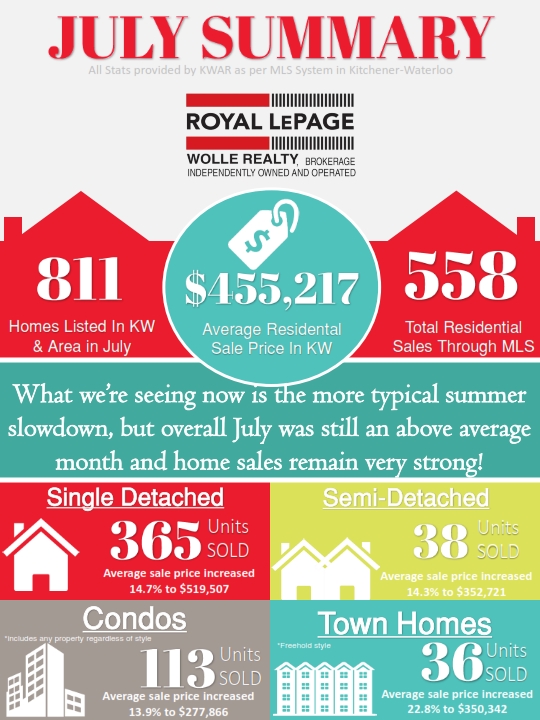
COMPETITIVE MARKET LEADS TO HUGE PRICE GAINS IN JULY
There were 734 residential homes sold through the Multiple Listing System (MLS® System) of the Kitchener-Waterloo Association of REALTORS® in July, an increase of 25.7 per cent compared to the same month last year, and well above the previous ten-year average for July of 531.
“Competition was high for buyers looking to lock down a house in July,” said Colleen Koehler, President of KWAR. “The rate of home sales in July resembled the kind of month we would normally see in May, and I chalk up much of that to the pent up demand that built as we moved into Stage 3 of reopening in mid-July.”
Total residential sales in July included 464 detached homes (up 39.3 per cent from July 2019), and 65 condominium apartments (up 3.2 per cent). Sales also included 153 townhouses (up 4.8 per cent) and 52 semi-detached homes (up 23.8 per cent).
The average sale price of all residential properties sold in July increased 22.8 per cent to $639,814 compared to the same month last year, while detached homes sold for an average price of $745,149 an increase of 21.4 per cent. During this same period, the average sale price for an apartment-style condominium was $392,770 for an increase of 15.2 per cent. Townhomes and semis sold for an average of $465,756 (up 12.8 per cent) and $522,872 (up 20.4 per cent) respectively.
The median price of all residential properties sold in July increased 21.7 per cent to $595,000 and the median price of a detached home during the same period increased 17.4 per cent to $675,000.
“Elevated homebuyer activity combined with constrained supply put huge pressure on prices last month,” said Koehler. “Homebuyers remain very confident about owning a home in Waterloo Region, and with mortgage rates still at near-record-low levels I expect we will continue to see strong home buyer demand going into the fall”.
There were 888 new listings added to the MLS® System in KW and area last month, an increase of 4.3 per cent compared to July of last year, and 15.5 per cent more than the previous ten-year average for July.
The total number of homes available for sale in active status at the end of July was 592, a decrease of 32.6 per cent compared to July of last year.
The number of Months Supply (also known as absorption rate) continues to be very low at just 1.3 months for the month of July, 27.8 per cent below the same period last year. The previous ten-year average supply of homes for July was 3.1 months, and in the past 5 years, the average supply for July was 2.1 months.
The average days to sell in July was 17 days, compared to 22 days in July 2019.
Koehler notes real estate was deemed an essential service from the beginning of the lockdown and REALTORS® have been taking all the necessary precautions to ensure transactions are done safely. KWAR’s president advises consumers talk to their Realtor® about what measures they will be taking to protect your health and safety as they help you on your real estate journey.
KWAR cautions that average sale price information can be useful in establishing long term trends but should not be used as an indicator that specific properties have increased or decreased in value. The average sale price is calculated based on the total dollar volume of all properties sold. Months Supply is the inventory of homes for sale at the end of a given month, divided by the average monthly closed sales from the last 12 months Those requiring specific information on property values should contact a local REALTOR®. REALTORS® have their fingers on the pulse of the market. They know the questions to ask, the areas to probe and what to look for so that you get a complete picture of the property and community you’re considering.
Historical Sales By Property Type

Months Supply of Homes for Sale

Historical Median Sales Price – By Property Type

Historical Average Sales Price – By Property Type

Historical Sales – By Price Range

Average Days on Market

Tags: buyers, for sale, home sales, Homes For Sale, kitchener, kitchener for sale, kitchener real estate, Kitchener Sellers, kitchener-waterloo, kitchener-waterloo association of realtors, KW Market Update, Market Update, real estate, real estate market, realtor, riz jadavji, royal lepage, Royal Lepage Wolle Realty, sales representative, the riz team, waterloo, Waterloo Buyers, waterloo for sale, Waterloo Homes, waterloo real estate, waterloo realtor, Waterloo Sellers, www.rizsellskw.com
Posted in Market Stats, Market Update | Comments Off on Kitchener Market Snapshot for July 2020
Tuesday, July 7th, 2020
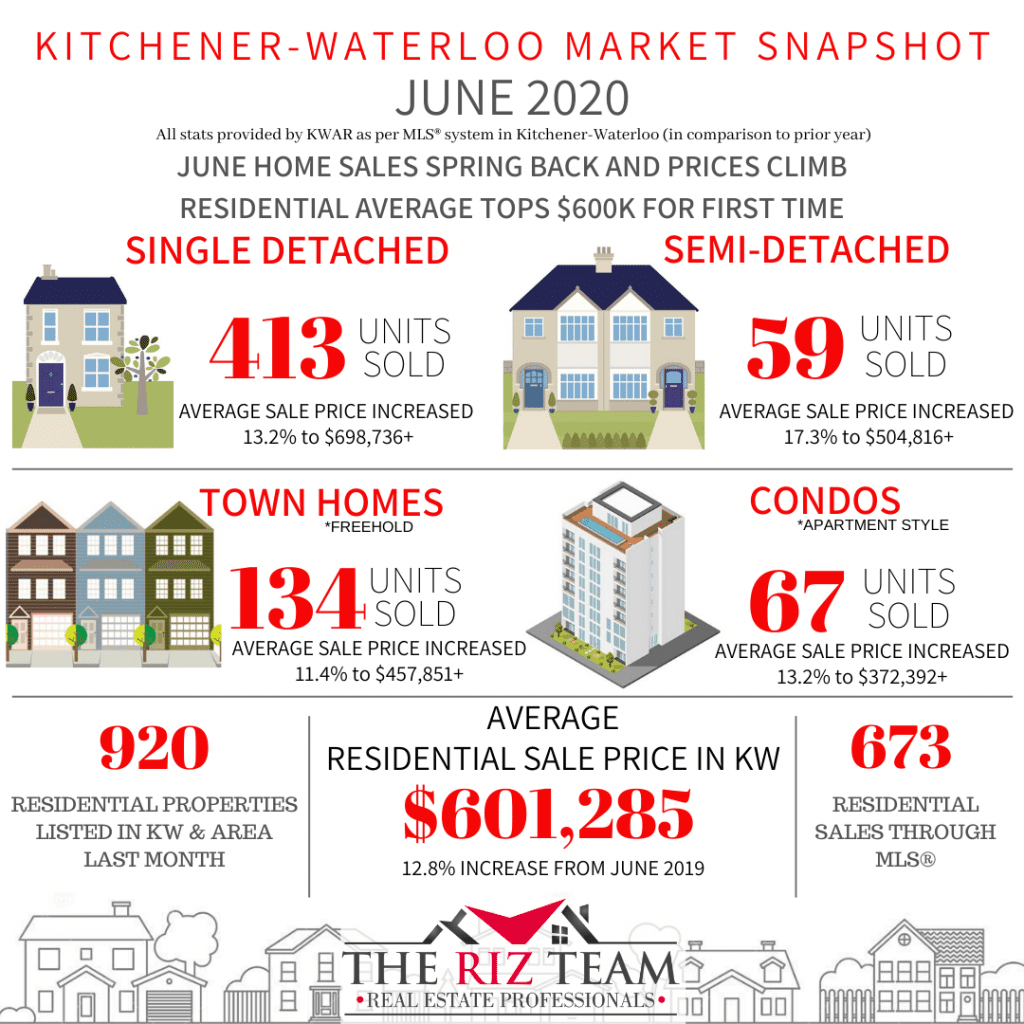
JUNE HOME SALES SPRING BACK AND PRICES CLIMB
RESIDENTIAL AVERAGE TOPS $600K FOR FIRST TIME
KITCHENER-WATERLOO, ON (July 6, 2020) ––The number of homes sold in June shot up 57.6 per cent compared to May. There were 673 residential homes sold through the Multiple Listing System (MLS® System) of the Kitchener-Waterloo Association of REALTORS® in June 2020, an increase of 2.1 per cent compared to June 2019, and an increase of 8.5 per cent compared to the previous 10-year average for June.
“After a pandemic-induced delay to the typical spring market, home sales sprung back to life in a big way in June,” said Colleen Koehler, President of KWAR. “As Waterloo region entered stage two of reopening, we saw many buyers and sellers resuming their home buying and selling plans.”
Total residential sales in June included 413 detached homes (up 1.7 per cent from June 2019), and 67 condominium apartments (up 36.7 per cent). Sales also included 134 townhouses (down 15.7 per cent) and 59 semi-detached homes (up 31.1 per cent).
Total residential sales during this second quarter (April, May, June) are down 33 per cent compared to last year. On a year-to-date basis, they are down 15.6 per cent.
“I expect for the remainder of 2020 will see the number of home sales returning to near historical levels,” says Koehler. “There will be some catching up to do in the coming weeks, but I don’t think you will see the market taking a hiatus this summer.”
The average sale price of all residential properties sold in June increased 12.8 per cent to $601,285 compared to the same month last year, while detached homes sold for an average price of $698,736 an increase of 13.2 per cent. During this same period, the average sale price for an apartment-style condominium was $372,392 for an increase of 13.2 per cent. Townhomes and semis sold for an average of $457,851 (up 11.4 per cent) and $504,816 (up 17.3 per cent) respectively.
The median price of all residential properties sold in June increased 14.4 per cent to $564,000 and the median price of a detached home during the same period increased 11.9 per cent to $650,000.
There were 920 new listings added to the MLS® System in KW and area last month, the most added in a single month since May of last year, and 1.9 per cent more than the previous ten-year average for June.
The total number of homes available for sale in active status at the end of June was 640, a decrease of 28.7 per cent compared to June of last year.
The number of Months Supply (also known as absorption rate) continues to be very low at just 1.4 months for the month of June, 22.2 per cent below the same period last year. The previous ten-year average supply of homes for June was 3.22 months, and in the past 5 years, the average supply for June was 2.22 months.
The average days to sell in June was 16 days, compared to 20 days in June 2019.
Koehler notes real estate was deemed an essential service from the beginning of the lockdown and REALTORS® have been taking all the necessary precautions to ensure transactions are done safely. KWAR’s president advises consumers to talk to their Realtor® about what measures they will be taking to protect your health and safety as they help you on your real estate journey.
Historical Sales By Property Type

Months Supply of Homes For Sale

Historical Median Sales Price – By Property Type

Historical Average Sales Price – By Property Type

Historical Sales – By Price Range

Average Days on Market

Tags: 2020, buyers, for sale, home sales, homes, Homes For Sale, June, kitchener, kitchener real estate, kitchener-waterloo, kitchener-waterloo association of realtors, KW Market Update, KW Realtor, Kwawesome, Market Report, Market Update, MLS, Ontario, real estate, Real Estate Board, real estate market, realtor, realtors, riz jadavji, royal lepage, Royal Lepage Wolle Realty, sales representative, Stats, Stats Release, Stats Report, the riz team, Top Team, waterloo, Waterloo Buyers, waterloo for sale, Waterloo Homes, waterloo real estate, waterloo realtor, waterloo region, Waterloo Sellers
Posted in Market Stats, Market Update | Comments Off on Kitchener Market Snapshot for June 2020
Thursday, May 7th, 2020
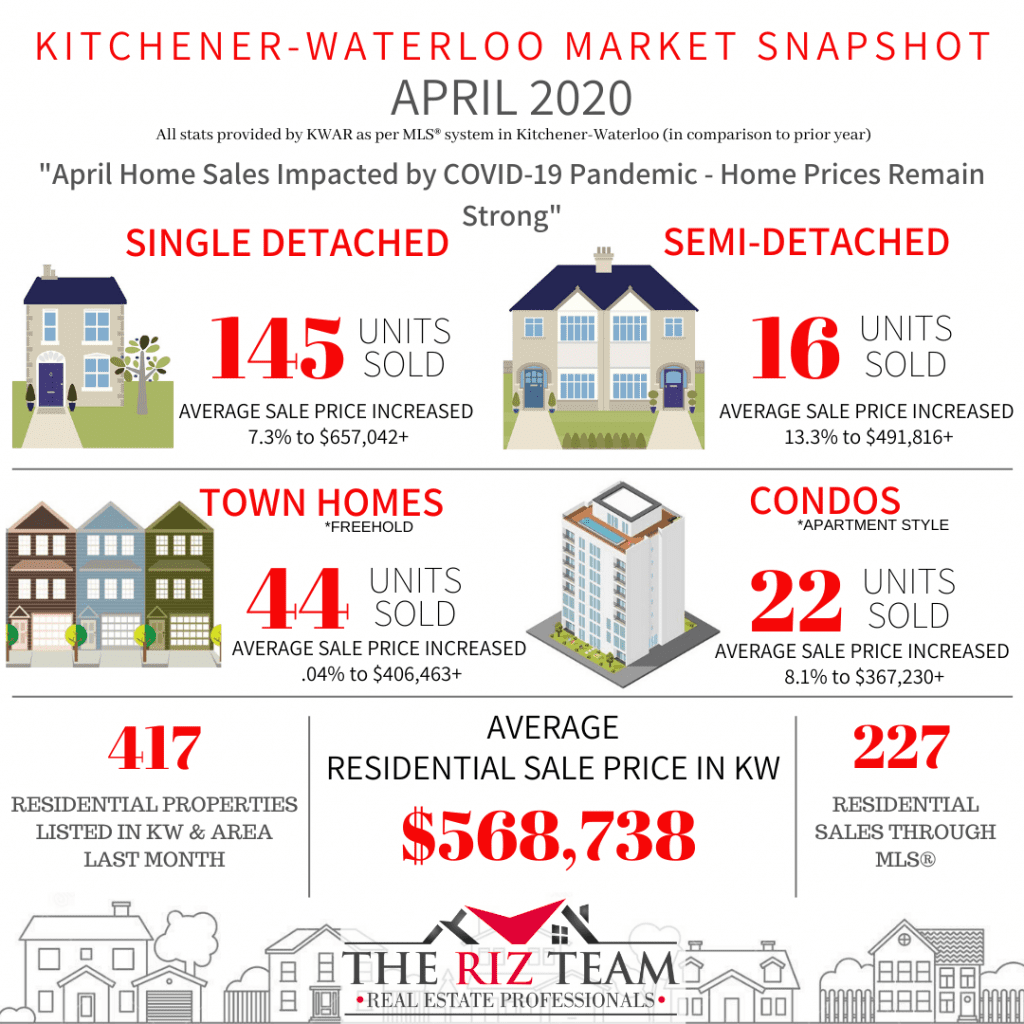
KITCHENER-WATERLOO, ON (May 4, 2020) ––There were 227 residential homes sold through the Multiple Listing System (MLS® System) of the Kitchener-Waterloo Association of REALTORS® in April, a decrease of 63.6 per cent compared to the same month last year, and the lowest number of sales in a single month since December 2008.
“It goes without saying the current pandemic has had a major impact on the number of sales we would normally see in April,” says Colleen Koehler, President of KWAR. “With everyone doing their part to flatten the curve and doing their best to self-isolate, the buying and selling of homes have been greatly reduced.”
Total residential sales in April included 145 detached homes (down 63.3 per cent), and 22 condominium apartments (down 71.1 per cent). Sales also included 44 townhouses (down 61.1 per cent) and 16 semi-detached homes (down 60 per cent).
The average sale price of all residential properties sold in April increased 7.3 per cent to $568,738 compared to the same month last year, while detached homes sold for an average price of $657,042 an increase of 7.3 per cent. During this same period, the average sale price for an apartment-style condominium was $367,230 for an increase of 8.1 per cent. Townhomes and semis sold for an average of $406,463 (up 0.4 per cent) and $491,816 (up 13.3 per cent) respectively.
The median price of all residential properties sold in April increased by 7.1 per cent to $525,000 and the median price of a detached home during the same period increased 6.3 per cent to $605,000.
While still deemed an essential service, REALTORS® listed considerably fewer homes in April due to the current state of emergency. There were 417 new listings added to the MLS® System in KW and area last month, a decrease of 54.8 per cent compared to April of 2019, far fewer than the previous 10-year average of 937 listings in April.
The total number of homes available for sale in active status at the end of April was 571, a decrease of 36.6 per cent compared to April of last year.
The number of Months Supply (also known as absorption rate) continues to be very low at just 1.2 months for the month of April, 36.8 per cent below the same period last year. The previous ten-year average supply of homes for April was 2.95 months, and in the past 5 years, the average supply for April was 2.12 months.
Koehler says most REALTORS® are advising sellers to hold off on listing their properties until after the state of emergency has been lifted. However, not every seller or buyer has that option which is why real estate was deemed an essential service. Realtors who have been working with buyers and sellers through this unprecedented time have been carefully following the guidelines of health Canada and taking all the necessary precautions to protect themselves and their clients. “In addition to health safety measures, our members are quickly adapting to new ways of showing property by conducting virtual showings for their clients, and other innovative practices,” says Koehler.
The president of KWAR is confident that despite the current pandemic, the slowdown in housing sales will be temporary. “It has been a strong sellers’ market for the past few years with buyers competing for a scare number of listings.” Now for the first time in a long time, April saw some balance with a sales-to-new-listings ratio of 54 percent – well within the balanced threshold. “We have witnessed some buyers expecting homes to sell at greatly reduced amounts, and frankly, that’s simply not the case. Home values have remained stable which we expect will continue,” says Koehler.
The average days to sell in April was 19 days, compared to 21 days in April 2019.
KWAR cautions that average sale price information can be useful in establishing long term trends but should not be used as an indicator that specific properties have increased or decreased in value. The average sale price is calculated based on the total dollar volume of all properties sold. Months Supply is the inventory of homes for sale at the end of a given month, divided by the average monthly closed sales from the last 12 months Those requiring specific information on property values should contact a local REALTOR®. REALTORS® have their fingers on the pulse of the market. They know the questions to ask, the areas to probe and what to look for so that you get a complete picture of the property and community you’re considering.
Historical Sales By Property Type

Months Supply of Homes for Sale

Historical Median Sales Price – By Property Type

Historical Average Sales Price – By Property Type

Historical Sales – By Price Range

Average Days on Market

Tags: buyers, for sale, Homes For Sale, kitchener, kitchener for sale, kitchener real estate, kitchener-waterloo, kitchener-waterloo association of realtors, KW Market Update, KW Real Estate, Market Update, real estate, real estate market, realtor, riz jadavji, royal lepage, Royal Lepage Wolle Realty, sales representative, the riz team, waterloo, Waterloo Buyers, waterloo for sale, Waterloo Homes, waterloo real estate, waterloo realtor, Waterloo Sellers
Posted in Market Stats, Market Update, Newsletter, Real Estate News | Comments Off on Kitchener Market Snapshot for April 2020
Friday, March 6th, 2020
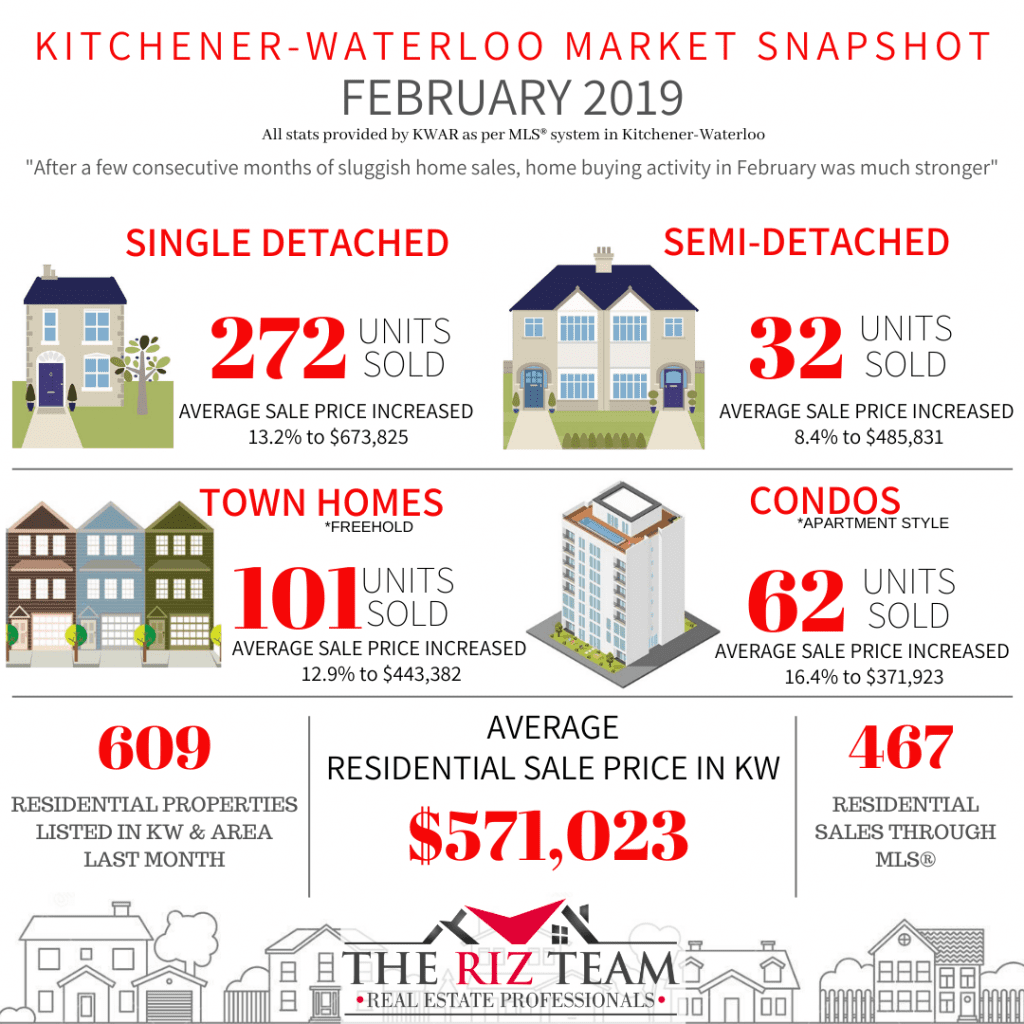
STRONG HOME SALES IN FEBRUARY
KITCHENER-WATERLOO, ON (March 5, 2020) ––There were 467 residential homes sold through the Multiple Listing System (MLS® System) of the Kitchener-Waterloo Association of REALTORS® in February, an increase of 36.5 per cent compared to the same month last year, and 15.3 per cent above the previous 10-year average.
“After a few consecutive months of sluggish home sales, home buying activity in February was much stronger,” says Colleen Koehler, President of KWAR.
Total residential sales in February included 272 detached homes (up 52 per cent), and 62 condominium units (up 14.8 per cent) which includes any property regardless of style (i.e. semis, townhomes, apartment, detached etc.). Sales also included 32 semi-detached homes (up 33.3 per cent) and 101 freehold townhouses (up 18.8 per cent).
The average sale price of all residential properties sold in February increased 16.3 per cent to $571,023 compared to the same month last year, while detached homes sold for an average price of $673,825 an increase of 13.2 per cent. During this same period, the average sale price for an apartment-style condominium was $371,923 for an increase of 16.4 per cent. Townhomes and semis sold for an average of $443,382 (up 12.9 per cent) and $485,831 (up 8.4 per cent) respectively.
The median price of all residential properties sold in February increased 18.2 per cent to $550,050 and the median price of a detached home during the same period increased 18.6 per cent to $630,000.
“Like many other markets across the province, the story of our local housing market continues to be one of supply and demand,” says Koehler. “Market-wide, the number of homes available for sale is simply not keeping up with the number of people wanting to purchase a home in the Kitchener-Waterloo area.”
REALTORS® listed 609 residential properties in KW and area last month, an increase of 7.8 per cent compared to February of 2019, and a decrease of 5.9 per cent in comparison to the previous ten-year average for February. The total number of homes available for sale in active status at the end of February was 447, a decrease of 39.4 per cent compared to February of last year, and 62 per cent below the previous ten-year average of 1,179 listings for February. The number of Months Supply (also known as absorption rate) in February was just 0.9 months, 40 per cent below the same period last year. The previous ten-year average supply of homes for February was 2.55 months, and in the past 5 years the average supply for February was 1.76 months.
KWAR’s president points out that now more than ever sellers should avail themselves of a REALTOR®. “With a multitude of buyers jumping on a scarcity of properties for sale, many homes are selling for more than the asking price. A REALTOR® will ensure you have maximum exposure to these buyers through the MLS® System and will manage the intricate process of any multiple offers professionally.”
The average days to sell in February was 17 days, compared to 26 days in February 2019.
KWAR cautions that average sale price information can be useful in establishing long term trends but should not be used as an indicator that specific properties have increased or decreased in value. The average sale price is calculated based on the total dollar volume of all properties sold. Months Supply is the inventory of homes for sale at the end of a given month, divided by the average monthly closed sales from the last 12 months Those requiring specific information on property values should contact a local REALTOR®. REALTORS® have their fingers on the pulse of the market. They know the questions to ask, the areas to probe and what to look for so that you get a complete picture of the property and community you’re considering.
Historical Sales By Property Type

Months Supply of Homes for Sale

Historical Median Sales Price – By Property Type

Historical Average Sales Price – By Property Type

Historical Sales – By Price Range

Average Days on Market

Tags: buyers, for sale, Homes For Sale, kitchener, kitchener real estate, kitchener-waterloo, kitchener-waterloo association of realtors, KW Market Update, Market Update, real estate, real estate market, realtor, riz jadavji, royal lepage, Royal Lepage Wolle Realty, sales representative, the riz team, waterloo, Waterloo Buyers, waterloo for sale, Waterloo Homes, waterloo real estate, waterloo realtor, Waterloo Sellers
Posted in Market Stats | Comments Off on Kitchener Market Snapshot for February 2020
Monday, January 6th, 2020
Kitchener Market Snapshot for 2019
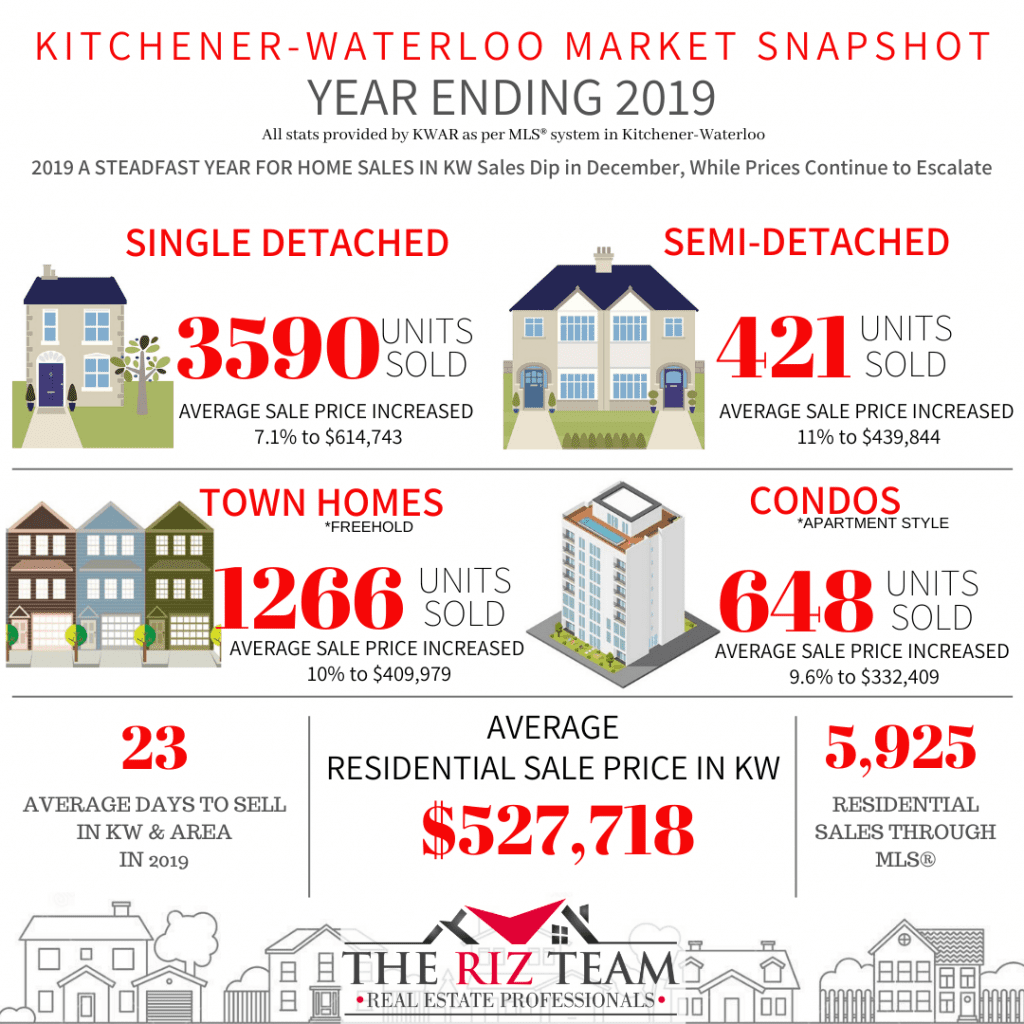
2019 A STEADFAST YEAR FOR HOME SALES IN KW
Sales Dip in December, While Prices Continue to Escalate
KITCHENER-WATERLOO, ON (Jan 6, 2020) ––There were 5,925 residential homes sold through the Multiple Listing System (MLS® System) of the Kitchener-Waterloo Association of REALTORS® in 2019, an increase of 1.6 per cent compared to 2018. Contrasted to past years, 2019’s annual sales were 2.3 per cent below the previous 5-year average, and 3 per cent above the previous 10-year average.
On a monthly basis, sales dipped 9 percent compared to last year, with 244 home sales in the month of December.
“Overall, it was a steadfast pace of home sales in 2019,” says Colleen Koehler, President of KWAR. “When annual home sales in Kitchener-Waterloo hit near 6000 transactions, I consider it to be a strong real estate market.”
Total residential sales in 2019 included 3,590 detached (up 5.9 per cent), and 648 condominium units (down 7.8 per cent) which includes any property regardless of style (i.e. semis, townhomes, apartment, detached etc.). Sales also included 421 semi-detached homes (down 0.7 per cent) and 1,266 freehold townhouses (down 3.7 per cent).
The average sale price of all residential properties sold in 2019 increased 9.3 per cent to $527,718 compared to 2018. Detached homes sold for an average price of $614,743 an increase of 7.1 per cent compared to 2018. During this same period, the average sale price for an apartment style condominium was 332,409 for an increase of 9.6 per cent. Townhomes and semis sold for an average of $409,979 (up 10 per cent) and $439,844 (up 11 per cent) respectively.
The median price of all residential properties sold last year increased 10.1 per cent to $490,000 and the median price of a detached home during the same period increased 8.6 per cent to $570,000.
“In 2019, the lack of supply continued to be a hurdle for anyone who was trying to buy their first home, move-up from their current residence, or downsize. This ongoing state of the market caused further escalation of home prices in 2019. With interest rates expected to stay low in the year ahead combined with Waterloo region’s ongoing growth, I expect 2020 will see more price gains alongside a steady increase in sales,” says Koehler.
The number of months of inventory averaged 1.5 throughout the year, hitting its highest point in May when there was 2.1 months of supply, and ending the year at 0.7 (3-4 months supply is historically normal for Waterloo region). The average days to sell in 2019 was 23 days, compared to 24 days in 2018 and a previous 10-year average of 38 days.
Dollar volume of all residential real estate sold last year increased 10.9 per cent to $3.1 Billion compared with 2018.
While the majority of residential MLS® System activity is properties for sale, REALTORS® are increasingly representing landlords and tenants. Last year 733 residential leases occurred through KWAR’s MLS® System, which is on par with last year and, 2.5 times as many as just four years ago.
Historical Sales by Property Type

Months Supply of Homes for Sale

Historical Median Sales Price – By Property Type

Average Sales Price – By Property Type

Historical Sales – By Price Range

Average Days on Market

Tags: buyers, for sale, Homes For Sale, kitchener, kitchener real estate, kitchener-waterloo, kitchener-waterloo association of realtors, KW Market Update, Market Update, real estate, real estate market, realtor, riz jadavji, royal lepage, Royal Lepage Wolle Realty, sales representative, the riz team, waterloo, Waterloo Buyers, waterloo for sale, Waterloo Homes, waterloo real estate, waterloo realtor, Waterloo Sellers
Posted in Market Stats, Market Update | Comments Off on Kitchener Market Snapshot for 2019
Tuesday, July 7th, 2015
What goes under foot is seldom an easy decision. Colour, surface texture, room usage and price all come into play. Today, greener options abound, adding to the myriad of choices already available.
Increasing interest in incorporating renewable resources into the home has resulted in many beautiful eco-friendly flooring options.
For homeowners looking on the greener side, it’s worth a look at the many sustainable products available today:
• Give a tree another lease on life with salvaged wood flooring. A rustic look can be created with reclaimed wood. Buying reclaimed lumber continues to get easier, and in some instances, less expensive relative to the cost of new hardwoods.
• Bamboo is a good option for rooms with low humidity. High abundance and a natural look make sustainable bamboo an attractive flooring option. Bamboo grows to maturity in three to five years, about a quarter of the time it takes to grow trees used for hardwood.
• Linoleum flooring has retained its popularity over decades. Unlike vinyl flooring, which is a synthetic product made of chlorinated petrochemicals, linoleum is manufactured from natural compounds including linseed oil, cork dust, tree resins and ground limestone. With natural, renewable elements used in its manufacturing, this eco-friendly flooring option continues to remain a popular option.
• Cork flooring has many eco-friendly attributes. Like bamboo, cork is quickly renewable. It is harvested from the bark of the cork oak tree and grows back every three years. Cork has anti-microbial properties to reduce allergens, is fire retardant and provides a comfortable feel under foot. Cork flooring can be finished in a variety of paints and stains to complement any room setting.
• Polyester (P.E.T.) Berber carpet is a sustainable option made of recycled plastic bottles. Anytime we can reuse these materials, we reduce the amount of new materials being manufactured and we reduce non-biodegradable materials in our landfills. Polyester Berber is spill resistant and comes in a variety of aesthetically – pleasing colours and patterns.
Whatever your home’s style or design, an eco-friendly flooring option exists to complement the desired look and existing patterns.
Tags: buyers, easy home improvement tips, for sale, home, home sales, home staging, Homes For Sale, house, housing, kitchener, Kitchener Buyers, kitchener for sale, Kitchener Homes, kitchener real estate, kitchener realtor, Kitchener Sellers, kitchener-waterloo, kitchener-waterloo association of realtors, kw, MLS, preparing to sell, real estate, real estate market, realtor, riz jadavji, Riz Sells KW, rizsellskw.com, royal lepage, Royal Lepage Wolle Realty, seller's tips, waterloo, waterloo real estate, waterloo realtor, Waterloo Sellers, www.rizsellskw.com
Posted in Enhance Your Home, For Sale, From The Riz Team, Kitchener Buyers, Kitchener Sellers, Real Estate Listings, Real Estate News, Realtor Tips, Uncategorized, Waterloo Buyers, Waterloo Sellers | Comments Off on Flooring choices on the greener side!
Monday, June 22nd, 2015
Helpful hints in making a small room appear bigger!
Small rooms are the bane of the home decorator. How do you achieve a pleasing look that doesn’t feel cramped and claustrophobic? Short of building an addition or knocking down walls, you are limited to a few, but effective, decorating tricks that create the illusion of space.
The strategic use of colour and light is the best way to achieve this. Choose light shades of paint or wallpaper for the walls. Lighter colours reflect light making for a brighter room. Use an even lighter shade of the same colour or white for ceilings and floors. A darker colour on the ceiling will make the ceiling look lower and tends to make the walls look as though they are closing in.
Avoid harshly contrasting colours. In fact, a monochromatic colour scheme that carries throughout the room into fabrics and accessories is very effective. Steer away from too many patterned items. The goal here is to blur perspective.
Anything you can do to bring light into the room will also give the effect of increased space. A corner wall sconce that casts light up onto the wall works well. Try to vary lighting effects for interest. A skylight is a great way to add light to a room, but isn’t always practical or affordable. Mirrors are a great solution for small rooms. Place mirrors directly across from another for maximum impact. A mirror placed across from a window is also effective. Place a lamp in front of a mirror to add more light to your room.
If you have wood or patterned flooring, have it installed so that the lines run diagonally across the room. This makes for longer lines, which give the appearance of a larger space. When furnishing the room, pick objects that are proportioned to the size of the room. For example, opt for a loveseat over a full-sized sofa. Lastly, keep the clutter to a minimum. Avoid using a lot of knick-knacks and keep the room tidy and well organized.
Tags: buyers, easy home improvement tips, for sale, home, home sales, home staging, Homes For Sale, house, housing, Kitchener Buyers, kitchener for sale, kitchener real estate, kitchener realtor, kitchener-waterloo association of realtors, preparing to sell, real estate market, riz jadavji, Riz Sells KW, rizsellskw, rizsellskw.com, royal lepage, Royal Lepage Wolle Realty, sales, sales representative, seller's tips, waterloo, waterloo for sale, Waterloo Homes, waterloo real estate, waterloo realtor, Waterloo Sellers, www.rizsellskw.com
Posted in Enhance Your Home, From The Riz Team, Kitchener Buyers, Kitchener Sellers, Real Estate Listings, Real Estate News, Realtor Tips, Uncategorized, Waterloo Buyers, Waterloo Sellers | Comments Off on Looking to Make a Small Room Appear Bigger??