Kitchener-Waterloo Market Snapshot March 2022
Monday, April 4th, 2022KITCHENER-WATERLOO HOME SALES UP IN MARCH, AVERAGE PRICE DIPS FROM FEBRUARY
“The skyrocketing prices of the last two months took a bit of a breather in March, with the overall average price dipping five per cent compared to what we saw in February,” said Megan Bell, President of KWAR. “While it is too soon to draw conclusions from just one month of home sales, I know many will be comforted to see a leveling off on the average price, no matter how incremental.”
If you are considering to Sell your home or Buy a home in the next short while it would be highly beneficial for you to connect with one of our Team Agents at
The Riz Team
Do you want to know what your home is worth today? Click Below for our Online No Obligation Market Evaluation
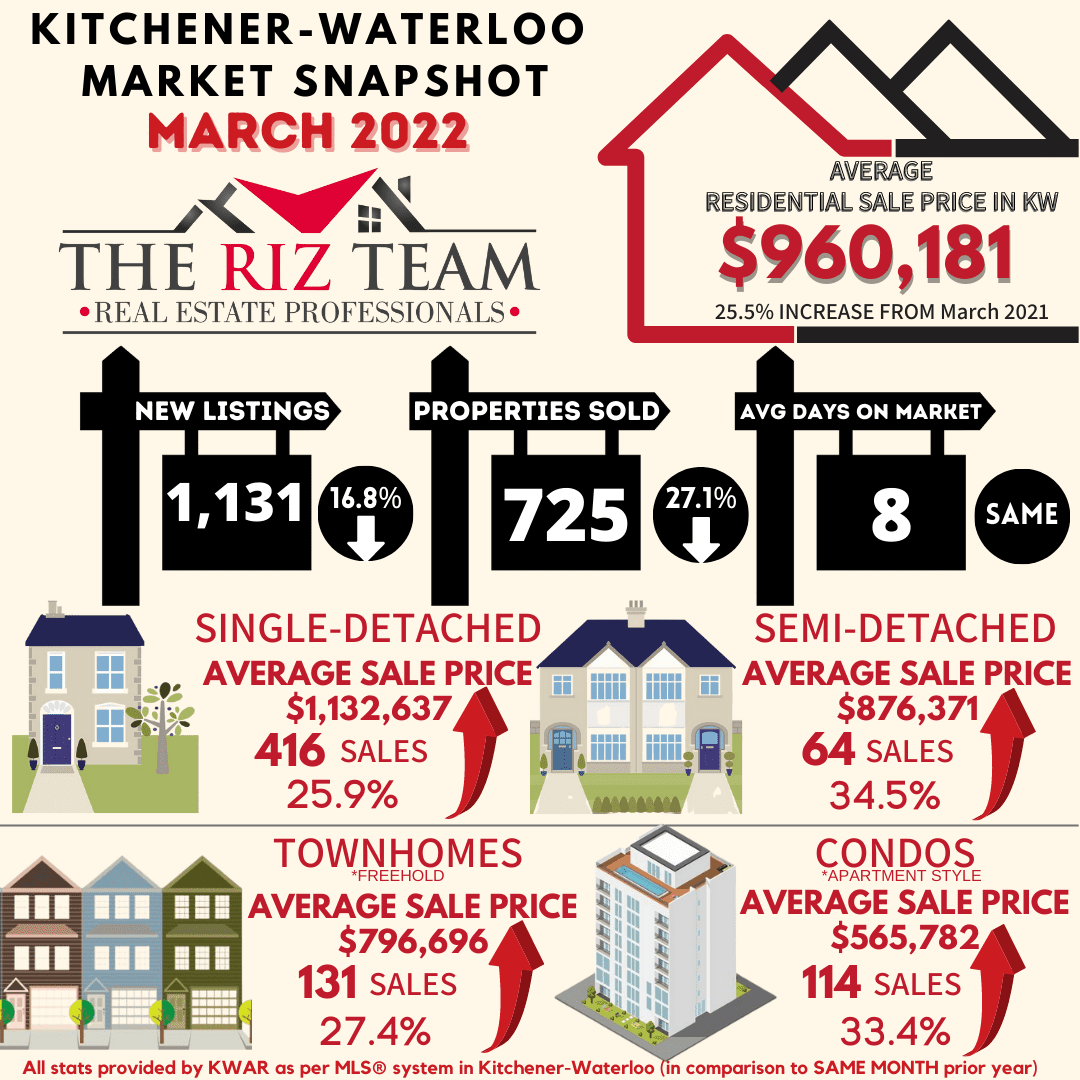
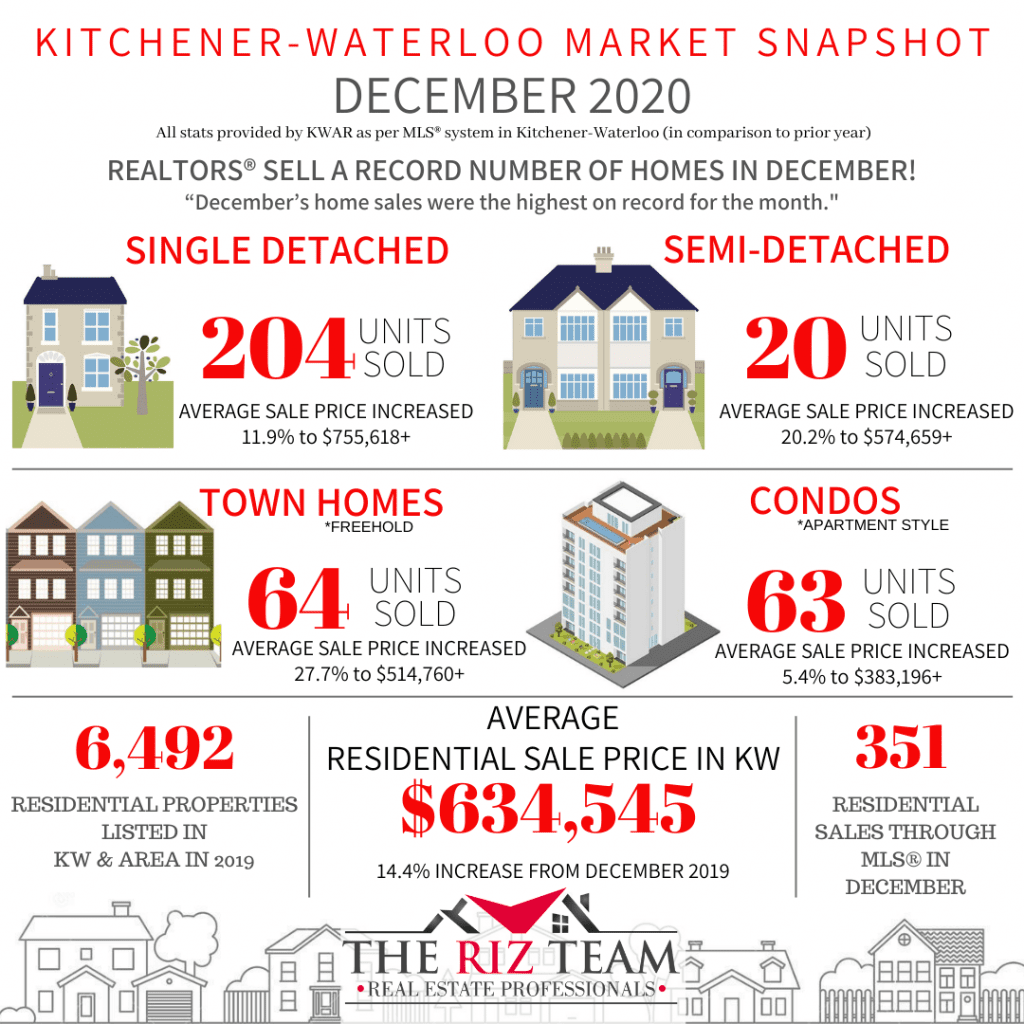
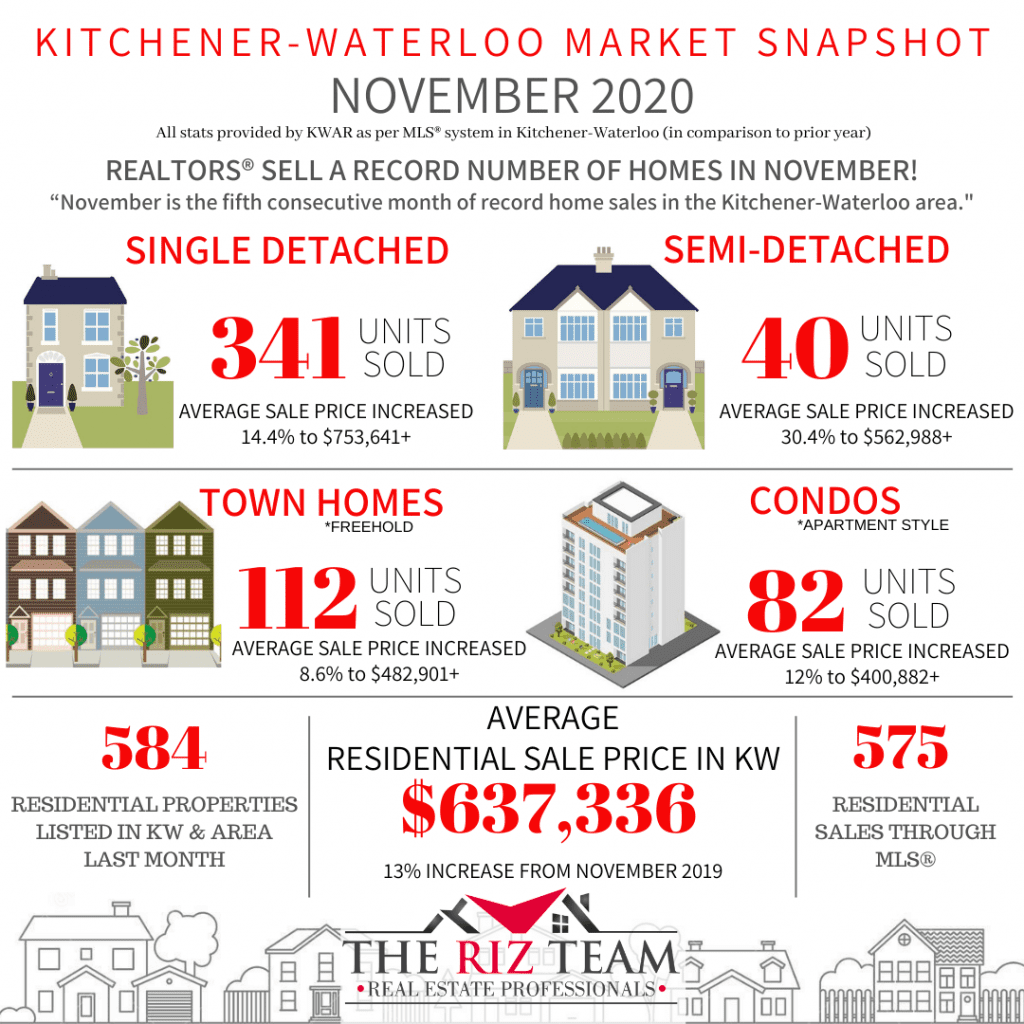
Total residential sales in March included 416 detached (down 29.7 per cent from March 2021), and 114 condominium units (down 9.5 per cent). Sales also included 64 semi-detached homes (down 17.9 per cent) and 131 townhouses (down 33.8 per cent).
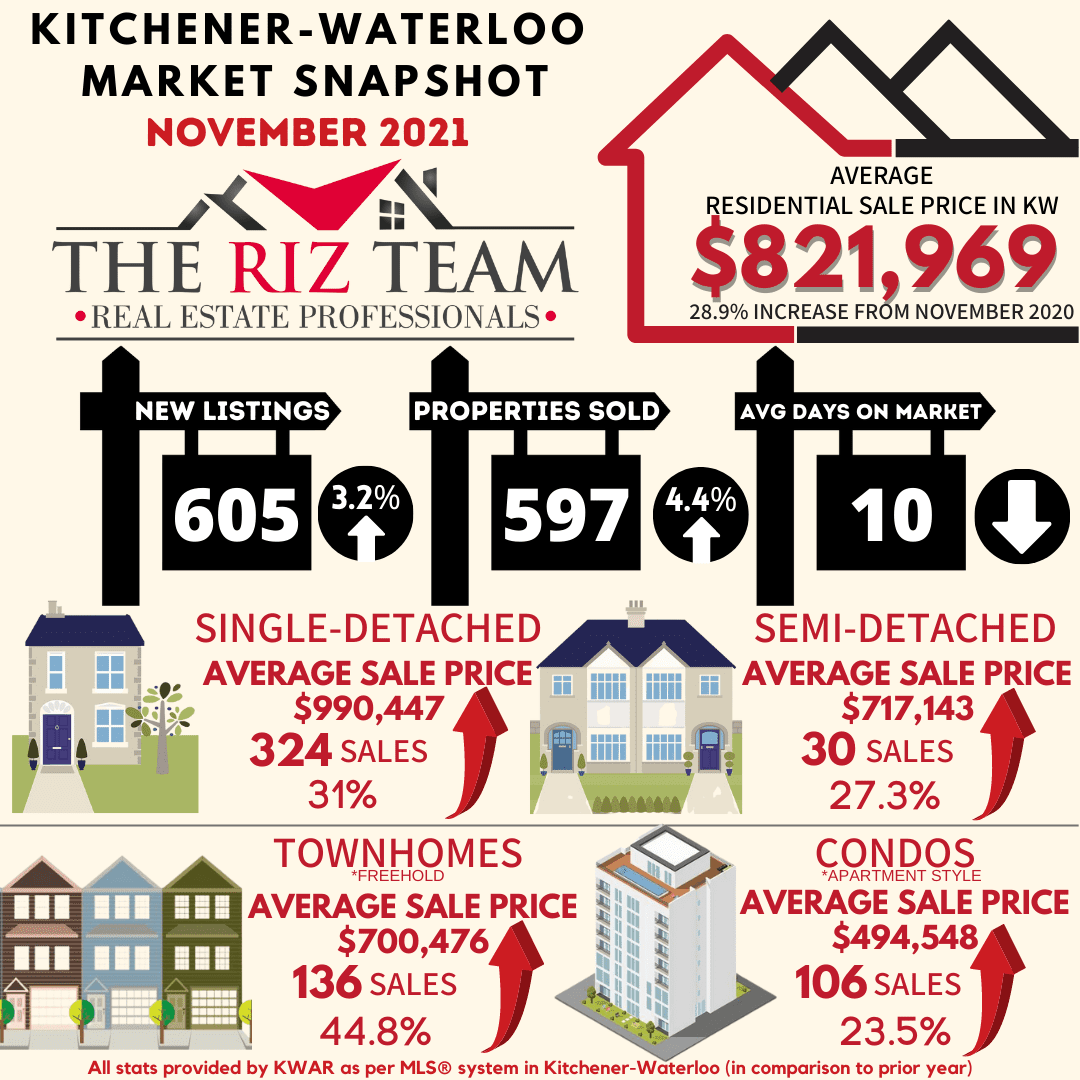
In March, the average sale price for all residential properties in the Kitchener-Waterloo area was $960,181. This represents a 25.5 per cent increase over March 2021 and a 4.6 per cent decrease compared to February 2022.
- The average price of a detached home was $1,132,637. This represents a 25.9 per cent increase from March 2021 and a decrease 6.4 per cent compared to February 2022.
- The average sale price for an apartment-style condominium was $565,782. This represents an increase of 33.4 per cent from March 2021 and a decrease of 1.2 per cent compared to February 2022.
- The average sale price for a townhouse was $796,696. This represents a 27.4 per cent increase from March 2021 and a decrease of 7.6 per cent compared to February 2022.
- The average sale price for a semi was $876,371. This represents an increase of 34.5 per cent compared to March 2021 and a decrease of 5.0 per cent compared to February 2022.

KWAR cautions that average sale price information can be useful in establishing long-term trends but should not be used as an indicator that specific properties have increased or decreased in value. The MLS®® Home Price Index (HPI) provides the best way to gauge price trends because averages are strongly distorted by changes in the mix of sales activity from one month to the next.
The MLS® HPI composite benchmark price for all residential properties in Kitchener-Waterloo was $960,100 in March. This represents a 29.6 per cent increase over March 2021 and a 1.5 per cent decrease compared to February 2022.
- The benchmark price for a detached home was $1,046,200. This represents a 28.1 per cent increase from March 2021 and 4.0 per cent decrease compared to February 2022.
- The benchmark price for an apartment-style condominium was $484,000. This represents a 32.9 per cent increase from March 2021 and a 4.2 per cent increase compared to February 2022.
- The benchmark price for a townhouse is $765,500. This represents a 41.3 per cent increase from March 2021 and a 4.9 per cent increase compared to February 2022.
-

“Even though the average price decreased across all property types on a month-to-month basis, the MLS® HPI showed continued monthly gains for both townhouse and apartment property types,” notes Bell. “As the province feels its way out of the pandemic, we are beginning to see some very preliminary signs of a potential cooling. We are not seeing quite as many multiple offers and some offers are coming in with conditions. Of course, when we say cooling, we’re talking about a market that has been scorching hot which is why we are pleased to see this happening.”
There were 1,131 new listings added to the MLS® System in KW and area last month, a decrease 16.8 per cent compared to the record topping number of listings added in March of last year, and a 28.0 per cent increase compared to the previous ten-year average for March.
The total number of homes available for sale in active status at the end of March was 441, an increase of 1.1 per cent compared to March of last year, and 59.0 per cent below the previous ten-year average of 1,072 listings for March.
The number of months of inventory nudged up to 0.7 months in March from 0.5 months in February. Inventory has been under the one-month mark since October 2020. The number of months of inventory represents how long it would take to sell off current inventories at the current rate of sales.
The average number of days to sell in March was 8 days, the same as it was in March 2021. The previous 5-year average is 16 days.
The More Homes for Everyone Act
Statement from KWAR President Megan Bell
Last week the Government of Ontario introduced a new bill, the More Homes for Everyone Act to address the province’s housing affordability crisis.
While we welcome several aspects of the proposed More Homes for Everyone bill, such as measures to support more timely municipal decision making and developing policies and tools to support multi-generational homes in existing neighbourhoods—bolder actions to increase supply were notably missing.
Ontario’s Housing Affordability Task Force had recommended limiting exclusionary zoning and allowing “as of right” residential housing up to four units and up to four storeys on a single residential lot. Instead, the government has committed to the Task Force’s recommendations as part of a “long term roadmap”.
KWAR is optimistic Waterloo Region will be bold about housing in their official plan update
Ending exclusionary zoning to allow for gentle density in our neighbourhoods is critical to filling the lack of “missing middle” supply for family-sized households.
While Minister Clark states that some municipalities (such as Toronto and Mississauga) were not ready, KWAR is optimistic that the Region of Waterloo (ROW) will take a more progressive view toward increasing density. On the development side, the Waterloo region has been exceeding density targets set by the province. At KWAR’s recently held Where Do We Grow From Here Symposium we learned from the ROW’s Commissioner, Rod Regier the Region is proposing policies for the ROW official plan that would see a tiered approach to missing middle housing by allowing 4 units and up to 4 storeys, as-of-right, on all land currently zoned residential and on any new greenfield land (residential); and allow a range of 8 to 12 storeys, along specific corridors, such as the ION corridor.
KWAR encourages the Region of Waterloo to stay the course on its bold proposals for its Regional Official Plan and create ways to bring a broad range of housing options to our community.
Those requiring specific information on property values should contact a local REALTOR®. Working with a Realtor is the best way to get a complete picture of the property and community you are considering.
View our HPI tool here to learn more: https://kwar.ca/hpi-dashboard
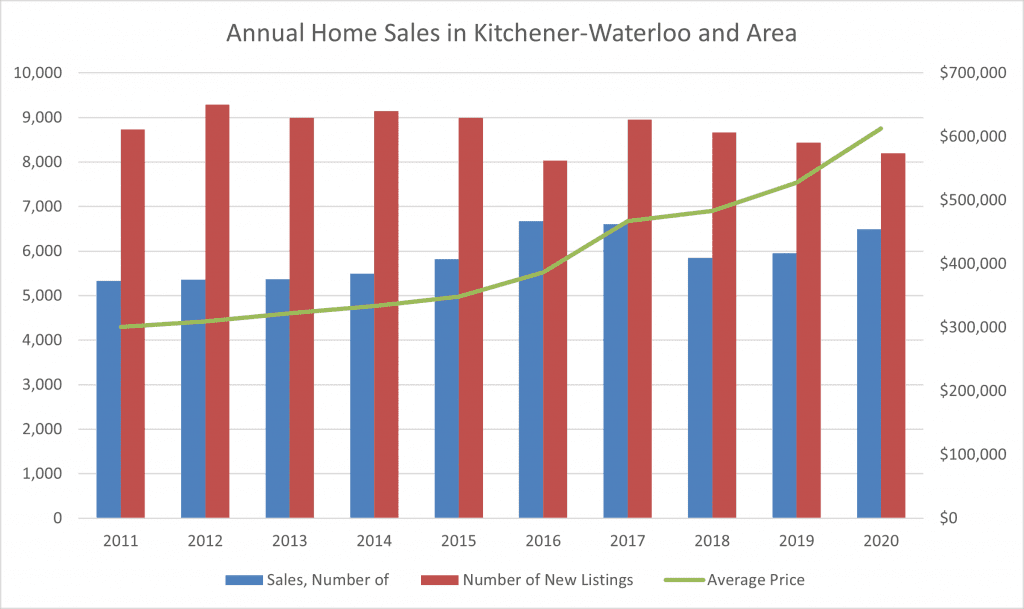
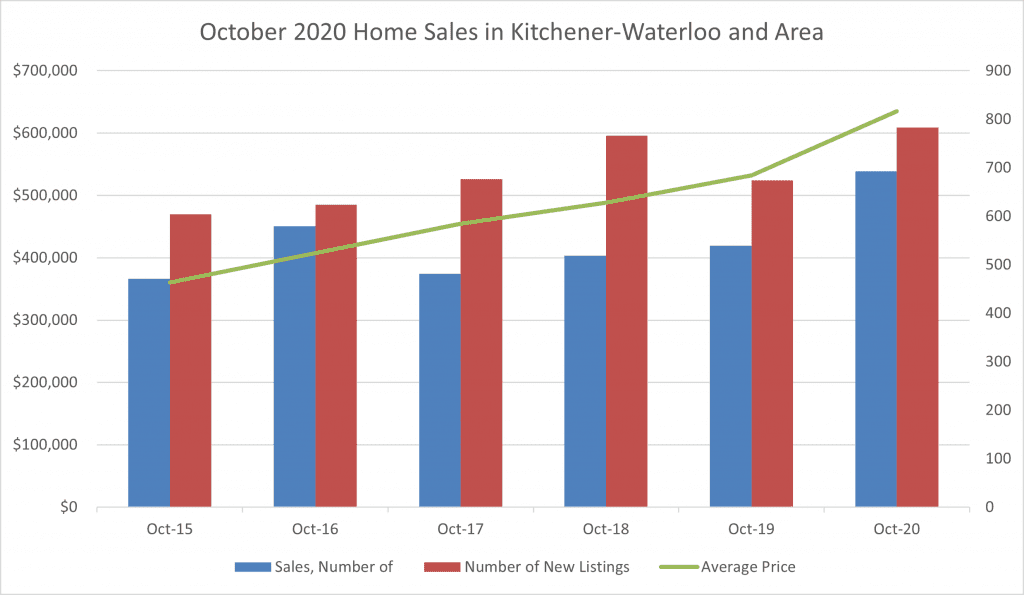
Historical Sales By Property Type

Months Supply of Homes for Sale

Historical Median Sales Price – By Property Type

Historical Average Sales Price – By Property Type


KWAR cautions that average sale price information can be useful in establishing long term trends but should not be used as an indicator that specific properties have increased or decreased in value. The average sale price is calculated based on the total dollar volume of all properties sold. Months Supply is the inventory of homes for sale at the end of a given month, divided by the average monthly closed sales from the last 12 months Those requiring specific information on property values should contact a local REALTOR®. REALTORS® have their fingers on the pulse of the market. They know the questions to ask, the areas to probe and what to look for so that you get a complete picture of the property and community you’re considering.