Kitchener Waterloo Market Snapshot August 2022
Wednesday, September 7th, 2022Rising Borrowing Costs Continue to Tame Home Sales in August
“The decline was most pronounced in the apartment-style condo and townhouse categories which could indicate that rising borrowing costs are having a greater impact on first-time buyers and those looking for more affordable options.”
If you are considering to Sell your home or Buy a home in the next short while it would be highly beneficial for you to connect with one of our Team Agents at
The Riz Team
Do you want to know what your home is worth today? Click Below for our Online No Obligation Market Evaluation
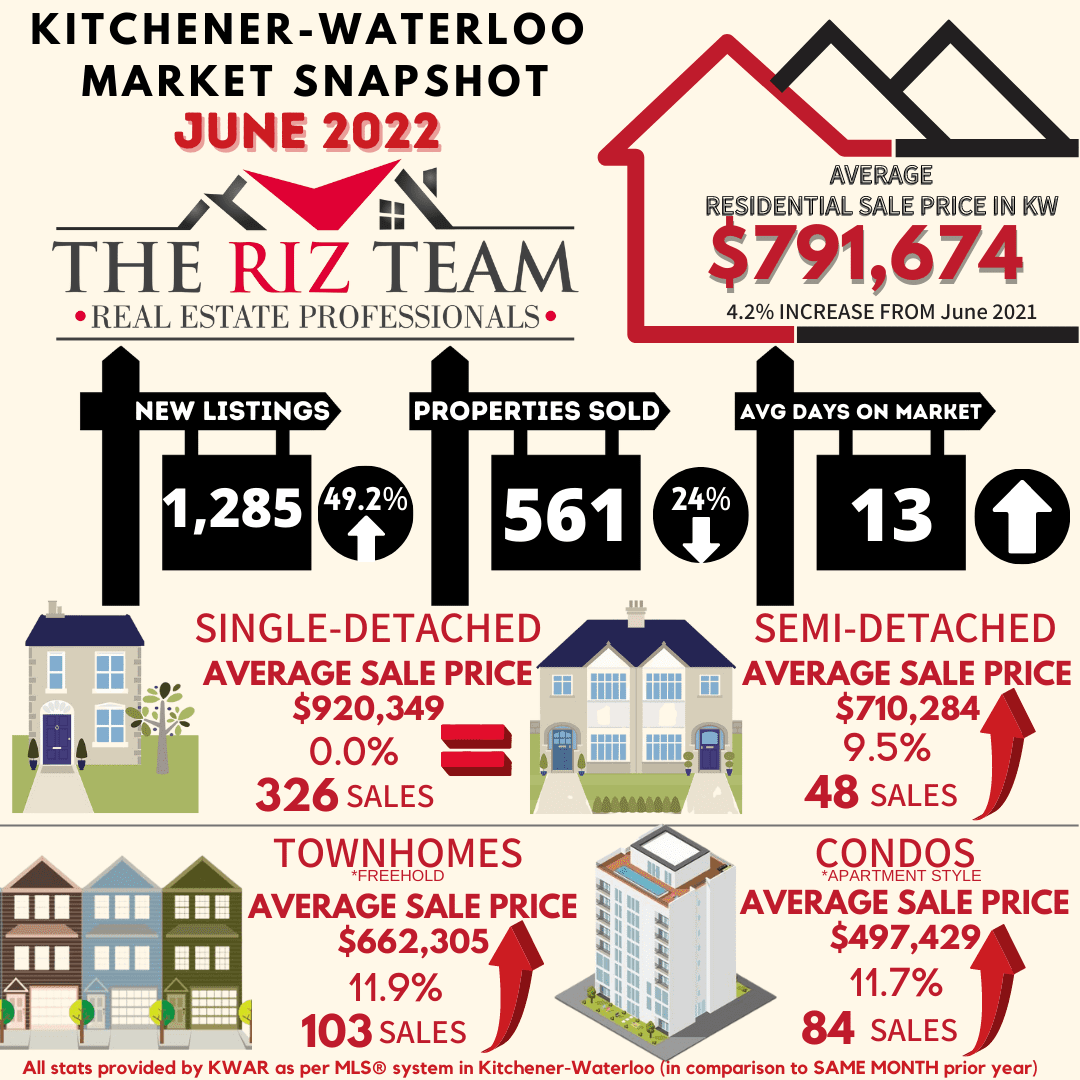
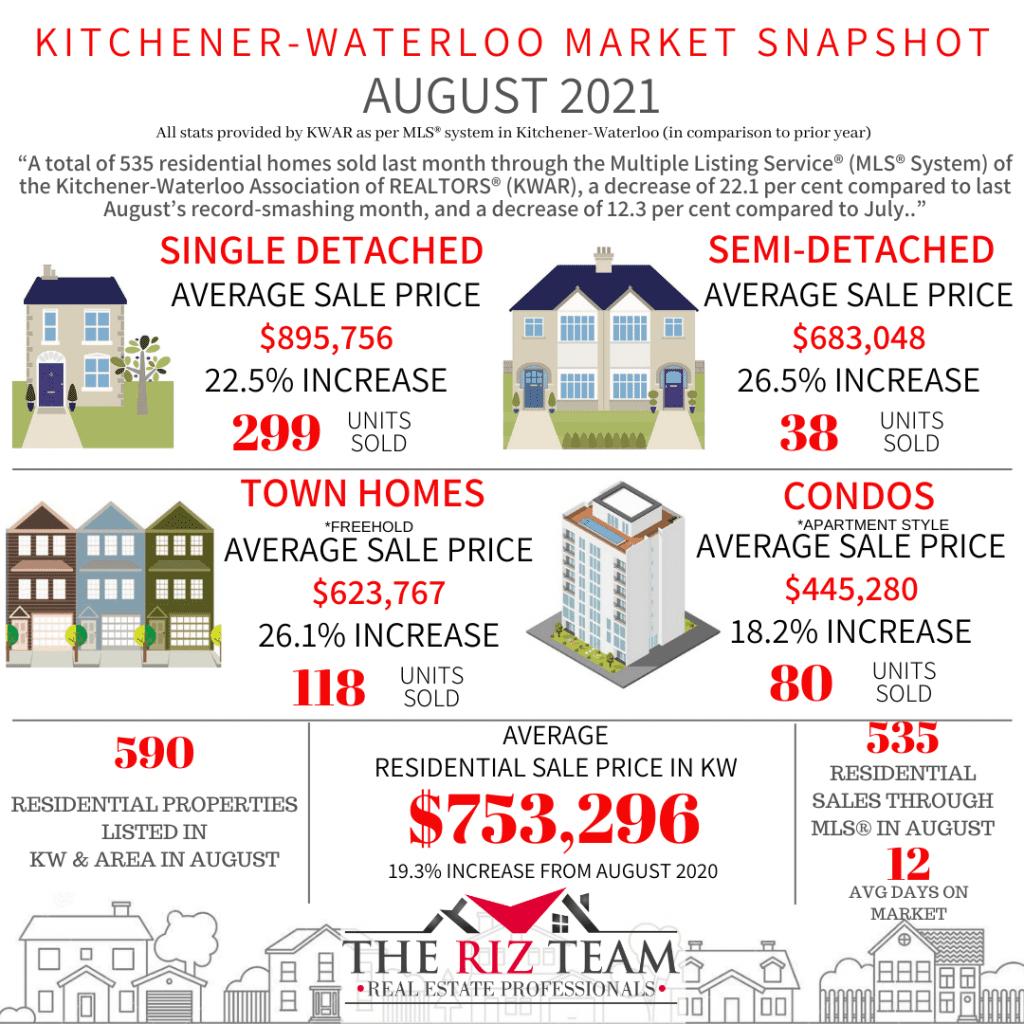
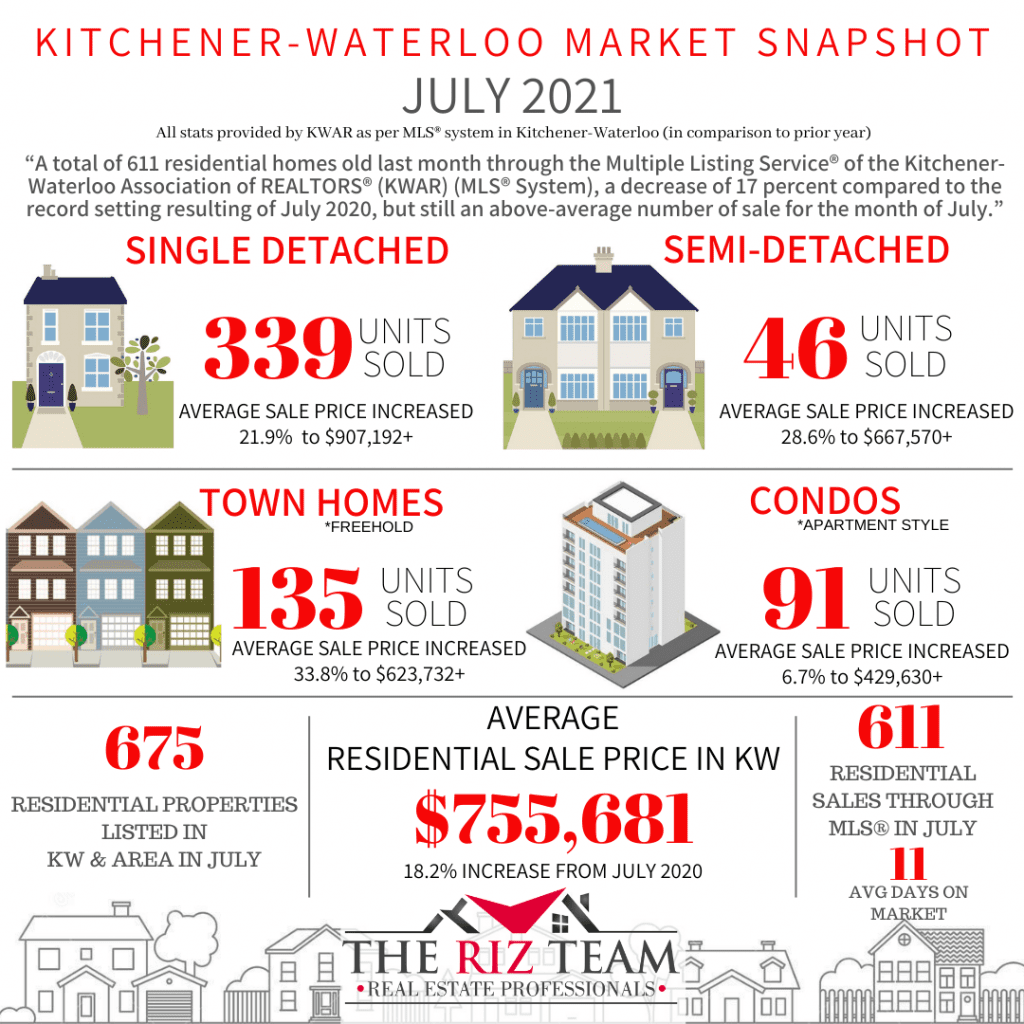
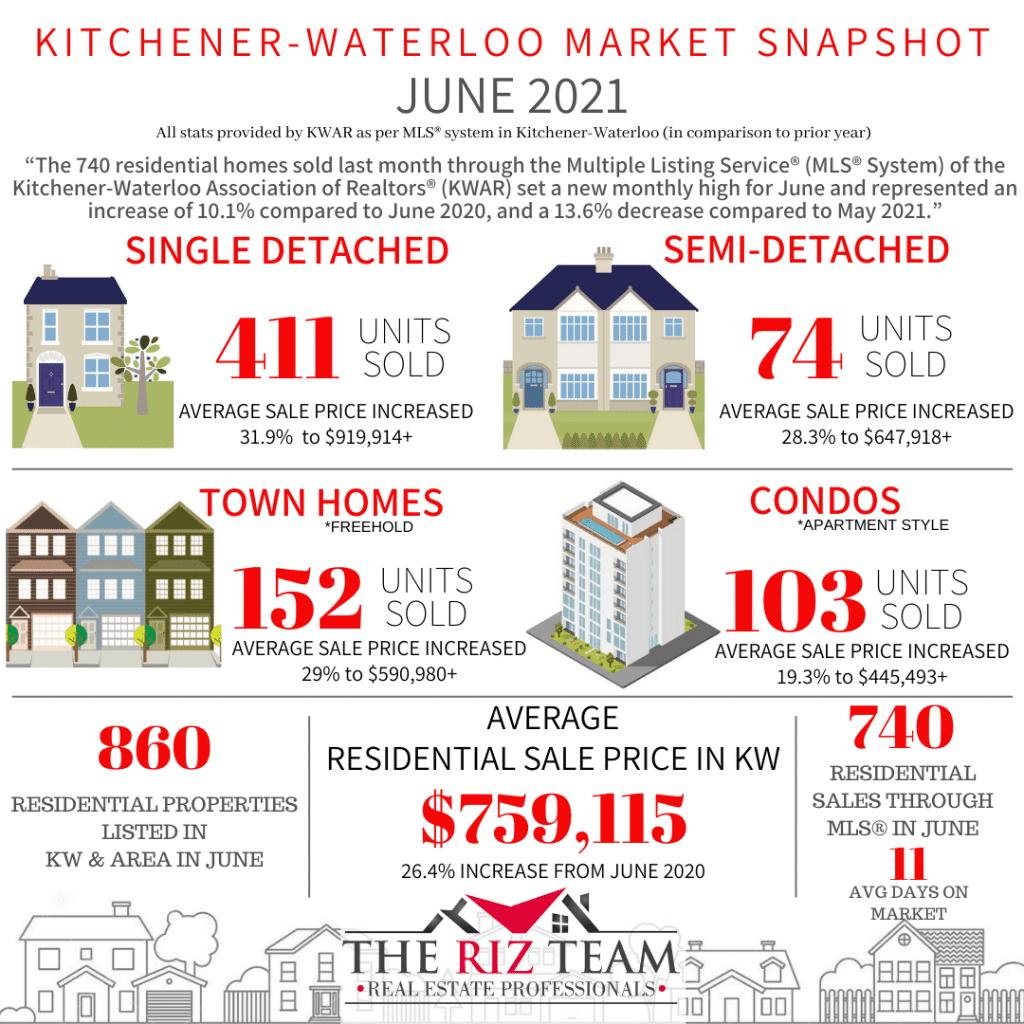
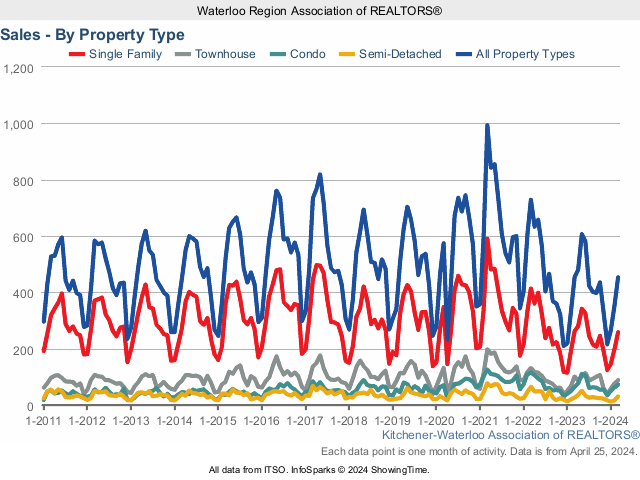
WATERLOO REGION, ON (September 7, 2022) — 659 residential homes were sold last month through the Multiple Listing Service® (MLS®) System of the Waterloo Region Association of REALTORS® (WRAR) in August, a decrease of 8.1 per cent compared to August 2021 and 11.2 per cent below the previous 5-year average for the month.
Total residential sales in August included 413 detached (down 0.7 per cent from August 2021), and 117 townhouses (down 24.0 per cent). Sales also included 68 condominium units (down 26.1 per cent) and 61 semi-detached homes (up 10.9 per cent).
“While the number of homes sold in August was down on a year-over-year basis they were up almost 19 per cent compared to July,” says Megan Bell, president of WRAR. “The decline was most pronounced in the apartment-style condo and townhouse categories which could indicate that rising borrowing costs are having a greater impact on first-time buyers and those looking for more affordable options.”
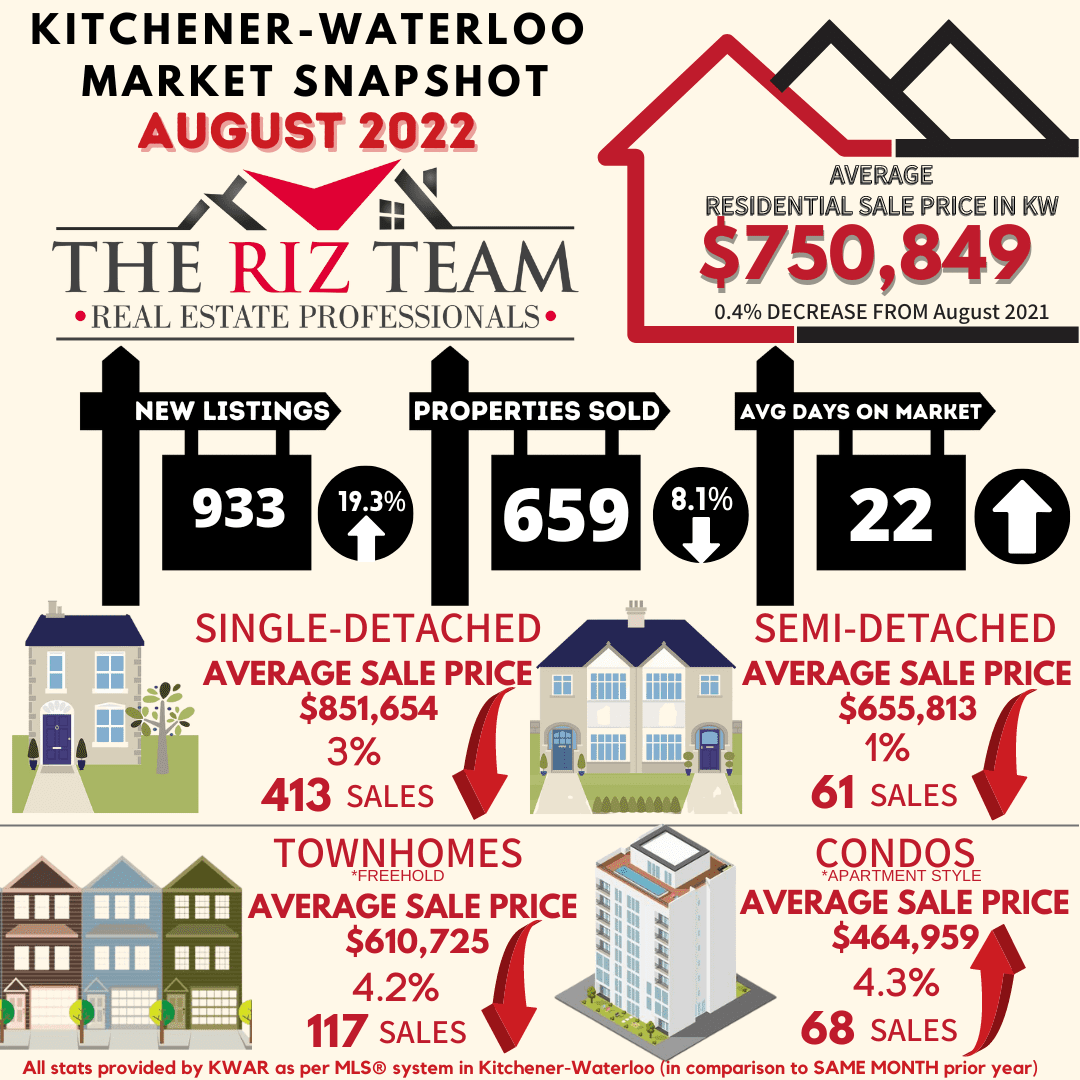
In August, the average sale price for all residential properties in Waterloo Region was $750,849. This represents a 0.4 per cent decrease compared to August 2021 and a 0.2 per cent decrease compared to July 2022.
- The average price of a detached home was $851,654. This represents a 3.0 per cent decrease from August 2021 and an increase of 1.1 per cent compared to July 2022.
- The average sale price for a townhouse was $610,725. This represents a 4.2 per cent decrease from August 2021 and a decrease of 5.2 per cent compared to July 2022.
- The average sale price for an apartment-style condominium was $464,959. This represents an increase of 4.3 per cent from August 2021 and a decrease of 10.9 per cent compared to July 2022.
- The average sale price for a semi was $655,813. This represents a decrease of 1.0 per cent compared to August 2021 and a decrease of 0.8 per cent compared to July 2022.

WRAR cautions that average sale price information can be useful in establishing long-term trends but should not be used as an indicator that specific properties have increased or decreased in value. The MLS® Home Price Index (HPI) provides the best way to gauge price trends because averages are strongly distorted by changes in the mix of sales activity from one month to the next.
| MLS® Home Price Index Benchmark Price | ||||||
| Kitchener-Waterloo | Cambridge | |||||
| Benchmark Type: | August 2022 | Monthly % Change | Yr./Yr. % Change | August 2022 | Monthly % Change | Yr./Yr. % Change |
| Composite | $734,500 | -1.9 | -2.2 | $750,700 | -3.4 | 0.6 |
| Detached | $815,000 | -1.5 | -3.9 | $764,700 | -3.1 | -1.3 |
| Townhouse | $618,400 | -3.8 | 5.4 | $715,200 | -5.9 | 11.7 |
| Apartment | $513,600 | -2.1 | 16.1 | $578,500 | -1.1 | 19.0 |

“Today’s announcement by the Bank of Canada to increase its policy rate by 75 basis points to 3.25 per cent is discouraging news for borrowers as it affects their purchasing power,” says Bell. “However, we see signs that the market is moving towards more buyer-friendly conditions. REALTORS® are reporting fewer multiple offers resulting in final sale prices being closer to the asking price or with more conditions accompanying offers. Even so, with inventory still very tight, Waterloo region remains a seller’s market.”
There were 933 new listings added to the MLS® System in the Waterloo Region last month, an increase of 19.3 per cent compared to August of last year, and a 1.2 per cent increase compared to the previous ten-year average for August.
The total number of homes available for sale in active status at the end of August was 1,003, an increase of 188.2 per cent compared to August of last year, and 31.8 per cent below the previous ten-year average of 1593 listings for August.
The number of months of inventory is up 250 per cent compared to August of last year, but still historically low. There were 1.4 months of inventory in August 2022, down from 1.8 months in July 2022. The number of months of inventory represents how long it would take to sell off current inventories at the current sales rate.
The average number of days to sell in August was 22, compared to 12 days in August 2021. The previous 5-year average is 22 days.
Those requiring specific information on property values should contact a local REALTOR®. Working with a Realtor is the best way to get a complete picture of the property and community you are considering.
View our HPI tool here to learn more: https://wrar.ca/hpi/
Click on any of the graphs below for an interactive view.


Tags: buyers, kitchener, Kitchener Buyers, kitchener real estate, Kitchener Sellers, kitchener-waterloo, kitchener-waterloo association of realtors, KW Real Estate, Market Stats, real estate, rizsellskw.com, sellers, the riz team, TheRizTeam, waterloo real estate
Posted in Enhance Your Home, Kitchener Buyers, Kitchener Sellers, Market Stats, Market Update, Real Estate News, Realtor Tips, Uncategorized, Waterloo Buyers, Waterloo Sellers | Comments Off on Kitchener Waterloo Market Snapshot August 2022