The Riz Team Blog

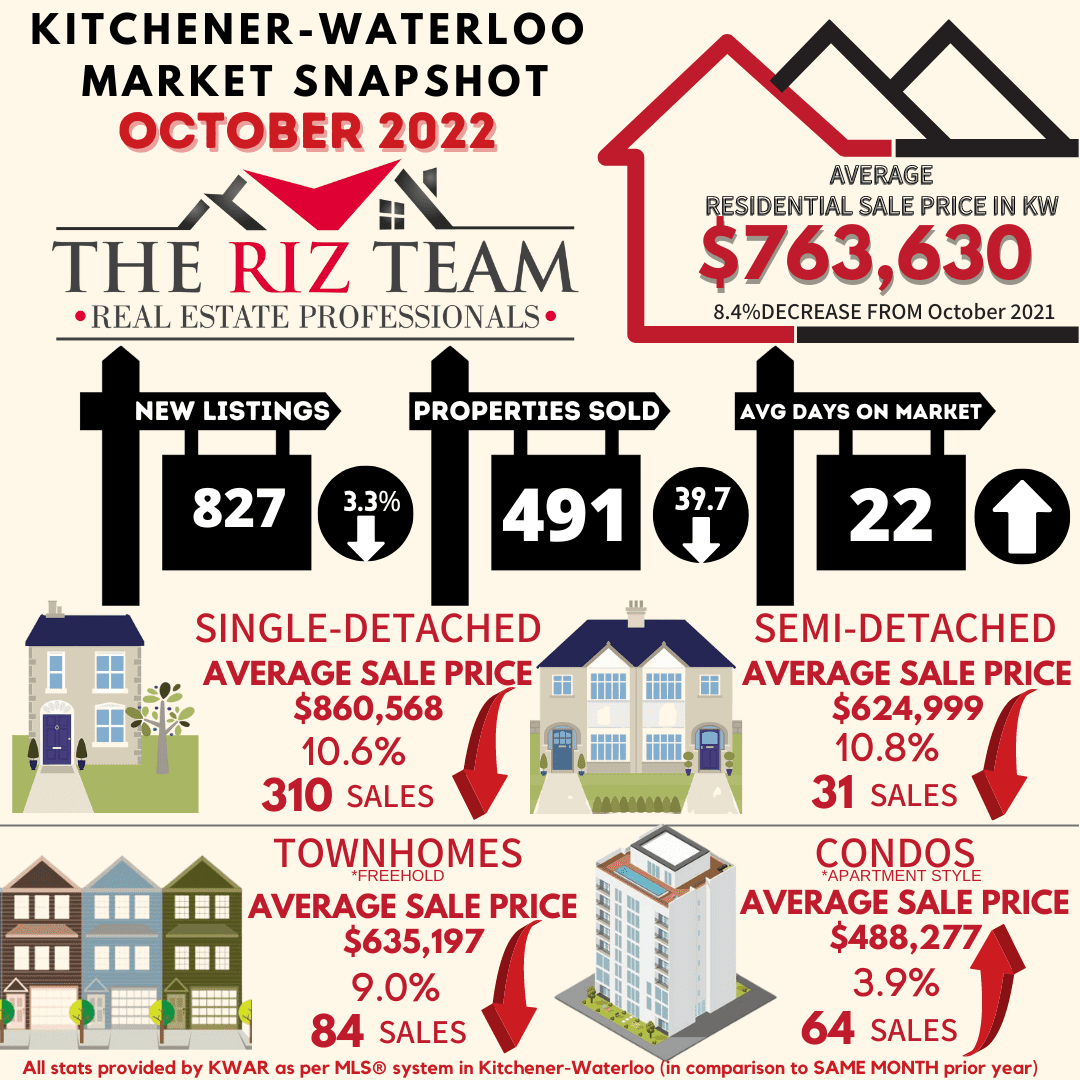
Kitchener Waterloo Market Snapshot October 2022

Fewer Home Sales in October


“Unsurprisingly, the pace of home sales continued to slow in October after the Bank of Canada’s sixth straight interest rate hike in September,” says Megan Bell, President of WRAR. “Faced with higher borrowing costs, some buyers have had to re-assess what they can afford. As these buyers get moved to the sidelines, sellers question if now is the best possible time to sell.”


If you are considering to Sell your home or Buy a home in the next short while it would be highly beneficial for you to connect with one of our Team Agents at

The Riz Team

Do you want to know what your home is worth today? Click Below for our Online No Obligation Market EvaluationClick Here


WATERLOO REGION, ON (November 2, 2022) —491 residential homes were sold last month through the Multiple Listing Service® (MLS®) System of the Waterloo Region Association of REALTORS® (WRAR), a decrease of 39.7 per cent compared to October 2021 and 36.2 per cent below the previous 5-year average for the month.

Total residential sales in October included 310 detached (down 38.2 per cent from October 2021), and 84 townhouses (down 45.1 per cent). Sales also included 64 condominium units (down 36.0 per cent) and 31 semi-detached homes (down 47.5 per cent).

“Unsurprisingly, the pace of home sales continued to slow in October after the Bank of Canada’s sixth straight interest rate hike in September,” says Megan Bell, President of WRAR. “Faced with higher borrowing costs, some buyers have had to re-assess what they can afford. As these buyers get moved to the sidelines, sellers question if now is the best possible time to sell.”

In October, the average sale price for all residential properties in Waterloo Region was $763,630. This represents an 8.4 per cent decrease compared to October 2021 and a 1.6 per cent increase compared to September 2022.

  • The average price of a detached home was $860,568. This represents a 10.6 per cent decrease from October 2021 and a decrease of 0.3 per cent compared to September 2022.
  • The average sale price for a townhouse was $635,197. This represents a 9.0 per cent decrease from October 2021 and a decrease of 0.4 per cent compared to September 2022.
  • The average sale price for an apartment-style condominium was $488,277. This represents an increase of 3.9 per cent from October 2021 and an increase of 7.3 per cent compared to September 2022.
  • The average sale price for a semi was $624,999. This represents a decrease of 10.8 per cent compared to October 2021 and a decrease of 1.9 per cent compared to September 2022.
october 2022 average sales price by property type 2

WRAR cautions that average sale price information can be useful in establishing long-term trends but should not be used as an indicator that specific properties have increased or decreased in value. The MLS® Home Price Index (HPI) provides the best way to gauge price trends because averages are strongly distorted by changes in the mix of sales activity from one month to the next.

MLS® Home Price Index Benchmark Price

Kitchener-Waterloo Cambridge
Benchmark Type: October 2022 Monthly % Change Yr./Yr. % Change October 2022 Monthly % Change Yr./Yr. % Change
Composite $723,200 -0.2 -8.8 $730,700 -2.3 -9.8
Detached $807,900 -0.0 -10.1 $751,800 -2.1 -11.6
Townhouse $603,700 -1.3 -3.2 $663,100 -2.4 1.8
Apartment $494,400 -0.1 6.5 $520,100 -6.6 7.3


October 2022 HPI Stats Chart for Kitchener Waterloo Cambridge

“While there is uncertainty in the minds of consumers about current market conditions, one thing is for certain, Waterloo region’s housing supply remains one of the tightest in the country,” says Bell.  “Buyers may be on the sidelines for now due to affordability, but the underlying demand for housing remains strong.”

There were 827 new listings added to the MLS® System in the Waterloo Region last month, a decrease of 3.3 per cent compared to October of last year and a 14.3 per cent decrease compared to the previous ten-year average for October.

The total number of homes available for sale in active status at the end of October was 928, an increase of 134.9 per cent compared to October of last year and 34.9 per cent below the previous ten-year average of 1425 listings for October.

The number of months of inventory is up 160.0 per cent compared to October of last year, but still historically low at 1.3 months. Between 2009 and 2015, October’s average months of inventory was 3.6 months. The number of months of inventory represents how long it would take to sell off current inventories at the current sales rate.

The average number of days to sell in October was 22, compared to 10 days in October 2021. The previous 5-year average is 19 days.

Those requiring specific information on property values should contact a local REALTOR®.  Working with a Realtor is the best way to get a complete picture of the housing market, your particular property and the community you are considering.

View our HPI tool here to learn more: https://wrar.ca/hpi/

Click on any of the graphs below for an interactive view.

October-2022-average-sale-price-by-municipality
October 2022 average sale price by township
October 2022 sales by property type
October 2022 Months Supply
October 2022 median sales price by property type
October 2022 average sale price by property type
October 2022 average days on market

Tags: , , , , , , , , , , , , , ,


© Copyright 2017, Real Estate Websites by Redman Technologies Inc. | Privacy Policy | Disclaimer | Sitemap

MLS®, REALTOR®, and the associated logos are trademarks of The Canadian Real Estate Association.

The data included on this website is deemed to be reliable, but is not guaranteed to be accurate by the Kitchener-Waterloo Real Estate Board. The trademarks REALTOR®, REALTORS® and the REALTOR® logo are controlled by The Canadian Real Estate Association (CREA) and identify real estate professionals who are members of CREA. Used under license.