Kitchener Waterloo Market Snapshot May 2023
Waterloo Region Buyer and Listing Activity Ramps Up In May
If you are considering to Sell your home or Buy a home in the next short while it would be highly beneficial for you to connect with one of our Team Agents at
The Riz Team
Do you want to know what your home is worth today? Click Below for our Online No Obligation Market Evaluation
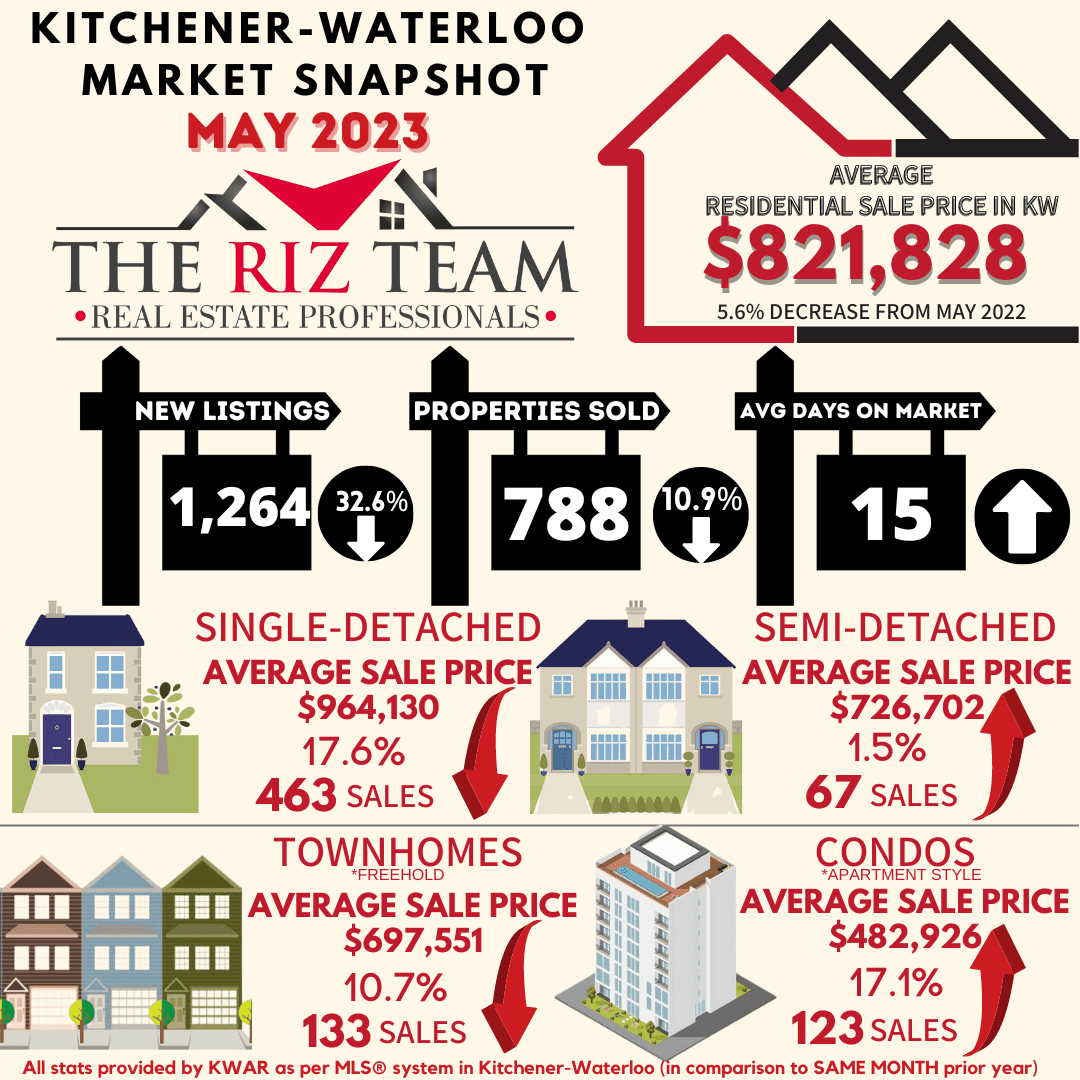
WATERLOO REGION, ON (June 2, 2023) — In May there were 788 homes sold through the Multiple Listing Service® (MLS®) System of the Waterloo Region Association of REALTORS® (WRAR), representing a decrease of 10.9 per cent compared to the previous year and a decline of 12.6 per cent compared to the previous 5-year average for the month.
“The spring market is in full swing with robust buyer and listing activity observed in May,” says Megan Bell, president of WRAR. “It’s encouraging to witness a significant uptick in listing activity compared to April, and we remain optimistic that this positive momentum will carry into June. However, it’s worth noting that the number of listings being added to the MLS® System continues to be historically low.”
Total residential sales in May included 463 detached (down 17.6 per cent from May 2022), and 133 townhouses (down 10.7 percent). Sales also included 123 condominium units (up 17.1 per cent) and 67 semi-detached homes (up 1.5 per cent).
In May, the average sale price for all residential properties in Waterloo Region was $821,828 This represents a 5.6 per cent decrease compared to May 2022 and a 3.1 per cent increase compared to April 2023.
- The average price of a detached home was $964,130. This represents a 2.8 per cent decrease from May 2022 and an increase of 4.2 per cent compared to April 2023.
- The average sale price for a townhouse was $697,551. This represents a 2.4 per cent decrease from May 2022 and an increase of 5.0 per cent compared to April 2023.
- The average sale price for an apartment-style condominium was $482,926. This represents a decrease of 11.8 per cent from May 2022 and a decrease of 1.4 per cent compared to April 2023.
- The average sale price for a semi was $726,702. This represents an increase of 1.1 per cent compared to May 2022 and an increase of 5.8 per cent compared to April 2023.
WRAR cautions that average sale price information can be useful in establishing long-term trends but should not be used as an indicator that specific properties have increased or decreased in value. The MLS® Home Price Index (HPI) provides the best way to gauge price trends because averages are strongly distorted by changes in the mix of sales activity from one month to the next.

MLS® Home Price Index Benchmark Price |
||||||
| Kitchener-Waterloo | Cambridge | |||||
| Benchmark Type: | May 2023 | Monthly % Change | Yr./Yr. % Change | May 2023 | Monthly % Change | Yr./Yr. % Change |
| Composite | $777,500 | 2.4 | -7.7 | $791,000 | 4.2 | -5.5 |
| Detached | $887,800 | 2.5 | -5.4 | $831,100 | 4.7 | -3.1 |
| Townhouse | $634,300 | 2.7 | -13.9 | $652,200 | 1.6 | -17.5 |
| Apartment | $487,600 | 2.3 | -8.9 | $480,700 | 0.1 | -17.8 |

“Waterloo Region properties remain in high demand, driven by our diverse economy and the desirability of our community, we continue to be in a seller’s market,” says Bell. “With limited inventory and a relatively low number of new listings being added to the MLS® system, buyers face intensified competition while sellers receive increasingly competitive offers.”
There were 1,264 new listings added to the MLS® System in Waterloo Region last month, a decrease of 32.6 per cent compared to May of last year and an 11.8 per cent decrease compared to the previous ten-year average for May.
The total number of homes available for sale in active status at the end of May was 900, a decrease of 24.9 per cent compared to May of last year and 41.0 per cent below the previous ten-year average of 1524 listings for May.
The number of months of inventory is up 13.3 per cent compared to May of last year, but still historically low at 1.7 months. The number of months of inventory represents how long it would take to sell off current inventories at the current sales rate.
The average number of days to sell in May was 15, compared to 11 days in May 2022. The previous 5-year average is 16 days.
View our HPI tool here to learn more: https://wrar.ca/hpi/
Click on any of the graphs below for an interactive view.


Tags: Homes For Sale, kitchener, kitchener real estate, kitchener-waterloo, kitchener-waterloo association of realtors, KW Market Update, Market Update, riz jadavji, Royal Lepage Wolle Realty, sales representative, waterloo, Waterloo Homes, waterloo realtor, Waterloo Sellers
This entry was posted on Friday, June 2nd, 2023 at 2:38 pm and is filed under Kitchener Buyers, Kitchener Sellers, Market Stats, Market Update, Real Estate News, Realtor Tips, Waterloo Buyers, Waterloo Sellers. You can follow any responses to this entry through the RSS 2.0 feed. Both comments and pings are currently closed.