Posts Tagged ‘kitchener real estate’
Wednesday, October 4th, 2023
Surge of New Listings in September Against Low Number of Sales
This article will provide a comprehensive snapshot of the KW real estate market for September 2023.
“The number of homes sold last month was very close to last year’s decade-low for the month of September,” says Megan Bell, president of WRAR. “At the same time, we had a record number of new listings for the month of September.”
If you are considering to Sell your home or Buy a home in the next short while it would be highly beneficial for you to connect with one of our Team Agents at
Do you want to know what your home is worth today? Click Below for our Online No Obligation Market Evaluation

“There was a significant surge of new listings in September, resulting in the largest number of homes being on the market since March 2016,” said Bell. “For buyers with the financing to be house hunting in September, they would have found more favourable conditions in terms of supply than we have seen in a while.”
At the same time, WRAR’s president points to the recent poll the association conducted, which shows over one-quarter of Waterloo Region residents are considering moving to a more affordable location.
“WRAR recently released a report highlighting that Waterloo region’s residents are struggling under the affordability crisis, with four in ten reporting that they live in housing that is unaffordable,” said Bell.
Local REALTORS® call for action to build more missing middle housing as nearly 4 in 10 (38%) residents report living in unaffordable homes.
There were 1,400 new listings added to the MLS® System in Waterloo Region last month, an increase of 52.3 per cent compared to September of last year and a 30.5 per cent increase compared to the previous ten-year average for September.
The total number of homes available for sale in active status at the end of September was 1,448, an increase of 48.8 per cent compared to September of last year and 9.5 per cent above the previous ten-year average of 1322 listings for September.
There were 2.6 months of inventory at the end of September, an 85.7 per cent increase compared to last year and 34.7 per cent above the previous 10-year average. The number of months of inventory represents how long it would take to sell off current inventories at the current sales rate.
The average number of days to sell in September was 18, compared to 23 days in September 2022. The previous 5-year average is 20 days.
With the next scheduled Bank of Canada interest rate announcement set for October 25, buyers might be on the sidelines, waiting to see what unfolds. WRAR understands that some buyers may be unsure about their next steps. That’s why we encourage these buyers to reach out to local Realtors who can provide them with valuable insights about the current state of the local market and cater to their specific needs.
View our HPI tool here to learn more: https://wrar.ca/hpi/
Tags: buyers, for sale, Homes For Sale, Kitchener Homes, kitchener real estate, kitchener-waterloo, kitchener-waterloo association of realtors, Market Update, riz jadavji, rizsellskw.com, Royal Lepage Wolle Realty, sales representative, the riz team, waterloo, Waterloo Buyers, Waterloo Homes, waterloo real estate, waterloo realtor, Waterloo Sellers
Posted in Kitchener Buyers, Kitchener Sellers, Market Stats, Market Update, Real Estate News, Realtor Tips, Waterloo Buyers, Waterloo Sellers | Comments Off on Kitchener Waterloo Market Snapshot September 2023
Wednesday, September 6th, 2023
Soft Home Sales in August Coupled with Strong Listing Activity
If you are considering to Sell your home or Buy a home in the next short while it would be highly beneficial for you to connect with one of our Team Agents at
Do you want to know what your home is worth today? Click Below for our Online No Obligation Market Evaluation

“Home buyers had the advantage of strong listing activity in August, which helped to provide a little more choice and temper prices,” says Bell. “But affordability remains a top concern for many who are looking to get into the market and finding it a challenge to resolve what they want with what they can afford.”
WRAR’s president points out that while market-wide, inventory levels were up 7.6 per cent in August, this was mainly due to the Townhouse/Condo segment, where inventory increased by 35.3 per cent. The property type with the most supply in the market is the condo segment with 3.3 months supply, compared to 1.8 months supply in the detached home category.
“Right now, buyers may find it easier to get into a condominium, which can be a great choice for both first time buyers, and anyone looking for a lifestyle change.”
There were 1,025 new listings added to the MLS® System in Waterloo Region last month, an increase of 9.7 per cent compared to August of last year and a 11.7 per cent increase compared to the previous ten-year average for August.
The total number of homes available for sale in active status at the end of August was 1,094, an increase of 7.6 per cent compared to August of last year and 14.9 per cent below the previous ten-year average of 1431 listings for August.
There were 2.0 months of inventory at the end of August, unchanged from the end of July and in line with the previous 10-year average. The number of months of inventory represents how long it would take to sell off current inventories at the current sales rate.
The average number of days to sell in August was 19, compared to 23 days in August 2022. The previous 5-year average is 21 days.
View our HPI tool here to learn more: https://wrar.ca/hpi/
Tags: for sale, home sales, Kitchener Buyers, kitchener real estate, kitchener-waterloo, Royal Lepage Wolle Realty, the riz team, waterloo, Waterloo Buyers, waterloo for sale, Waterloo Homes, waterloo real estate, waterloo realtor, Waterloo Sellers
Posted in Kitchener Buyers, Kitchener Sellers, Market Stats, Market Update, Real Estate News, Realtor Tips, Waterloo Buyers, Waterloo Sellers | Comments Off on Kitchener Waterloo Market Snapshot August 2023
Thursday, August 3rd, 2023
Strong Listing Activity in July
If you are considering to Sell your home or Buy a home in the next short while it would be highly beneficial for you to connect with one of our Team Agents at
Do you want to know what your home is worth today? Click Below for our Online No Obligation Market Evaluation
Tags: buyers, for sale, home sales, Homes For Sale, kitchener for sale, kitchener real estate, kitchener realtor, Kitchener Sellers, kitchener-waterloo, kitchener-waterloo association of realtors, real estate, riz jadavji, Royal Lepage Wolle Realty, the riz team, TheRizTeam, waterloo, Waterloo Homes, waterloo real estate, waterloo realtor
Posted in Enhance Your Home, Kitchener Buyers, Kitchener Sellers, Market Stats, Market Update, Real Estate News, Realtor Tips, Waterloo Buyers, Waterloo Sellers | Comments Off on Kitchener Waterloo Market Snapshot July 2023
Thursday, July 6th, 2023
Waterloo Region Real Estate Market Shows Resilience With Increase in Home Sales and Average Prices
If you are considering to Sell your home or Buy a home in the next short while it would be highly beneficial for you to connect with one of our Team Agents at
Do you want to know what your home is worth today? Click Below for our Online No Obligation Market Evaluation
Tags: buyers, for sale, Homes For Sale, Kitchener Buyers, kitchener real estate, kitchener-waterloo, Market Update, real estate market, sales representative, sellers, the riz team, waterloo for sale, Waterloo Homes, Waterloo Sellers
Posted in Kitchener Buyers, Kitchener Sellers, Market Stats, Market Update, Real Estate News, Waterloo Buyers, Waterloo Sellers | Comments Off on Kitchener Waterloo Market Snapshot June 2023
Friday, June 2nd, 2023
Waterloo Region Buyer and Listing Activity Ramps Up In May
If you are considering to Sell your home or Buy a home in the next short while it would be highly beneficial for you to connect with one of our Team Agents at
Do you want to know what your home is worth today? Click Below for our Online No Obligation Market Evaluation
Tags: Homes For Sale, kitchener, kitchener real estate, kitchener-waterloo, kitchener-waterloo association of realtors, KW Market Update, Market Update, riz jadavji, Royal Lepage Wolle Realty, sales representative, waterloo, Waterloo Homes, waterloo realtor, Waterloo Sellers
Posted in Kitchener Buyers, Kitchener Sellers, Market Stats, Market Update, Real Estate News, Realtor Tips, Waterloo Buyers, Waterloo Sellers | Comments Off on Kitchener Waterloo Market Snapshot May 2023
Friday, February 3rd, 2023
Number of Home Sales in January Exceptionally Low
If you are considering to Sell your home or Buy a home in the next short while it would be highly beneficial for you to connect with one of our Team Agents at
Do you want to know what your home is worth today? Click Below for our Online No Obligation Market Evaluation
“On a monthly basis, we saw the average sale price increase across all property types in January,” says Bell. “I’m also noticing more multiple offers happening, especially on detached homes that are priced under eight hundred thousand dollars.”
Meanwhile, the Bank of Canada again increased interest rates at the end of January by 25 basis points to 4.5 per cent. “While not a huge increase, the continuance of interest rate hikes is an ongoing factor in the reduction of home sales within the market,” says Bell.
There were 579 new listings added to the MLS® System in Waterloo Region last month, a decrease of 13.3 per cent compared to January of last year and a 28.7 per cent decrease compared to the previous ten-year average for January.
The total number of homes available for sale in active status at the end of January was 651, an increase of 167.9 per cent compared to January of last year and 34.7 per cent below the previous ten-year average of 998 listings for January.
The number of months of inventory is up 233.3 per cent compared to January of last year, but still historically low at one month. Between 2011 and 2015, January’s average months of inventory was 3.0 months. The number of months of inventory represents how long it would take to sell off current inventories at the current sales rate.
The average number of days to sell in January was 25, compared to 9 days in January 2022. The previous 5-year average is 21 days.
WRAR’s president says, “The demographic of buyers is also shifting as we observe fewer buyers coming from the GTA into the region. While there are still some, it is nowhere like it was last January. These and other shifting influences mean it has never been more important for buyers and sellers to work with a local REALTOR® to help provide expertise during the homebuying and selling process.”
Affordability, combined with ongoing supply constraints, makes it difficult for buyers to navigate the continuous market changes while sellers also need to adjust to the evolving circumstances. Those requiring specific information on property values should contact a local REALTOR®. Working with a Realtor is the best way to get a complete picture of the property and community you are considering.
View our HPI tool here to learn more: https://wrar.ca/hpi/
Tags: buyers, for sale, Homes For Sale, Kitchener Buyers, kitchener for sale, kitchener real estate, Kitchener Sellers, kitchener-waterloo, KW Market Update, KW Real Estate, real estate, Royal Lepage Wolle Realty, Waterloo Sellers
Posted in Kitchener Buyers, Kitchener Sellers, Market Stats, Market Update, Real Estate News, Realtor Tips, Waterloo Buyers, Waterloo Sellers | Comments Off on Kitchener Waterloo Market Snapshot January 2023
Thursday, January 5th, 2023
Fewer Homes Sales in December Ends a Year of Weaker Sales Activity in Waterloo Region
If you are considering to Sell your home or Buy a home in the next short while it would be highly beneficial for you to connect with one of our Team Agents at
Do you want to know what your home is worth today? Click Below for our Online No Obligation Market Evaluation
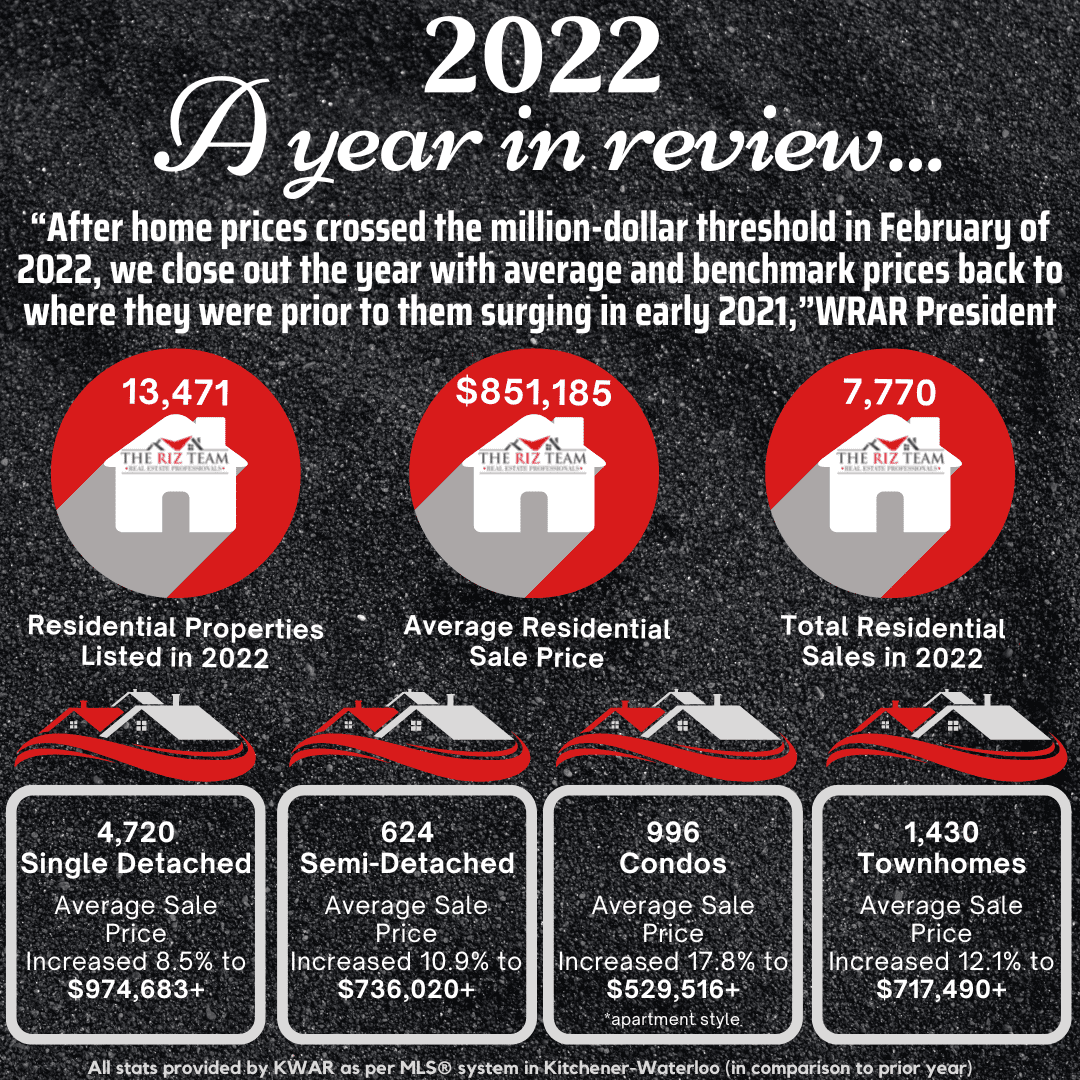
WATERLOO REGION, ON (January 5, 2023) —There were 7,770 homes sold through the Multiple Listing Service® (MLS®) System of the Waterloo Region Association of REALTORS® (WRAR) in 2022, a decrease of 24.8 per cent compared to 2021. On a historical basis, 2022 performed lower than previous years, with annual sales down 12.4 per cent compared to the previous 5-year average and 8.2 per cent below the previous 10-year average.
On a monthly basis, there were 280 homes sold in December, a decrease of 38.7 per cent compared to December 2021, and 32.3 per cent below the previous 5-year average for the month.
“The number of homes sold in December was lower than any single month in well over a decade, marking an end to a turbulent year for home sales in Waterloo Region,” says Megan Bell, President of WRAR.

Tags: buyers, first-time buyers, homes, Kitchener Buyers, kitchener real estate, Kitchener Sellers, kitchener-waterloo, Re/Max, Royal Lepage Wolle Realty, sellers, waterloo real estate, Waterloo Sellers, Zillow
Posted in Kitchener Buyers, Kitchener Sellers, Market Stats, Market Update, Real Estate News, Realtor Tips, Uncategorized, Waterloo Buyers, Waterloo Sellers | Comments Off on Kitchener Waterloo Market Snapshot & Yearly Summary December 2022
Friday, December 2nd, 2022
Waterloo Region Home Prices Continue to Cool in November
“Home sales continued to decrease in November, as they traditionally do at this time of year,” “At the same time, we know ever-increasing homeownership costs are contributing to the decline and putting downward pressure on sales prices which have plateaued since July.”
If you are considering to Sell your home or Buy a home in the next short while it would be highly beneficial for you to connect with one of our Team Agents at
Do you want to know what your home is worth today? Click Below for our Online No Obligation Market Evaluation

“The Waterloo Region market has been moving towards more of a balanced market throughout the latter part of the year, and November followed that trend,” says Bell. “We have a long way to go before the pendulum swings into it being a buyer’s market. However, if the Bank of Canada yet again raises its key interest rate on December 7, it is likely to result in fewer buyers competing for more inventory.”
There were 752 new listings added to the MLS® System in the Waterloo Region last month, a decrease of 6.6 per cent compared to November of last year and a 1.3 per cent increase compared to the previous ten-year average for November.
The total number of homes available for sale in active status at the end of November was 860, an increase of 209.4 per cent compared to November of last year and 29.9 per cent below the previous ten-year average of 1227 listings for November.
The number of months of inventory is up 333.3 per cent compared to November of last year, but still historically low at 1.3 months. Between 2009 and 2015, November’s average months of inventory was 3.2 months. The number of months of inventory represents how long it would take to sell off current inventories at the current sales rate.
The average number of days to sell in November was 21, compared to 10 days in November 2021. The previous 5-year average is 21 days.
WRAR’s president says, “It has never been more important for both buyers and sellers to work with a REALTOR® to help provide expertise during the homebuying and selling process. Affordability, combined with ongoing supply constraints, are making it difficult for buyers to navigate the continuous market changes while sellers are also having to adjust in concurrence with the evolving circumstances”.
Those requiring specific information on property values should contact a local REALTOR®. Working with a Realtor is the best way to get a complete picture of the property and community you are considering.
View our HPI tool here to learn more: https://wrar.ca/hpi/
Tags: buyers, for sale, Homes For Sale, Kitchener Buyers, kitchener for sale, kitchener real estate, kitchener-waterloo, kitchener-waterloo association of realtors, real estate market, Royal Lepage Wolle Realty, sales representative, Waterloo Buyers, waterloo real estate, waterloo realtor, Waterloo Sellers
Posted in Kitchener Buyers, Kitchener Sellers, Market Stats, Market Update, Real Estate News, Waterloo Buyers, Waterloo Sellers | Comments Off on Kitchener Waterloo Market Snapshot November 2022
Wednesday, October 5th, 2022
Fewer Home Sales in October
“Unsurprisingly, the pace of home sales continued to slow in October after the Bank of Canada’s sixth straight interest rate hike in September,” says Megan Bell, President of WRAR. “Faced with higher borrowing costs, some buyers have had to re-assess what they can afford. As these buyers get moved to the sidelines, sellers question if now is the best possible time to sell.”
If you are considering to Sell your home or Buy a home in the next short while it would be highly beneficial for you to connect with one of our Team Agents at
Do you want to know what your home is worth today? Click Below for our Online No Obligation Market Evaluation

Tags: buyers, kitchener, Kitchener Buyers, kitchener real estate, Kitchener Sellers, kitchener-waterloo, kitchener-waterloo association of realtors, KW Real Estate, Market Stats, real estate, rizsellskw.com, sellers, the riz team, TheRizTeam, waterloo real estate
Posted in Enhance Your Home, Kitchener Buyers, Kitchener Sellers, Market Stats, Market Update, Real Estate News, Realtor Tips, Uncategorized, Waterloo Buyers, Waterloo Sellers | Comments Off on Kitchener Waterloo Market Snapshot October 2022
Wednesday, September 7th, 2022
Rising Borrowing Costs Continue to Tame Home Sales in August
“The decline was most pronounced in the apartment-style condo and townhouse categories which could indicate that rising borrowing costs are having a greater impact on first-time buyers and those looking for more affordable options.”
If you are considering to Sell your home or Buy a home in the next short while it would be highly beneficial for you to connect with one of our Team Agents at
Do you want to know what your home is worth today? Click Below for our Online No Obligation Market Evaluation

Tags: buyers, kitchener, Kitchener Buyers, kitchener real estate, Kitchener Sellers, kitchener-waterloo, kitchener-waterloo association of realtors, KW Real Estate, Market Stats, real estate, rizsellskw.com, sellers, the riz team, TheRizTeam, waterloo real estate
Posted in Enhance Your Home, Kitchener Buyers, Kitchener Sellers, Market Stats, Market Update, Real Estate News, Realtor Tips, Uncategorized, Waterloo Buyers, Waterloo Sellers | Comments Off on Kitchener Waterloo Market Snapshot August 2022


