Kitchener Waterloo Market Snapshot July 2023
Strong Listing Activity in July
If you are considering to Sell your home or Buy a home in the next short while it would be highly beneficial for you to connect with one of our Team Agents at
The Riz Team
Do you want to know what your home is worth today? Click Below for our Online No Obligation Market Evaluation
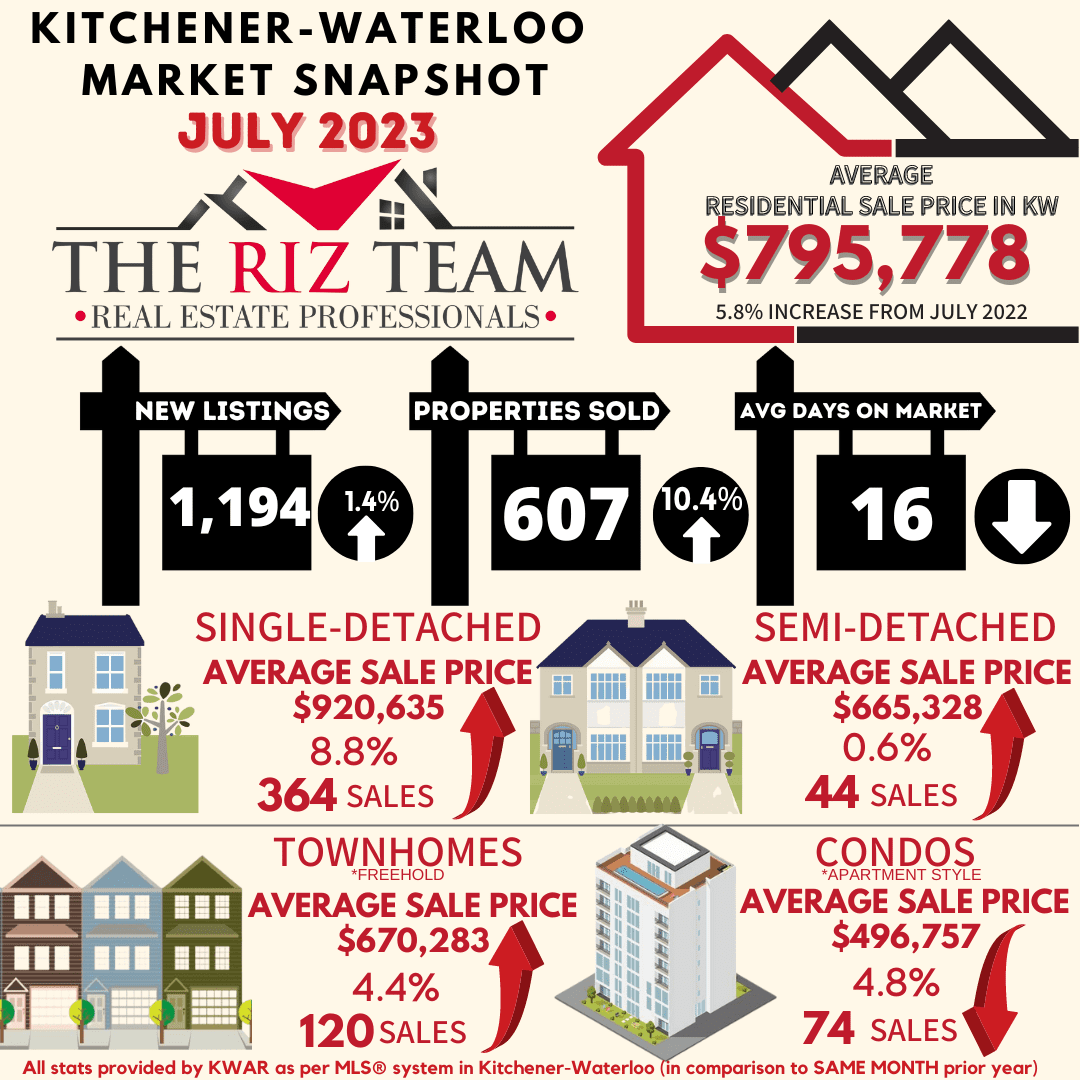
WATERLOO REGION, ON (August 3, 2023) — In July, there were 607 homes sold through the Multiple Listing Service® (MLS®) System of the Waterloo Region Association of REALTORS® (WRAR), representing an increase of 10.4 per cent compared to the previous year and a decline of 21.6 per cent compared to the previous 5-year average for the month.
“The Waterloo Region residential real estate market experienced some growth in terms of unit sales and supply in July, with home prices showing moderate fluctuations,” says Bell. “Despite the Bank of Canada’s most recent interest rate hike, we saw more sellers coming off the sidelines with new listing activity reaching its second highest level for the month of July in over a decade.”
Total residential sales in July included 364 detached (up 8.3 per cent from July 2022), and 120 townhouses (up 7.1 per cent). Sales also included 74 condominium units (up 15.6 per cent) and 44 semi-detached homes (up 22.2 per cent).
In July, the average sale price for all residential properties in Waterloo Region was $795,778. This represents a 5.8 per cent increase compared to July 2022 and a 5.2 per cent decrease compared to June 2023.
- The average price of a detached home was $920,635. This represents an 8.8 per cent increase from July 2022 and a decrease of 8.4 per cent compared to June 2023.
- The average sale price for a townhouse was $670,283. This represents a 4.4 per cent increase from July 2022 and an increase of 0.5 per cent compared to June 2023.
- The average sale price for an apartment-style condominium was $496,757. This represents a decrease of 4.8 per cent from July 2022 and an increase of 5.6 per cent compared to June 2023.
- The average sale price for a semi was $665,328. This represents an increase of 0.6 per cent compared to July 2022 and a decrease of 3.8 per cent compared to June 2023.
WRAR cautions that average sale price information can be useful in establishing long-term trends but should not be used as an indicator that specific properties have increased or decreased in value. The MLS® Home Price Index (HPI) provides the best way to gauge price trends because averages are strongly distorted by changes in the mix of sales activity from one month to the next.

MLS® Home Price Index Benchmark Price |
||||||
| Kitchener-Waterloo | Cambridge | |||||
| Benchmark Type: | July 2023 | Monthly % Change | Yr./Yr. % Change | July 2023 | Monthly % Change | Yr./Yr. % Change |
| Composite | $765,000 | -1.7 | 1.8 | $764,600 | -1.8 | -1.2 |
| Detached | $869,000 | -2.3 | 4.4 | $797,100 | -2.2 | 1.2 |
| Townhouse | $648,700 | 0.6 | -0.3 | $663,200 | 0.5 | -11.9 |
| Apartment | $484,900 | 1.2 | -5.5 | $492,600 | 2.2 | -14.8 |

“In this ever-evolving market, demand persists despite the changing landscape. Increased listing activity is certainly welcomed to help offset the lack of supply and pent-up demand,” says Bell. “Working with a local REALTOR® is vital in navigating these shifting influences during the homebuying and selling process. Waterloo Region properties remain highly sought-after due to our diverse economy and desirable community, solidifying us in a competitive market.”
There were 1,194 new listings added to the MLS® System in Waterloo Region last month, an increase of 1.4 per cent compared to July of last year and a 10.8 per cent increase compared to the previous ten-year average for July.
The total number of homes available for sale in active status at the end of July was 1,107, a decrease of 14.8 per cent compared to July of last year and 22.6 per cent below the previous ten-year average of 1431 listings for July.
There were 2.0 months of inventory at the end of July, up slightly from the end of June and in line with the previous 10-year average. The number of months of inventory represents how long it would take to sell off current inventories at the current sales rate.
The average number of days to sell in July was 16, compared to 18 days in July 2022. The previous 5-year average is 18 days.
View our HPI tool here to learn more: https://wrar.ca/hpi/
Click on any of the graphs below for an interactive view.


WRAR cautions that average sale price information can help identify long-term trends but should not be to indicate that specific properties have increased or decreased in value. The average sale price is calculated based on the total dollar volume of all properties sold. Months Supply is the inventory of homes for sale at the end of a given month, divided by the average monthly closed sales from the last 12 months. Those requiring specific information on property values should contact a Waterloo Region REALTOR®. REALTORS® have their fingers on the pulse of the market. They know the questions to ask, the areas to probe and what to look for so that you get a complete picture of the property and community you’re considering.
Tags: buyers, for sale, home sales, Homes For Sale, kitchener for sale, kitchener real estate, kitchener realtor, Kitchener Sellers, kitchener-waterloo, kitchener-waterloo association of realtors, real estate, riz jadavji, Royal Lepage Wolle Realty, the riz team, TheRizTeam, waterloo, Waterloo Homes, waterloo real estate, waterloo realtor
This entry was posted on Thursday, August 3rd, 2023 at 8:09 pm and is filed under Enhance Your Home, Kitchener Buyers, Kitchener Sellers, Market Stats, Market Update, Real Estate News, Realtor Tips, Waterloo Buyers, Waterloo Sellers. You can follow any responses to this entry through the RSS 2.0 feed. Both comments and pings are currently closed.