Kitchener Waterloo Market Snapshot January 2023
Number of Home Sales in January Exceptionally Low
If you are considering to Sell your home or Buy a home in the next short while it would be highly beneficial for you to connect with one of our Team Agents at
The Riz Team
Do you want to know what your home is worth today? Click Below for our Online No Obligation Market Evaluation
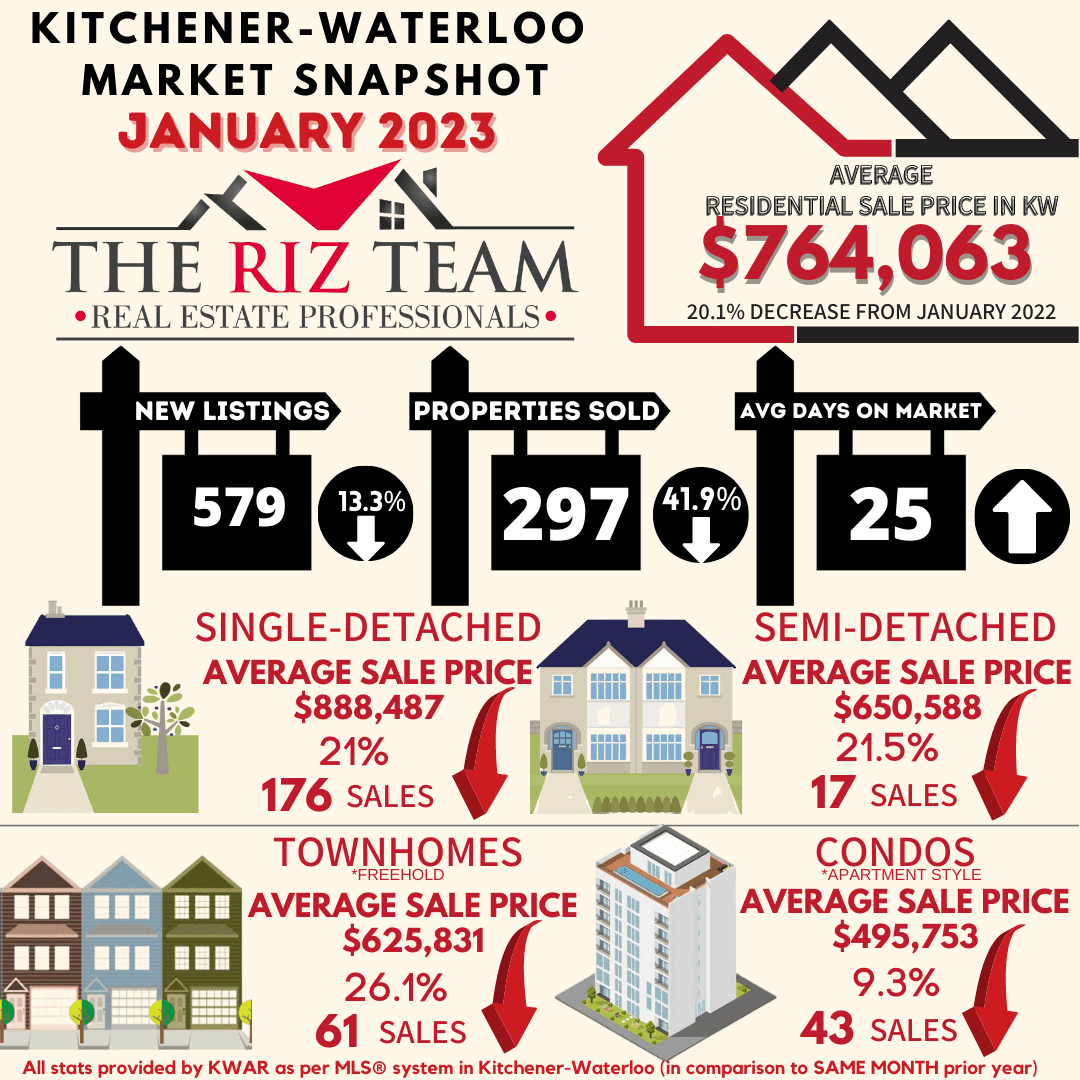
WATERLOO REGION, ON (February 3, 2023) —The number of homes sold last month through the Multiple Listing Service® (MLS®) System of the Waterloo Region Association of REALTORS® (WRAR) totalled 297 units, a decrease of 41.9 per cent compared to January 2022 and 31.0 per cent below the previous 5-year average for the month.
“Waterloo Region’s home sales in January were at their second lowest of any single month in well over a decade,” says Megan Bell, president of WRAR. “Home sales tend to be sluggish in January, and while we expected activity to ease to reflect economic challenges, this was a larger drop than originally anticipated.”
Total residential sales in January included 176 detached (down 38.5 per cent from January 2022), and 61 townhouses (down 44.5 per cent). Sales also included 43 condominium units (down 48.2 per cent) and 17 semi-detached homes (down 46.9 per cent).
In January, the average sale price for all residential properties in Waterloo Region was $764,063. This represents a 20.1 per cent decrease compared to January 2022 and a 5.9 per cent increase compared to December 2022.
- The average price of a detached home was $888,487. This represents a 21.5 per cent decrease from January 2022 and an increase of 7.6 per cent compared to December 2022.
- The average sale price for a townhouse was $625,831. This represents a 26.1 per cent decrease from January 2022 and an increase of 2.2 per cent compared to December 2022.
- The average sale price for an apartment-style condominium was $495,753. This represents a decrease of 9.3 per cent from January 2022 and an increase of 6.1 per cent compared to December 2022.
- The average sale price for a semi was $650,588. This represents a decrease of 21.5 per cent compared to January 2022 and an increase of 5.5 per cent compared to December 2022.

WRAR cautions that average sale price information can be useful in establishing long-term trends but should not be used as an indicator that specific properties have increased or decreased in value. The MLS® Home Price Index (HPI) provides the best way to gauge price trends because averages are strongly distorted by changes in the mix of sales activity from one month to the next.
MLS® Home Price Index Benchmark Price |
||||||
| Kitchener-Waterloo | Cambridge | |||||
| Benchmark Type: | January 2023 | Monthly % Change | Yr./Yr. % Change | January 2023 | Monthly % Change | Yr./Yr. % Change |
| Composite | $705,100 | -1.2 | -23.7 |
$731,000 |
2.4 | -21.3 |
| Detached | $789,900 | -1.4 | -25.9 | $757,200 | 2.9 | -23.2 |
| Townhouse | $583,100 | -1.8 | -17.6 | $638,300 | -0.2 | -8.0 |
| Apartment | $481,300 | 2.0 | -5.1 | $487,600 | -1.9 | -4.3 |


“On a monthly basis, we saw the average sale price increase across all property types in January,” says Bell. “I’m also noticing more multiple offers happening, especially on detached homes that are priced under eight hundred thousand dollars.”
Meanwhile, the Bank of Canada again increased interest rates at the end of January by 25 basis points to 4.5 per cent. “While not a huge increase, the continuance of interest rate hikes is an ongoing factor in the reduction of home sales within the market,” says Bell.
There were 579 new listings added to the MLS® System in Waterloo Region last month, a decrease of 13.3 per cent compared to January of last year and a 28.7 per cent decrease compared to the previous ten-year average for January.
The total number of homes available for sale in active status at the end of January was 651, an increase of 167.9 per cent compared to January of last year and 34.7 per cent below the previous ten-year average of 998 listings for January.
The number of months of inventory is up 233.3 per cent compared to January of last year, but still historically low at one month. Between 2011 and 2015, January’s average months of inventory was 3.0 months. The number of months of inventory represents how long it would take to sell off current inventories at the current sales rate.
The average number of days to sell in January was 25, compared to 9 days in January 2022. The previous 5-year average is 21 days.
WRAR’s president says, “The demographic of buyers is also shifting as we observe fewer buyers coming from the GTA into the region. While there are still some, it is nowhere like it was last January. These and other shifting influences mean it has never been more important for buyers and sellers to work with a local REALTOR® to help provide expertise during the homebuying and selling process.”
Affordability, combined with ongoing supply constraints, makes it difficult for buyers to navigate the continuous market changes while sellers also need to adjust to the evolving circumstances. Those requiring specific information on property values should contact a local REALTOR®. Working with a Realtor is the best way to get a complete picture of the property and community you are considering.
View our HPI tool here to learn more: https://wrar.ca/hpi/
Click on any of the graphs below for an interactive view.


WRAR cautions that average sale price information can help identify long-term trends but should not be to indicate that specific properties have increased or decreased in value. The average sale price is calculated based on the total dollar volume of all properties sold. Months Supply is the inventory of homes for sale at the end of a given month, divided by the average monthly closed sales from the last 12 months. Those requiring specific information on property values should contact a Waterloo Region REALTOR®. REALTORS® have their fingers on the pulse of the market. They know the questions to ask, the areas to probe and what to look for so that you get a complete picture of the property and community you’re considering.
Tags: buyers, for sale, Homes For Sale, Kitchener Buyers, kitchener for sale, kitchener real estate, Kitchener Sellers, kitchener-waterloo, KW Market Update, KW Real Estate, real estate, Royal Lepage Wolle Realty, Waterloo Sellers
This entry was posted on Friday, February 3rd, 2023 at 2:30 pm and is filed under Kitchener Buyers, Kitchener Sellers, Market Stats, Market Update, Real Estate News, Realtor Tips, Waterloo Buyers, Waterloo Sellers. You can follow any responses to this entry through the RSS 2.0 feed. Both comments and pings are currently closed.