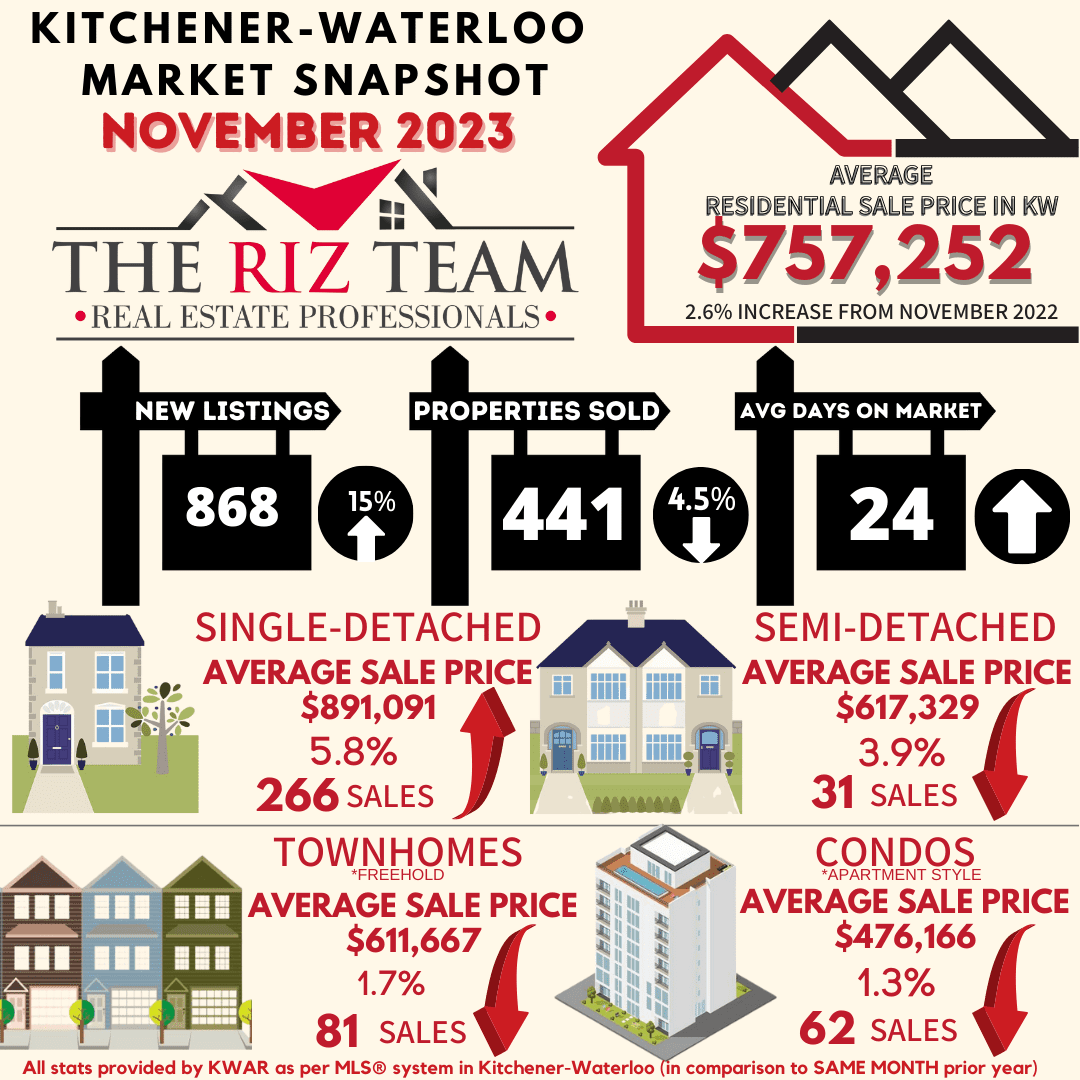
The Riz Team Blog

Posts Tagged ‘kitchener real estate’

Kitchener Waterloo Market Snapshot & Yearly Summary December 2022

Thursday, January 5th, 2023

Fewer Homes Sales in December Ends a Year of Weaker Sales Activity in Waterloo Region

If you are considering to Sell your home or Buy a home in the next short while it would be highly beneficial for you to connect with one of our Team Agents at

The Riz Team

Do you want to know what your home is worth today? Click Below for our Online No Obligation Market EvaluationClick Here

WATERLOO REGION, ON (January 5, 2023) —There were 7,770 homes sold through the Multiple Listing Service® (MLS®) System of the Waterloo Region Association of REALTORS® (WRAR) in 2022, a decrease of 24.8 per cent compared to 2021. On a historical basis, 2022 performed lower than previous years, with annual sales down 12.4 per cent compared to the previous 5-year average and 8.2 per cent below the previous 10-year average.

On a monthly basis, there were 280 homes sold in December, a decrease of 38.7 per cent compared to December 2021, and 32.3 per cent below the previous 5-year average for the month.

“The number of homes sold in December was lower than any single month in well over a decade, marking an end to a turbulent year for home sales in Waterloo Region,” says Megan Bell, President of WRAR.

Kitchener Waterloo Market Snapshot November 2022

Friday, December 2nd, 2022

Waterloo Region Home Prices Continue to Cool in November

“Home sales continued to decrease in November, as they traditionally do at this time of year,” “At the same time, we know ever-increasing homeownership costs are contributing to the decline and putting downward pressure on sales prices which have plateaued since July.”

If you are considering to Sell your home or Buy a home in the next short while it would be highly beneficial for you to connect with one of our Team Agents at

The Riz Team

Do you want to know what your home is worth today? Click Below for our Online No Obligation Market EvaluationClick Here

WATERLOO REGION, ON (December 2, 2022) —The number of homes sold through the Multiple Listing Service® (MLS®) System of the Waterloo Region Association of REALTORS® (WRAR) totaled 453 units, a decrease of 43.7 per cent compared to November 2021 and 34.2 per cent below the previous 5-year average for the month.

Total residential sales in November included 280 detached (down 38.3 per cent from November 2021), and 78 townhouses (down 57.1 per cent). Sales also included 58 condominium units (down 49.6 per cent) and 37 semi-detached homes (down 28.8 per cent).

“Home sales continued to decrease in November, as they traditionally do at this time of year,” says Megan Bell, President of WRAR. “At the same time, we know ever-increasing homeownership costs are contributing to the decline and putting downward pressure on sales prices which have plateaued since July.”

In November, the average sale price for all residential properties in Waterloo Region was $736,024. This represents a 10.4 per cent decrease compared to November 2021 and a 3.6 per cent decrease compared to October 2022.

  • The average price of a detached home was $838,609. This represents a 13.1 per cent decrease from November 2021 and a decrease of 3.5 per cent compared to October 2022.
  • The average sale price for a townhouse was $618,669. This represents a 12.3 per cent decrease from November 2021 and a decrease of 2.6 per cent compared to October 2022.
  • The average sale price for an apartment-style condominium was $458,384. This represents a decrease of 7.5 per cent from November 2021 and a decrease of 6.2 per cent compared to October 2022.
  • The average sale price for a semi was $642,328. This represents a decrease of 9.4 per cent compared to November 2021 and an increase of 3.2 per cent compared to October 2022.

WRAR cautions that average sale price information can be useful in establishing long-term trends but should not be used as an indicator that specific properties have increased or decreased in value. The MLS® Home Price Index (HPI) provides the best way to gauge price trends because averages are strongly distorted by changes in the mix of sales activity from one month to the next.

Capture
MLS® Home Price Index Benchmark Price
  Kitchener-Waterloo Cambridge
Benchmark Type: November 2022 Monthly % Change Yr./Yr. % Change November 2022

Monthly % Change

Yr./Yr. % Change
Composite $711,200 -1.7 -12.8 $744,200 1.8 -10.6
Detached $791,000 -2.1 -14.8 $770,600 2.5 -12.0
Townhouse $602,200 -0.2 -7.0 $652,000 -1.7 -2.0
Apartment $492,600 -0.4 8.0 $504,100 -3.1 3.7


November 2022 HPI Image for Stats Release

“The Waterloo Region market has been moving towards more of a balanced market throughout the latter part of the year, and November followed that trend,” says Bell. “We have a long way to go before the pendulum swings into it being a buyer’s market. However, if the Bank of Canada yet again raises its key interest rate on December 7, it is likely to result in fewer buyers competing for more inventory.”

There were 752 new listings added to the MLS® System in the Waterloo Region last month, a decrease of 6.6 per cent compared to November of last year and a 1.3 per cent increase compared to the previous ten-year average for November.

The total number of homes available for sale in active status at the end of November was 860, an increase of 209.4 per cent compared to November of last year and 29.9 per cent below the previous ten-year average of 1227 listings for November.

The number of months of inventory is up 333.3 per cent compared to November of last year, but still historically low at 1.3 months. Between 2009 and 2015, November’s average months of inventory was 3.2 months. The number of months of inventory represents how long it would take to sell off current inventories at the current sales rate.

The average number of days to sell in November was 21, compared to 10 days in November 2021. The previous 5-year average is 21 days.

WRAR’s president says, “It has never been more important for both buyers and sellers to work with a REALTOR® to help provide expertise during the homebuying and selling process. Affordability, combined with ongoing supply constraints, are making it difficult for buyers to navigate the continuous market changes while sellers are also having to adjust in concurrence with the evolving circumstances”.

Those requiring specific information on property values should contact a local REALTOR®. Working with a Realtor is the best way to get a complete picture of the property and community you are considering.

View our HPI tool here to learn more: https://wrar.ca/hpi/

Click on any of the graphs below for an interactive view.

Capture 2
Capture 3
Capture 9
Capture 5
Capture 10
Capture 7
Capture 8

WRAR cautions that average sale price information can help identify long-term trends but should not be to indicate that specific properties have increased or decreased in value. The average sale price is calculated based on the total dollar volume of all properties sold. Months Supply is the inventory of homes for sale at the end of a given month, divided by the average monthly closed sales from the last 12 months. Those requiring specific information on property values should contact a Waterloo Region REALTOR®. REALTORS® have their fingers on the pulse of the market. They know the questions to ask, the areas to probe and what to look for so that you get a complete picture of the property and community you’re considering.

Kitchener Waterloo Market Snapshot October 2022

Wednesday, October 5th, 2022

Fewer Home Sales in October


“Unsurprisingly, the pace of home sales continued to slow in October after the Bank of Canada’s sixth straight interest rate hike in September,” says Megan Bell, President of WRAR. “Faced with higher borrowing costs, some buyers have had to re-assess what they can afford. As these buyers get moved to the sidelines, sellers question if now is the best possible time to sell.”


If you are considering to Sell your home or Buy a home in the next short while it would be highly beneficial for you to connect with one of our Team Agents at

The Riz Team

Do you want to know what your home is worth today? Click Below for our Online No Obligation Market EvaluationClick Here


WATERLOO REGION, ON (November 2, 2022) —491 residential homes were sold last month through the Multiple Listing Service® (MLS®) System of the Waterloo Region Association of REALTORS® (WRAR), a decrease of 39.7 per cent compared to October 2021 and 36.2 per cent below the previous 5-year average for the month.

Total residential sales in October included 310 detached (down 38.2 per cent from October 2021), and 84 townhouses (down 45.1 per cent). Sales also included 64 condominium units (down 36.0 per cent) and 31 semi-detached homes (down 47.5 per cent).

“Unsurprisingly, the pace of home sales continued to slow in October after the Bank of Canada’s sixth straight interest rate hike in September,” says Megan Bell, President of WRAR. “Faced with higher borrowing costs, some buyers have had to re-assess what they can afford. As these buyers get moved to the sidelines, sellers question if now is the best possible time to sell.”

In October, the average sale price for all residential properties in Waterloo Region was $763,630. This represents an 8.4 per cent decrease compared to October 2021 and a 1.6 per cent increase compared to September 2022.

  • The average price of a detached home was $860,568. This represents a 10.6 per cent decrease from October 2021 and a decrease of 0.3 per cent compared to September 2022.
  • The average sale price for a townhouse was $635,197. This represents a 9.0 per cent decrease from October 2021 and a decrease of 0.4 per cent compared to September 2022.
  • The average sale price for an apartment-style condominium was $488,277. This represents an increase of 3.9 per cent from October 2021 and an increase of 7.3 per cent compared to September 2022.
  • The average sale price for a semi was $624,999. This represents a decrease of 10.8 per cent compared to October 2021 and a decrease of 1.9 per cent compared to September 2022.
october 2022 average sales price by property type 2

WRAR cautions that average sale price information can be useful in establishing long-term trends but should not be used as an indicator that specific properties have increased or decreased in value. The MLS® Home Price Index (HPI) provides the best way to gauge price trends because averages are strongly distorted by changes in the mix of sales activity from one month to the next.

MLS® Home Price Index Benchmark Price

Kitchener-Waterloo Cambridge
Benchmark Type: October 2022 Monthly % Change Yr./Yr. % Change October 2022 Monthly % Change Yr./Yr. % Change
Composite $723,200 -0.2 -8.8 $730,700 -2.3 -9.8
Detached $807,900 -0.0 -10.1 $751,800 -2.1 -11.6
Townhouse $603,700 -1.3 -3.2 $663,100 -2.4 1.8
Apartment $494,400 -0.1 6.5 $520,100 -6.6 7.3


October 2022 HPI Stats Chart for Kitchener Waterloo Cambridge

“While there is uncertainty in the minds of consumers about current market conditions, one thing is for certain, Waterloo region’s housing supply remains one of the tightest in the country,” says Bell.  “Buyers may be on the sidelines for now due to affordability, but the underlying demand for housing remains strong.”

There were 827 new listings added to the MLS® System in the Waterloo Region last month, a decrease of 3.3 per cent compared to October of last year and a 14.3 per cent decrease compared to the previous ten-year average for October.

The total number of homes available for sale in active status at the end of October was 928, an increase of 134.9 per cent compared to October of last year and 34.9 per cent below the previous ten-year average of 1425 listings for October.

The number of months of inventory is up 160.0 per cent compared to October of last year, but still historically low at 1.3 months. Between 2009 and 2015, October’s average months of inventory was 3.6 months. The number of months of inventory represents how long it would take to sell off current inventories at the current sales rate.

The average number of days to sell in October was 22, compared to 10 days in October 2021. The previous 5-year average is 19 days.

Those requiring specific information on property values should contact a local REALTOR®.  Working with a Realtor is the best way to get a complete picture of the housing market, your particular property and the community you are considering.

View our HPI tool here to learn more: https://wrar.ca/hpi/

Click on any of the graphs below for an interactive view.

October-2022-average-sale-price-by-municipality
October 2022 average sale price by township
October 2022 sales by property type
October 2022 Months Supply
October 2022 median sales price by property type
October 2022 average sale price by property type
October 2022 average days on market

Kitchener Waterloo Market Snapshot August 2022

Wednesday, September 7th, 2022

Rising Borrowing Costs Continue to Tame Home Sales in August


“The decline was most pronounced in the apartment-style condo and townhouse categories which could indicate that rising borrowing costs are having a greater impact on first-time buyers and those looking for more affordable options.”   

If you are considering to Sell your home or Buy a home in the next short while it would be highly beneficial for you to connect with one of our Team Agents at

The Riz Team

Do you want to know what your home is worth today? Click Below for our Online No Obligation Market EvaluationClick Here

WATERLOO REGION, ON (September 7, 2022) — 659 residential homes were sold last month through the Multiple Listing Service® (MLS®) System of the Waterloo Region Association of REALTORS® (WRAR) in August, a decrease of 8.1 per cent compared to August 2021 and 11.2 per cent below the previous 5-year average for the month.

Total residential sales in August included 413 detached (down 0.7 per cent from August 2021), and 117 townhouses (down 24.0 per cent). Sales also included 68 condominium units (down 26.1 per cent) and 61 semi-detached homes (up 10.9 per cent).

“While the number of homes sold in August was down on a year-over-year basis they were up almost 19 per cent compared to July,” says Megan Bell, president of WRAR. “The decline was most pronounced in the apartment-style condo and townhouse categories which could indicate that rising borrowing costs are having a greater impact on first-time buyers and those looking for more affordable options.”

In August, the average sale price for all residential properties in Waterloo Region was $750,849. This represents a 0.4 per cent decrease compared to August 2021 and a 0.2 per cent decrease compared to July 2022.

  • The average price of a detached home was $851,654. This represents a 3.0 per cent decrease from August 2021 and an increase of 1.1 per cent compared to July 2022.
  • The average sale price for a townhouse was $610,725. This represents a 4.2 per cent decrease from August 2021 and a decrease of 5.2 per cent compared to July 2022.
  • The average sale price for an apartment-style condominium was $464,959. This represents an increase of 4.3 per cent from August 2021 and a decrease of 10.9 per cent compared to July 2022.
  • The average sale price for a semi was $655,813. This represents a decrease of 1.0 per cent compared to August 2021 and a decrease of 0.8 per cent compared to July 2022.

WRAR cautions that average sale price information can be useful in establishing long-term trends but should not be used as an indicator that specific properties have increased or decreased in value. The MLS® Home Price Index (HPI) provides the best way to gauge price trends because averages are strongly distorted by changes in the mix of sales activity from one month to the next.

MLS® Home Price Index Benchmark Price 
  Kitchener-Waterloo  Cambridge 
Benchmark Type:  August 2022  Monthly % Change  Yr./Yr. % Change  August 2022  Monthly % Change  Yr./Yr. % Change 
Composite  $734,500  -1.9  -2.2  $750,700  -3.4  0.6 
Detached  $815,000  -1.5  -3.9  $764,700  -3.1  -1.3 
Townhouse  $618,400  -3.8  5.4  $715,200  -5.9  11.7 
Apartment  $513,600  -2.1  16.1  $578,500  -1.1  19.0 


“Today’s announcement by the Bank of Canada to increase its policy rate by 75 basis points to 3.25 per cent is discouraging news for borrowers as it affects their purchasing power,” says Bell. “However, we see signs that the market is moving towards more buyer-friendly conditions. REALTORS® are reporting fewer multiple offers resulting in final sale prices being closer to the asking price or with more conditions accompanying offers. Even so, with inventory still very tight, Waterloo region remains a seller’s market.”

There were 933 new listings added to the MLS® System in the Waterloo Region last month, an increase of 19.3 per cent compared to August of last year, and a 1.2 per cent increase compared to the previous ten-year average for August.

The total number of homes available for sale in active status at the end of August was 1,003, an increase of 188.2 per cent compared to August of last year, and 31.8 per cent below the previous ten-year average of 1593 listings for August.

The number of months of inventory is up 250 per cent compared to August of last year, but still historically low. There were 1.4 months of inventory in August 2022, down from 1.8 months in July 2022. The number of months of inventory represents how long it would take to sell off current inventories at the current sales rate.

The average number of days to sell in August was 22, compared to 12 days in August 2021. The previous 5-year average is 22 days.

Those requiring specific information on property values should contact a local REALTOR®.  Working with a Realtor is the best way to get a complete picture of the property and community you are considering.

View our HPI tool here to learn more: https://wrar.ca/hpi/

Click on any of the graphs below for an interactive view.

Kitchener Waterloo Market Snapshot July 2022

Friday, August 5th, 2022

“In the wake of July’s interest rate hike, home sales in Waterloo Region continued to slow,” says Megan Bell, President of WRAR. “We’re seeing a clear shift in the market and what people can afford to purchase or are willing to pay. On the bright side for buyers, it’s not the extreme sellers’ market it was.”

If you are considering to Sell your home or Buy a home in the next short while it would be highly beneficial for you to connect with one of our Team Agents at

The Riz Team

Do you want to know what your home is worth today? Click Below for our Online No Obligation Market Evaluation

Click Here

WATERLOO REGION, ON (August 5, 2022) — 550 residential homes were sold through the Multiple Listing Service® (MLS®) System of the Waterloo Region Association of REALTORS® (WRAR) in July, a decrease of 32.8 per cent compared to July 2021, and 32.3 per cent below the previous 5-year average for the month.

Total residential sales in July included 337 detached (down 30.4 per cent from July 2021), and 112 townhouses (down 32.9 per cent). Sales also included 65 condominium units (down 39.3 per cent) and 36 semi-detached homes (down 41.0 per cent).

In July, the average sale price for all residential properties in Waterloo Region was $752,301. This represents a 1.2 per cent decrease compared to July 2021 and a 4.9 per cent decrease compared to June 2022.

  • The average price of a detached home was $842,241. This represents a 6.0 per cent decrease from July 2021 and a decrease of 7.0 per cent compared to June 2022.
  • The average sale price for a townhouse was $642,750. This represents a 3.6 per cent increase from July 2021 and a decrease of 3.3 per cent compared to June 2022.
  • The average sale price for an apartment-style condominium was $521,731. This represents an increase of 20.4 per cent from July 2021 and an increase of 4.1 per cent compared to June 2022.
  • The average sale price for a semi was $661,087. This represents an increase of 1.0 per cent compared to July 2021 and a decrease of 5.4 per cent compared to June 2022.
Price by Property Type July

WRAR cautions that average sale price information can be useful in establishing long-term trends but should not be used as an indicator that specific properties have increased or decreased in value. The MLS® Home Price Index (HPI) provides the best way to gauge price trends because averages are strongly distorted by changes in the mix of sales activity from one month to the next.

MLS® Home Price Index Benchmark Price

  Kitchener-Waterloo Cambridge
Benchmark Type: July 2022 Monthly % Change Yr./Yr. % Change July 2022 Monthly % Change Yr./Yr. % Change
Composite $749,000 -5.3 1.1 $776,900 -3.9 3.4
Detached $827,100 -5.6 -0.8 $789,600 -4.2 1.3
Townhouse $642,500 -5.1 10.5 $760,500 -2.6 17.7
Apartment $524,800 -2.3 17.4 $584,700 -0.0 20.1


MLS® Home Price Index (HPI)

“The real estate market is cooling across the province, and we are seeing significantly fewer buyers from the GTA, which is also impacting prices,” reports Bell. “However, this is not entirely bad news since the previous market was not sustainable. We are all keenly aware of the issues relating to affordability of not just purchasing a home, but rentals as well, and there is clearly more work to be done.”

There were 1,174 new listings added to the MLS® System in the Waterloo Region last month, an increase of 34.0 per cent compared to July of last year, and a 9.2 per cent increase compared to the previous ten-year average for July.

The total number of homes available for sale in active status at the end of July was 1,283, an increase of 215.2 per cent compared to July of last year, and 19.5 per cent below the previous ten-year average of 1593 listings for July.

The number of months of inventory was 1.7 months in July, as it was in June. While this is still at historic lows, the last time it was near this range was September of 2019 when it was 1.6 months.  The number of months of inventory represents how long it would take to sell off current inventories at the current sales rate.

The average number of days to sell in July was 18, compared to 11 days in July 2021. The previous 5-year average is 17 days.

Those requiring specific information on property values should contact a local REALTOR®.  Working with a Realtor is the best way to get a complete picture of the property and community you are considering.

View our HPI tool here to learn more: https://wrar.ca/hpi/

Click on any of the graphs below for an interactive view.

July Average Sales Price WRAR
Average Sales Price - Tonwnship WRAR
Sales - By Property Type WRAR
Months Supply of Homes for Sale July
Monthly Median Sales Price – By Property Type July
Monthly Average Sales Price – By Property Type July
July Days on Market WRAR
KWAR cautions that average sale price information can be useful in establishing long term trends but should not be used as an indicator that specific properties have increased or decreased in value. The average sale price is calculated based on the total dollar volume of all properties sold. Months Supply is the inventory of homes for sale at the end of a given month, divided by the average monthly closed sales from the last 12 months Those requiring specific information on property values should contact a local REALTOR®. REALTORS® have their fingers on the pulse of the market. They know the questions to ask, the areas to probe and what to look for so that you get a complete picture of the property and community you’re considering.

Kitchener Waterloo Market Snapshot June 2022

Wednesday, July 6th, 2022

HOME PRICES CONTINUE TO DIP AS MONTHS SUPPLY RETURNS TO PRE-PANDEMIC LEVEL

If you are considering to Sell your home or Buy a home in the next short while it would be highly beneficial for you to connect with one of our Team Agents at

The Riz Team

Do you want to know what your home is worth today? Click Below for our Online No Obligation Market Evaluation

The Riz Team monthly market stats June 2022. Kitchener Waterloo, ON.


There were 561 residential homes sold through the Multiple Listing Service® System (MLS® System) of the Kitchener-Waterloo Association of REALTORS® (KWAR) in June, a decrease of 24.0 per cent compared to the same month last year, and 17.3 per cent below the previous 5-year average. “For the fourth consecutive month we’re seeing home prices moderate as the number of properties available for sale has steadily increased” says Megan Bell, President of KWAR. “In June the average price of a detached home has levelled off to where it was this time last year.”

Total residential sales in June included 326 detached (down 20.7 per cent from June 2021), and 103 townhouses (down 32.2 per cent). Sales also included 84 condominium units (down 18.4 per cent) and 48 semi-detached homes (down 33.3 per cent).

In June, the average sale price for all residential properties in the Kitchener-Waterloo area was $791,674. This represents a 4.2 per cent increase over June 2021 and a 9.6 per cent decrease compared to May 2022.


  • The average price of a detached home was $920,349. This represents a 0.0 per cent change from June 2021 and a decrease 9.5 per cent compared to May 2022.
  • The average sale price for a townhouse was $662,305. This represents a 11.9 per cent increase from June 2021 and a decrease of 6.5 per cent compared to May 2022.
  • The average sale price for an apartment-style condominium was $497,429. This represents an increase of 11.7 per cent from June 2021 and a decrease of 8.9 per cent compared to May 2022.
  • The average sale price for a semi was $710,284. This represents an increase of 9.5 per cent compared to June 2021 and a decrease of 2.8 per cent compared to May 2022.

KWAR cautions that average sale price information can be useful in establishing long-term trends but should not be used as an indicator that specific properties have increased or decreased in value. The MLS® Home Price Index (HPI) provides the best way to gauge price trends because averages are strongly distorted by changes in the mix of sales activity from one month to the next.

The MLS® HPI composite benchmark price for all residential properties in Kitchener-Waterloo was $790,600 in June. This represents a 6.8 per cent increase over June 2021 and a 6.8 per cent decrease compared to May 2022.

  • The benchmark price for a detached home was $876,600. This represents a 5.3 per cent increase from June 2021 and 7.3 per cent decrease compared to May 2022.
  • The benchmark price for a townhouse is $676,900. This represents a 15.8 per cent increase from June 2021 and a 7.1 per cent decrease compared to May 2022.
  • The benchmark price for an apartment-style condominium was $537,100. This represents a 24.2 per cent increase from June 2021 and a 2.4 per cent decrease compared to May 2022.

“This time last year, sales were going through the roof,” says Bell. “The home buying scene is a little different this year with folks finally taking their postponed trips, attending weddings, and generally catching up on the many missed occasions of the past two years.” Of course, recent hikes in mortgage rates are also contributing to sales cooling, notes KWAR’s president.

“While any shift in the market will result in some individuals predicting the worse, the simple reality is that the market we had been in was unsustainable,” says Bell. “What this means for buyers is more inventory, more choices, and perhaps most importantly, potentially less stress when purchasing. For sellers, they need to ensure their properties stand out from the competition and be aware it may take more time to sell their home and for potentially less money than they were expecting.”

There were 1,285 new listings added to the MLS® System in KW and area last month, an increase of 49.2 per cent compared to June of last year, and a 41.7 per cent increase compared to the previous ten-year average for June.

The total number of homes available for sale in active status at the end of June was 991, an increase of 165.0 per cent compared to June of last year, and 20.6 per cent below the previous ten-year average of 1249 listings for June.

The number of months of inventory increased to 1.8 months in June from 1.6 months in May. While inventory is still at historic lows, this is the highest it’s been since September 2019 and a return to where inventory was in the pre-pandemic June of 2019. The number of months of inventory represents how long it would take to sell off current inventories at the current rate of sales.

The average number of days to sell in June was 13 days, compared to 11 days in June 2021. The previous 5-year average is 17 days.

Those requiring specific information on property values should contact a local REALTOR®.  Working with a Realtor is the best way to get a complete picture of the property and community you are considering.

View our HPI tool here to learn more: https://kwar.ca/hpi-dashboard


Historical Sales By Property Type

Months Supply of Homes for Sale


Historical Median Sales Price – By Property Type


Historical Average Sales Price – By Property Type

Average Days on Market

KWAR cautions that average sale price information can be useful in establishing long term trends but should not be used as an indicator that specific properties have increased or decreased in value. The average sale price is calculated based on the total dollar volume of all properties sold. Months Supply is the inventory of homes for sale at the end of a given month, divided by the average monthly closed sales from the last 12 months Those requiring specific information on property values should contact a local REALTOR®. REALTORS® have their fingers on the pulse of the market. They know the questions to ask, the areas to probe and what to look for so that you get a complete picture of the property and community you’re considering.

Kitchener-Waterloo Market Snapshot May 2022

Friday, June 3rd, 2022

LISTINGS INCREASE WHILE HOME SALES SLOW IN MAY

If you are considering to Sell your home or Buy a home in the next short while it would be highly beneficial for you to connect with one of our Team Agents at

The Riz Team

Do you want to know what your home is worth today? Click Below for our Online No Obligation Market Evaluation

There were 661 residential homes sold through the Multiple Listing Service® System (MLS® System) of the Kitchener-Waterloo Association of REALTORS® (KWAR) in May, a decrease of 22.7 per cent compared to the same month last year, and 5.5 per cent below the previous 5-year average.

“The increase by the Bank of Canada to the key interest rate in April had the predictable result of knocking some buyers down if not out of the market in May,” says Megan Bell, President of KWAR. “While the impact to prices is small, it has had a critical impact on some buyers and what they can now afford.”

Total residential sales in May included 404 detached (down 16.7 per cent from May 2021), and 115 townhouses (down 38.5 per cent). Sales also included 95 condominium units (down 12.0 per cent) and 47 semi-detached homes (down 36.5 per cent).

In May, the average sale price for all residential properties in the Kitchener-Waterloo area was $875,194. This represents a 18.3 per cent increase over May 2021 and a 3.5 per cent decrease compared to April 2022.

  • The average price of a detached home was $1,016,834. This represents a 17.0 per cent increase from May 2021 and a decrease 4.2 per cent compared to April 2022.
  • The average sale price for a townhouse was $708,722. This represents a 17.7 per cent increase from May 2021 and a decrease of 7.2 per cent compared to April 2022.
  • The average sale price for an apartment-style condominium was $545,825. This represents an increase of 19.7 per cent from May 2021 and a decrease of 9.1 per cent compared to April 2022.
  • The average sale price for a semi was $730,768. This represents an increase of 10.7 per cent compared to May 2021 and a decrease of 7.0 per cent compared to April 2022.

KWAR cautions that average sale price information can be useful in establishing long-term trends but should not be used as an indicator that specific properties have increased or decreased in value. The MLS® Home Price Index (HPI) provides the best way to gauge price trends because averages are strongly distorted by changes in the mix of sales activity from one month to the next.

The MLS® HPI composite benchmark price for all residential properties in Kitchener-Waterloo was $848,600 in May. This represents a 15.1 per cent increase over May 2021 and a 4.7 per cent decrease compared to April 2022.


  • The benchmark price for a detached home was $945,800. This represents a 14.6 per cent increase from May 2021 and 4.9 per cent decrease compared to April 2022.

“With the announcement from the Bank of Canada about another interest rate hike this week we may see a   resurgence of buyers who have locked in at a lesser rate, but as borrowing costs continue to increase, we should expect demand will continue to soften, particularly in the more entry-level segment of the market,” says Bell.

There were 1,422 new listings added to the MLS® System in KW and area last month, an increase of 33.9 per cent compared to May of last year, and a 40.4 per cent increase compared to the previous ten-year average for May.

The total number of homes available for sale in active status at the end of May was 902, an increase of 98.2 per cent compared to May of last year, and 28.8 per cent below the previous ten-year average of 1267 listings for May.

The number of months of inventory increased to 1.6 months in May from 1.2 months in April. While inventory is still at historic lows, this is the highest it’s been since September 2019. The number of months of inventory represents how long it would take to sell off current inventories at the current rate of sales.

The average number of days to sell in May was 11 days, compared to 9 days in May 2021. The previous 5-year average is 16 days.

Those requiring specific information on property values should contact a local REALTOR®.  Working with a Realtor is the best way to get a complete picture of the property and community you are considering.

View our HPI tool here to learn more: https://kwar.ca/hpi-dashboard

**click on any chart for an interactive view**

Historical Sales By Property Type

Months Supply of Homes for Sale

Historical Median Sales Price – By Property Type

Historical Average Sales Price – By Property Type

Average Days on Market Chart

KWAR cautions that average sale price information can be useful in establishing long-term trends but should not be used as an indicator that specific properties have increased or decreased in value. The average sale price is calculated based on the total dollar volume of all properties sold. Months Supply is the inventory of homes for sale at the end of a given month, divided by the average monthly closed sales from the last 12 months Those requiring specific information on property values should contact a local REALTOR®. REALTORS® have their fingers on the pulse of the market. They know the questions to ask, the areas to probe and what to look for so that you get a complete picture of the property and community you’re considering.

Kitchener-Waterloo Market Snapshot March 2022

Monday, April 4th, 2022

KITCHENER-WATERLOO HOME SALES UP IN MARCH, AVERAGE PRICE DIPS FROM FEBRUARY

“The skyrocketing prices of the last two months took a bit of a breather in March, with the overall average price dipping five per cent compared to what we saw in February,” said Megan Bell, President of KWAR. “While it is too soon to draw conclusions from just one month of home sales, I know many will be comforted to see a leveling off on the average price, no matter how incremental.”

If you are considering to Sell your home or Buy a home in the next short while it would be highly beneficial for you to connect with one of our Team Agents at

The Riz Team

Do you want to know what your home is worth today? Click Below for our Online No Obligation Market Evaluation


Total residential sales in March included 416 detached (down 29.7 per cent from March 2021), and 114 condominium units (down 9.5 per cent). Sales also included 64 semi-detached homes (down 17.9 per cent) and 131 townhouses (down 33.8 per cent).

In March, the average sale price for all residential properties in the Kitchener-Waterloo area was $960,181. This represents a 25.5 per cent increase over March 2021 and a 4.6 per cent decrease compared to February 2022.

  • The average price of a detached home was $1,132,637. This represents a 25.9 per cent increase from March 2021 and a decrease 6.4 per cent compared to February 2022.
  • The average sale price for an apartment-style condominium was $565,782. This represents an increase of 33.4 per cent from March 2021 and a decrease of 1.2 per cent compared to February 2022.
  • The average sale price for a townhouse was $796,696. This represents a 27.4 per cent increase from March 2021 and a decrease of 7.6 per cent compared to February 2022.
  • The average sale price for a semi was $876,371. This represents an increase of 34.5 per cent compared to March 2021 and a decrease of 5.0 per cent compared to February 2022.

KWAR cautions that average sale price information can be useful in establishing long-term trends but should not be used as an indicator that specific properties have increased or decreased in value. The MLS®® Home Price Index (HPI) provides the best way to gauge price trends because averages are strongly distorted by changes in the mix of sales activity from one month to the next.

The MLS® HPI composite benchmark price for all residential properties in Kitchener-Waterloo was $960,100 in March. This represents a 29.6 per cent increase over March 2021 and a 1.5 per cent decrease compared to February 2022.

  • The benchmark price for a detached home was $1,046,200. This represents a 28.1 per cent increase from March 2021 and 4.0 per cent decrease compared to February 2022.
  • The benchmark price for an apartment-style condominium was $484,000. This represents a 32.9 per cent increase from March 2021 and a 4.2 per cent increase compared to February 2022.
  • The benchmark price for a townhouse is $765,500. This represents a 41.3 per cent increase from March 2021 and a 4.9 per cent increase compared to February 2022.

“Even though the average price decreased across all property types on a month-to-month basis, the MLS® HPI showed continued monthly gains for both townhouse and apartment property types,” notes Bell.  “As the province feels its way out of the pandemic, we are beginning to see some very preliminary signs of a potential cooling. We are not seeing quite as many multiple offers and some offers are coming in with conditions. Of course, when we say cooling, we’re talking about a market that has been scorching hot which is why we are pleased to see this happening.”

There were 1,131 new listings added to the MLS® System in KW and area last month, a decrease 16.8 per cent compared to the record topping number of listings added in March of last year, and a 28.0 per cent increase compared to the previous ten-year average for March.

The total number of homes available for sale in active status at the end of March was 441, an increase of 1.1 per cent compared to March of last year, and 59.0 per cent below the previous ten-year average of 1,072 listings for March.

The number of months of inventory nudged up to 0.7 months in March from 0.5 months in February. Inventory has been under the one-month mark since October 2020. The number of months of inventory represents how long it would take to sell off current inventories at the current rate of sales.

The average number of days to sell in March was 8 days, the same as it was in March 2021. The previous 5-year average is 16 days.

The More Homes for Everyone Act

Statement from KWAR President Megan Bell

Last week the Government of Ontario introduced a new bill, the More Homes for Everyone Act to address the province’s housing affordability crisis.

While we welcome several aspects of the proposed More Homes for Everyone bill, such as measures to support more timely municipal decision making and developing policies and tools to support multi-generational homes in existing neighbourhoods—bolder actions to increase supply were notably missing.

Ontario’s Housing Affordability Task Force had recommended limiting exclusionary zoning and allowing “as of right” residential housing up to four units and up to four storeys on a single residential lot. Instead, the government has committed to the Task Force’s recommendations as part of a “long term roadmap”.

KWAR is optimistic Waterloo Region will be bold about housing in their official plan update

Ending exclusionary zoning to allow for gentle density in our neighbourhoods is critical to filling the lack of “missing middle” supply for family-sized households.

While Minister Clark states that some municipalities (such as Toronto and Mississauga) were not ready, KWAR is optimistic that the Region of Waterloo (ROW) will take a more progressive view toward increasing density.  On the development side, the Waterloo region has been exceeding density targets set by the province. At KWAR’s recently held Where Do We Grow From Here Symposium we learned from the ROW’s Commissioner, Rod Regier the Region is proposing policies for the ROW official plan that would see a tiered approach to missing middle housing by allowing 4 units and up to 4 storeys, as-of-right, on all land currently zoned residential and on any new greenfield land (residential); and allow a range of 8 to 12 storeys, along specific corridors, such as the ION corridor.

KWAR encourages the Region of Waterloo to stay the course on its bold proposals for its Regional Official Plan and create ways to bring a broad range of housing options to our community.

Those requiring specific information on property values should contact a local REALTOR®.  Working with a Realtor is the best way to get a complete picture of the property and community you are considering.

View our HPI tool here to learn more: https://kwar.ca/hpi-dashboard

Historical Sales By Property Type

Months Supply of Homes for Sale

Historical Median Sales Price – By Property Type

Historical Average Sales Price – By Property Type

Average Days on Market Chart

KWAR cautions that average sale price information can be useful in establishing long term trends but should not be used as an indicator that specific properties have increased or decreased in value. The average sale price is calculated based on the total dollar volume of all properties sold. Months Supply is the inventory of homes for sale at the end of a given month, divided by the average monthly closed sales from the last 12 months Those requiring specific information on property values should contact a local REALTOR®. REALTORS® have their fingers on the pulse of the market. They know the questions to ask, the areas to probe and what to look for so that you get a complete picture of the property and community you’re considering.

Kitchener-Waterloo Market Snapshot February 2022

Thursday, March 3rd, 2022

ABOVE AVERAGE NUMBER OF HOME SALES AND MORE LISTINGS IN FEBRUARY

If you are considering to Sell your home or Buy a home in the next short while it would be highly beneficial for you to connect with one of our Team Agents at

The Riz Team

Do you want to know what your home is worth today? Click Below for our Online No Obligation Market Evaluation


The 600 residential homes sold last month through the Multiple Listing Service® (MLS® System) of the Kitchener-Waterloo Association of REALTORS® (KWAR) is almost on par with February 2021, and an increase of 48.5 per cent compared to the previous month. The previous ten-year average number of residential sales for February is 424.

“In January we reported that the average price of a detached home crossed the million-dollar mark for the first time in December. Now in February, we have reached a new milestone with the average sale price of all residential property types coming in at just over one million dollars in the Kitchener-Waterloo and area,” said Megan Bell, President of KWAR. “While I think it’s premature to suggest this is the new norm, it does reflect the continued appeal of Waterloo Region to buyers. We also need to be aware and recognize the impact this has on affordability for a growing number of people.”

Total residential sales in February included 331 detached (down 2.1 per cent from February 2021), and 110 condominium units (up 7.8 per cent). Sales also included 44 semi-detached homes (down 4.3 per cent) and 115 townhouses (up 2.7 per cent).

In February, the average sale price for all residential properties in the Kitchener-Waterloo area was $1,007,109. This represents a 33.6 per cent increase over February 2021 and a 5.6 per cent increase compared to January 2022.


  • The average price of a detached home was $1,214,067. This represents a 33.1 per cent increase from February 2021 and an increase of 5.3 per cent compared to January 2022.
  • The average sale price for an apartment-style condominium was $572,731. This represents an increase of 37.4 per cent from February 2021 and an increase of 6.9 per cent compared to January 2022.
  • The average sale price for a townhouse was $862,994. This represents a 41.6 per cent increase from February 2021 and an increase of 2.1 per cent compared to January 2022.
  • The average sale price for a semi was $917,535. This represents an increase of 33.8 per cent compared to February 2021 and an increase of 8.0 per cent compared to January 2022.

KWAR cautions that average sale price information can be useful in establishing long-term trends but should not be used as an indicator that specific properties have increased or decreased in value. The MLS®® Home Price Index (HPI) provides the best way to gauge price trends because averages are strongly distorted by changes in the mix of sales activity from one month to the next.

The MLS® HPI composite benchmark price for all residential properties in Kitchener-Waterloo was $974,600 in February. This represents a 36.8 per cent increase over February 2021 and a 5.4 per cent increase compared to January 2022.

  • The benchmark price for a detached home was $1,090,000. This represents a 38.2 per cent increase from February 2021 and 5.0 per cent increase compared to January 2022.
  • The benchmark price for an apartment-style condominium was $ 464,400. This represents a 33.8 per cent increase from February 2021 and a 6.1 per cent increase compared to January 2022.
  • The benchmark price for a townhouse is $729,900. This represents a 41.9 per cent increase from February 2021 and a 7.0 per cent increase compared to January 2022.

“The low listing inventory is not because people are not selling their homes, in fact we saw a spurt in the number of new listings in February, said Bell. “With homebuying demand still going strong, competition remains high, and homes were snapped up quickly.”

There were 806 new listings added to the MLS® System in KW and area last month, an increase of 9.5 per cent compared to February of last year, and a 24.3 per cent increase compared to the previous ten-year average for February.

The total number of homes available for sale in active status at the end of February was 290, a decrease of 2.7 per cent compared to February of last year, and 70.3 per cent below the previous ten-year average of 975 listings for February.

The number of months of inventory nudged up to 0.5 months in February from 0.3 months in January. Inventory has been under the one-month mark since October 2020. The number of months of inventory represents how long it would take to sell off current inventories at the current rate of sales.

The average number of days to sell in February was 8 days, compared to 10 days in February 2021 and a previous 5-year average of 19 days.

Those requiring specific information on property values should contact a local REALTOR®.  Working with a Realtor is the best way to get a complete picture of the property and community you are considering.

View our HPI tool here to learn more: https://kwar.ca/hpi-dashboard

Historical Sales By Property Type

Months Supply of Homes for Sale

Historical Median Sales Price – By Property Type

Historical Average Sales Price – By Property Type

Average Days on Market Chart

KWAR cautions that average sale price information can be useful in establishing long-term trends but should not be used as an indicator that specific properties have increased or decreased in value. The average sale price is calculated based on the total dollar volume of all properties sold. Months Supply is the inventory of homes for sale at the end of a given month, divided by the average monthly closed sales from the last 12 months Those requiring specific information on property values should contact a local REALTOR®. REALTORS® have their fingers on the pulse of the market. They know the questions to ask, the areas to probe and what to look for so that you get a complete picture of the property and community you’re considering.

Kitchener-Waterloo Market Snapshot December 2021

Wednesday, January 5th, 2022

Average Price of a Detached Home Reaches Million-dollar Milestone in December

HOME SALES IN 2021 SMASHED LAST YEAR’S RECORD-BREAKING TOTAL BY OVER 1000 UNITS

The 7,581 residential homes sold through the Multiple Listing System (MLS® System) of the Kitchener-Waterloo Association of REALTORS® (KWAR) in 2021 represent an increase of 18.3 per cent compared to last year’s record-setting number of sales that ended the year 2020.

On a monthly basis, there were 344 residential homes sold last month, a decrease of 1.7 percent compared to the same month last year.

“Home sales in 2021 have absolutely smashed last year’s record by more than 1,000 units,” says KWAR’s president, Megan Bell. “While this is a good time to sell your home, it remains a tremendously difficult market for buyers. Affordability for all types of housing within our community continues to be a concern which we expect to continue throughout 2022.”

Total residential sales in December included 177 detached (down 12.4 per cent from December 2020), and 56 condominium units (down 11.1 per cent). Sales also included 23 semi-detached homes (up 9.5 per cent) and 88 townhouses (up 37.5 per cent).

For 2021, total residential sales included 4,272 detached (up 10.8 per cent), and 1,127 condominium units (up 43.4 per cent). Sales also included 578 semi-detached homes (up 31.1 per cent) and 1,602 townhouses (up 20.9 per cent).

In December, the average sale price for all residential properties in the Kitchener-Waterloo area was $842,014. This represents a 32.5 per cent increase over December 2020 and a 2.5 per cent increase compared to November 2021.

  • The average price of a detached home was $1,021,353. This represents a 34.7 per cent increase from December 2020 and an increase of 3.4 per cent compared to November 2021.
  • The average sale price for an apartment-style condominium was $500,352. This represents an increase of 30.6 per cent from December 2020 and an increase of 1.0 per cent compared to November 2021.
  • The average sale price for a townhouse was $717,475. This represents a 39.4 per cent increase from December 2020 and an increase of 2.1 per cent compared to November 2021.
  • The average sale price for a semi was $770,246. This represents an increase of 33.5 per cent compared to December 2020 and an increase 7.3 per cent compared to November 2021.

On a year-to-date basis, the average sale price for all residential properties in the Kitchener-Waterloo area increased 25.8 per cent to $770,596 compared to 2020.

  • The year-to-date average price of a detached home was $920,726. This represents a 28.0 per cent increase compared to 2020.
  • The year-to-date average sale price for an apartment-style condominium was $448,208. This represents an increase of 17.3 compared to 2020
  • The year-to-date average sale price for a townhouse was $632,875. This represents an increase of 34.9 per cent compared to 2020.
  • The year-to-date average sale price for a semi was $673,543. This represents an increase of 29.4 per cent compared to 2020.

KWAR cautions that average sale price information can be useful in establishing long-term trends but should not be used as an indicator that specific properties have increased or decreased in value. The MLS® Home Price Index (HPI) provides the best way to gauge price trends because averages are strongly distorted by changes in the mix of sales activity from one month to the next.

The MLS® HPI composite benchmark price for all residential properties in Kitchener-Waterloo was $851,700 in December. This represents a 32.1 per cent increase over December 2020 and a 3.2 per cent increase compared to November 2021.

  • The benchmark price for a detached home was $945,600. This represents a 33.5 per cent increase from December 2020 and 3.3 per cent increase compared to November 2021.
  • The benchmark price for an apartment-style condominium was $412,700. This represents a 21.1 per cent increase from December 2020 and a 3.7 per cent increase compared to November 2021.
  • The benchmark price for a townhouse is $647,000. This represents a 40.0 per cent increase from December 2020 and a 3.0 per cent increase compared to November 2021.

There were 291 new listings added to the MLS® System in KW and area last month, an increase of 1.7 per cent compared to December of last year, and a 14.6 per cent increase compared to the previous ten-year average for December.

On a year-to-date basis, there were 9,040 new listings added to the MLS® System in KW and area in 2021, an increase of 11.5 per cent compared to 2020, and a 3.8 per cent increase compared to the previous ten-year annual average.

The total number of homes available for sale in active status at the end of December was 104, a decrease of 45.3 per cent compared to December of last year, and 85.7 per cent below the previous ten-year average of 727 listings for December.

The number of months of inventory touched an all time low of 0.2 in December. Inventory has settled at under 1 month for fourteen consecutive months. The number of months of inventory represents how long it would take to sell off current inventories at the current rate of sales.

“Supply not keeping up with demand was a steady refrain in 2021, and unfortunately I expect that will continue to be the case in the year ahead,” says Bell. “We need all levels of government working together to bring more supply into the housing market.”

The average number of days to sell in December stayed at 10 days, compared to 16 days in December 2020 and a previous 5-year average of 28 days.

The average days to sell in 2021 was 10 days, compared to 16 days in 2020 and a previous 5-year average of 22 days.

Those requiring specific information on property values should contact a local REALTOR®.  Working with a Realtor is the best way to get a complete picture of the property and community you are considering.

View our HPI tool here to learn more: https://kwar.ca/hpi-dashboard

Historical Sales By Property Type


Months Supply of Homes for Sale


Historical Median Sales Price – By Property Type

Historical Average Sales Price – By Property Type

Average Days on Market

KWAR cautions that average sale price information can be useful in establishing long term trends but should not be used as an indicator that specific properties have increased or decreased in value. The average sale price is calculated based on the total dollar volume of all properties sold. Months Supply is the inventory of homes for sale at the end of a given month, divided by the average monthly closed sales from the last 12 months Those requiring specific information on property values should contact a local REALTOR®. REALTORS® have their fingers on the pulse of the market. They know the questions to ask, the areas to probe and what to look for so that you get a complete picture of the property and community you’re considering.


© Copyright 2017, Real Estate Websites by Redman Technologies Inc. | Privacy Policy | Disclaimer | Sitemap

MLS®, REALTOR®, and the associated logos are trademarks of The Canadian Real Estate Association.

The data included on this website is deemed to be reliable, but is not guaranteed to be accurate by the Kitchener-Waterloo Real Estate Board. The trademarks REALTOR®, REALTORS® and the REALTOR® logo are controlled by The Canadian Real Estate Association (CREA) and identify real estate professionals who are members of CREA. Used under license.