Kitchener Waterloo Market Snapshot June 2023
Waterloo Region Real Estate Market Shows Resilience With Increase in Home Sales and Average Prices
If you are considering to Sell your home or Buy a home in the next short while it would be highly beneficial for you to connect with one of our Team Agents at
The Riz Team
Do you want to know what your home is worth today? Click Below for our Online No Obligation Market Evaluation
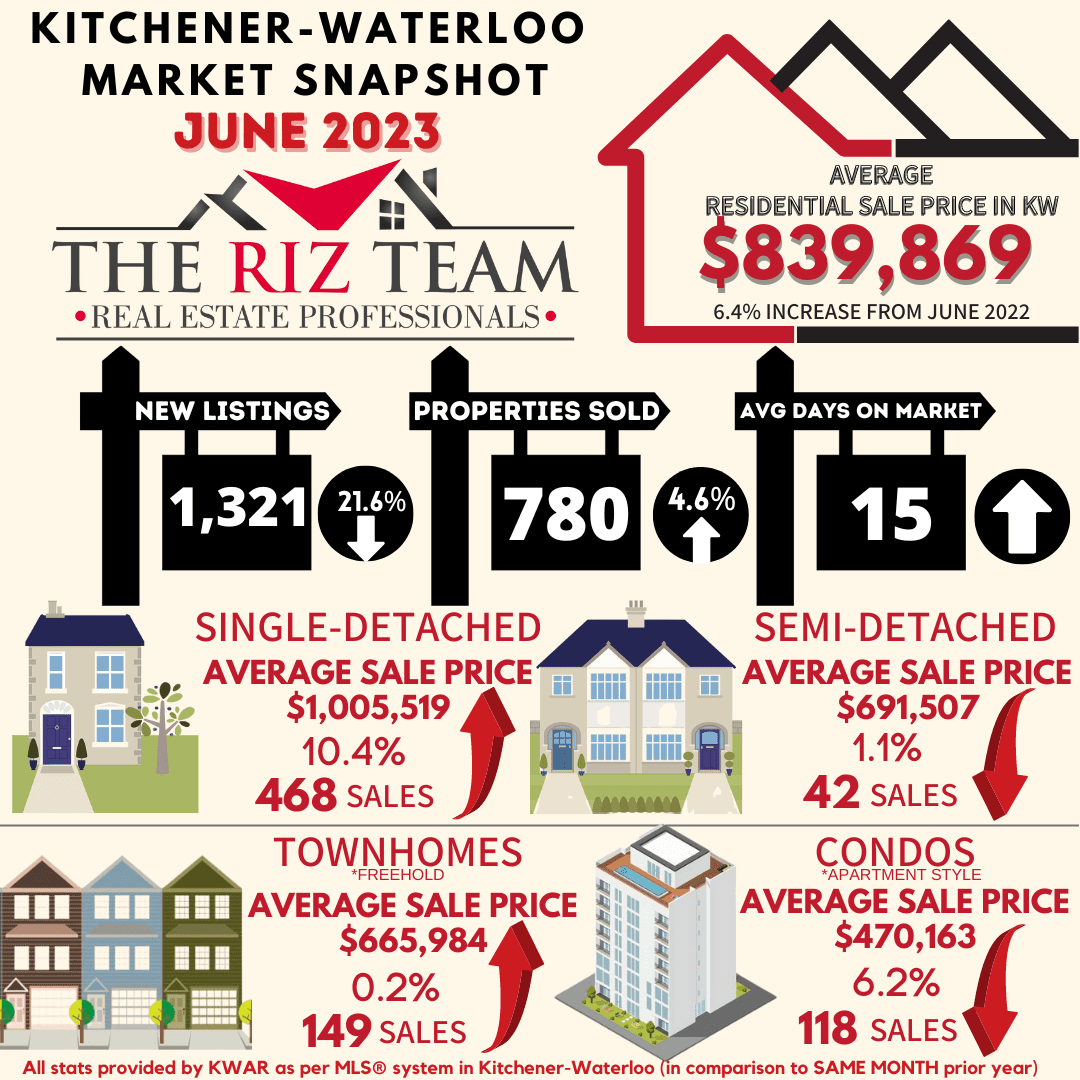
WATERLOO REGION, ON (July 6, 2023) — In June, there were 780 homes sold through the Multiple Listing Service® (MLS®) System of the Waterloo Region Association of REALTORS® (WRAR), representing an increase of 4.6 per cent compared to the previous year and a decline of 12.3 per cent compared to the previous 5-year average for the month.
“The real estate market in Waterloo Region showed signs of a rebound in June, with monthly sales increasing on a year-over-year basis for the first time this year,” says Megan Bell, president of WRAR. “The total number of home sales are down nearly 25 per cent for the first half of 2023 compared to last year but have been steadily climbing since January.”
Total residential sales in June included 468 detached (up 5.9 per cent from June 2022), and 149 townhouses (up 4.9 per cent). Sales also included 118 condominium units (up 22.9 per cent) and 42 semi-detached homes (down 32.3 per cent).
In June, the average sale price for all residential properties in Waterloo Region was $839,869. This represents a 6.4 per cent increase compared to June 2022 and a 2.0 per cent increase compared to May 2023.
- The average price of a detached home was $1,005,519. This represents a 10.4 per cent increase from June 2022 and an increase of 4.1 per cent compared to May 2023.
- The average sale price for a townhouse was $665,984. This represents a 0.2 per cent increase from June 2022 and a decrease of 4.4 per cent compared to May 2023.
- The average sale price for an apartment-style condominium was $470,163. This represents a decrease of 6.2 per cent from June 2022 and a decrease of 3.3 per cent compared to May 2023.
- The average sale price for a semi was $691,507. This represents a decrease of 1.1 per cent compared to June 2022 and a decrease of 5.0 per cent compared to May 2023.
WRAR cautions that average sale price information can be useful in establishing long-term trends but should not be used as an indicator that specific properties have increased or decreased in value. The MLS® Home Price Index (HPI) provides the best way to gauge price trends because averages are strongly distorted by changes in the mix of sales activity from one month to the next.

MLS® Home Price Index Benchmark Price |
||||||
| Kitchener-Waterloo | Cambridge | |||||
| Benchmark Type: | June 2023 | Monthly % Change | Yr./Yr. % Change | June 2023 | Monthly % Change | Yr./Yr. % Change |
| Composite | $777,800 | 0.1 | -2.0 | $778,600 | -1.6 | -3.4 |
| Detached | $889,400 | 0.2 | 0.7 | $815,300 | -1.9 | -1.0 |
| Townhouse | $645,200 | 1.7 | -5.9 | $660,100 | 1.2 | -14.7 |
| Apartment | $479,000 | -1.8 | -8.7 | $481,900 | 0.2 | -16.6 |

“In June we saw robust demand for detached properties, driving a significant 10.5 per cent increase in the average sale price of a detached home,” says Bell. “While the central bank raised its benchmark interest rate to 4.75 per cent near the beginning of the month, demand remains strong. Buyers and sellers can expect a competitive market as the number of homes for sale continues to be well below the long-term average,” says Bell.
There were 1,321 new listings added to the MLS® System in Waterloo Region last month, a decrease of 21.6 per cent compared to June of last year and a 3.5 per cent increase compared to the previous ten-year average for June.
The total number of homes available for sale in active status at the end of June was 1007, a decrease of 23.1 per cent compared to June of last year and 32.8 per cent below the previous ten-year average of 1499 listings for June.
The number of months of inventory is up 5.9 per cent compared to June of last year, but still historically low at 1.8 months. The number of months of inventory represents how long it would take to sell off current inventories at the current sales rate.
The average number of days to sell in June was 15, compared to 13 days in June 2022. The previous 5-year average is 17 days.
View our HPI tool here to learn more: https://wrar.ca/hpi/
Click on any of the graphs below for an interactive view.


WRAR cautions that average sale price information can help identify long-term trends but should not be to indicate that specific properties have increased or decreased in value. The average sale price is calculated based on the total dollar volume of all properties sold. Months Supply is the inventory of homes for sale at the end of a given month, divided by the average monthly closed sales from the last 12 months. Those requiring specific information on property values should contact a Waterloo Region REALTOR®. REALTORS® have their fingers on the pulse of the market. They know the questions to ask, the areas to probe and what to look for so that you get a complete picture of the property and community you’re considering.
Tags: buyers, for sale, Homes For Sale, Kitchener Buyers, kitchener real estate, kitchener-waterloo, Market Update, real estate market, sales representative, sellers, the riz team, waterloo for sale, Waterloo Homes, Waterloo Sellers
This entry was posted on Thursday, July 6th, 2023 at 11:38 am and is filed under Kitchener Buyers, Kitchener Sellers, Market Stats, Market Update, Real Estate News, Waterloo Buyers, Waterloo Sellers. You can follow any responses to this entry through the RSS 2.0 feed. Both comments and pings are currently closed.