The Riz Team Blog

Posts Tagged ‘Waterloo Homes’

Kitchener Waterloo Market Snapshot September 2023

Wednesday, October 4th, 2023

Surge of New Listings in September Against Low Number of Sales

This article will provide a comprehensive snapshot of the KW real estate market for September 2023.

“The number of homes sold last month was very close to last year’s decade-low for the month of September,” says Megan Bell, president of WRAR.  “At the same time, we had a record number of new listings for the month of September.” 

If you are considering to Sell your home or Buy a home in the next short while it would be highly beneficial for you to connect with one of our Team Agents at

The Riz Team

Do you want to know what your home is worth today? Click Below for our Online No Obligation Market EvaluationClick HereClick Here

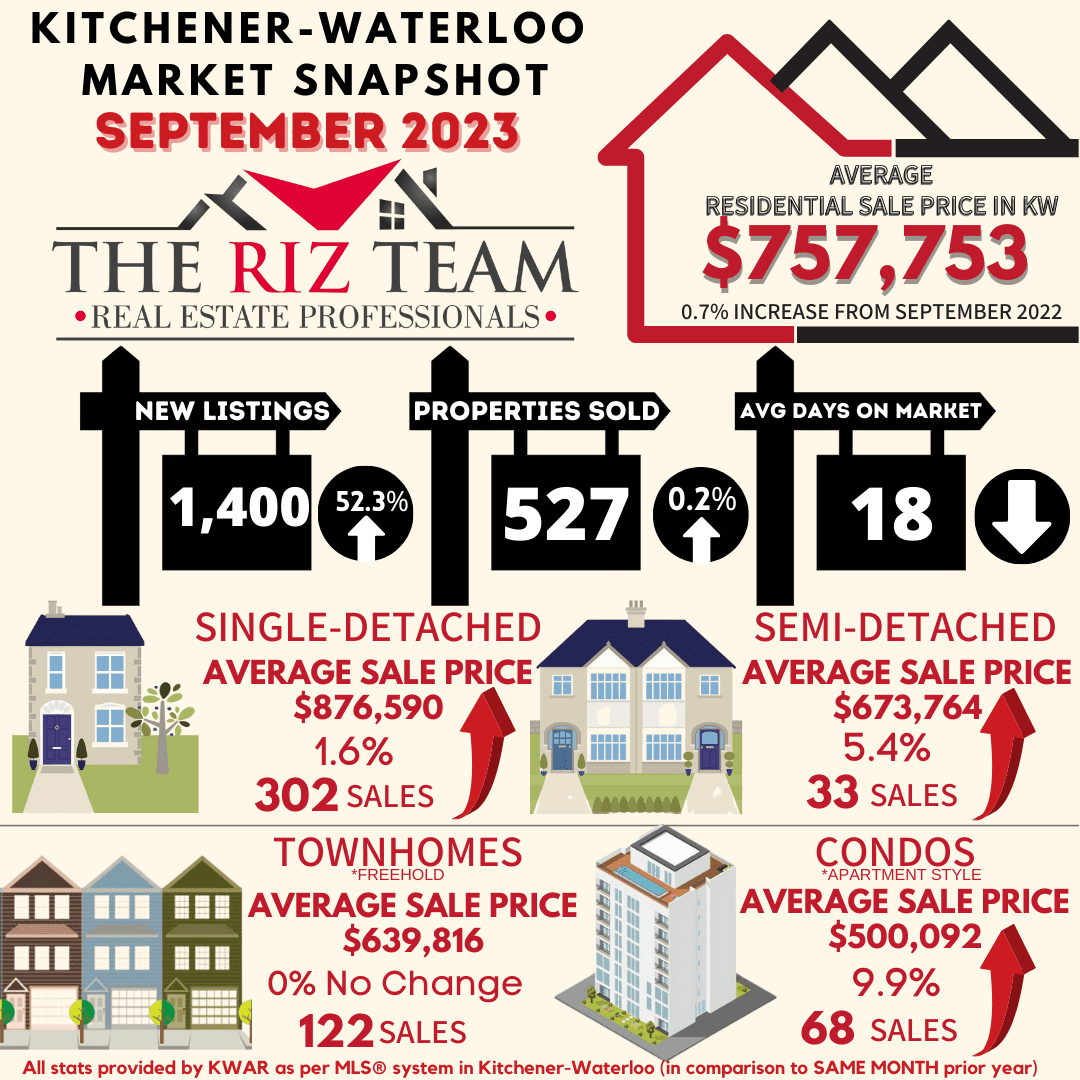
WATERLOO REGION, ON (October 4, 2023) — In September, there were 527 homes sold through the Multiple Listing Service® (MLS®) System of the Waterloo Region Association of REALTORS® (WRAR), representing an increase of 0.2 per cent compared to the previous year and a decline of 27.1 per cent compared to the previous 5-year average for the month.

“The number of homes sold last month was very close to last year’s decade-low for the month of September,” says Megan Bell, president of WRAR.  “At the same time, we had a record number of new listings for the month of September.”

Total residential sales in September included 302 detached (down 4.7 per cent from September 2022), and 122 townhouses (up 25.8 per cent). Sales also included 68 condominium units (up 9.7 per cent) and 33 semi-detached homes (down 34.0 per cent).

In September, the average sale price for all residential properties in Waterloo Region was $757,753. This represents a 0.7 per cent increase compared to September 2022 and a 0.3 per cent decrease compared to August 2023.

  • The average price of a detached home was $876,590. This represents a 1.6 per cent increase from September 2022 and a decrease of 0.5 per cent compared to August 2023.
  • The average sale price for a townhouse was $639,816. This represents no change from September 2022 and a decrease of 2.9 per cent compared to August 2023.
  • The average sale price for an apartment-style condominium was $500,092. This represents an increase of 9.9 per cent from September 2022 and an increase 3.1 per cent compared to August 2023.
  • The average sale price for a semi was $673,764. This represents an increase of 5.4 per cent compared to September 2022 and an increase 0.1 per cent compared to August 2023.

WRAR cautions that average sale price information can be useful in establishing long-term trends but should not be used as an indicator that specific properties have increased or decreased in value. The MLS® Home Price Index (HPI) provides the best way to gauge price trends because averages are strongly distorted by changes in the mix of sales activity from one month to the next.

092023_Average_Sales_Price-By_Property_Type

MLS® Home Price Index Benchmark Price

  Kitchener-Waterloo Cambridge
Benchmark Type: September 2023 Monthly % Change Yr./Yr. % Change September 2023 Monthly % Change Yr./Yr. % Change
Composite $734,600 -1.4 1.1 $741,300 -2.2 -0.6
Detached $832,900 -1.7 2.6 $766,100 -2.8 -0.2
Townhouse $630,300 -0.7 1.8 $677,700 1.2 -0.8
Apartment $475,300 0.0 -1.5 $501,500 0.1 -8.8


September 2023 HPI Image for Stats Release

“There was a significant surge of new listings in September, resulting in the largest number of homes being on the market since March 2016,” said Bell. “For buyers with the financing to be house hunting in September, they would have found more favourable conditions in terms of supply than we have seen in a while.”

At the same time, WRAR’s president points to the recent poll the association conducted, which shows over one-quarter of Waterloo Region residents are considering moving to a more affordable location.

“WRAR recently released a report highlighting that Waterloo region’s residents are struggling under the affordability crisis, with four in ten reporting that they live in housing that is unaffordable,” said Bell.

Local REALTORS® call for action to build more missing middle housing as nearly 4 in 10 (38%) residents report living in unaffordable homes.

There were 1,400 new listings added to the MLS® System in Waterloo Region last month, an increase of 52.3 per cent compared to September of last year and a 30.5 per cent increase compared to the previous ten-year average for September.

The total number of homes available for sale in active status at the end of September was 1,448, an increase of 48.8 per cent compared to September of last year and 9.5 per cent above the previous ten-year average of 1322 listings for September.

There were 2.6 months of inventory at the end of September, an 85.7 per cent increase compared to last year and 34.7 per cent above the previous 10-year average. The number of months of inventory represents how long it would take to sell off current inventories at the current sales rate.

The average number of days to sell in September was 18, compared to 23 days in September 2022. The previous 5-year average is 20 days.

With the next scheduled Bank of Canada interest rate announcement set for October 25, buyers might be on the sidelines, waiting to see what unfolds. WRAR understands that some buyers may be unsure about their next steps. That’s why we encourage these buyers to reach out to local Realtors who can provide them with valuable insights about the current state of the local market and cater to their specific needs.


View our HPI tool here to learn more: https://wrar.ca/hpi/

Click on any of the graphs below for an interactive view.

092023_Average_Sales_Price
092023_Average_Sales_Price_Township
092023_Average_Sales_Price-By_Property_Type
092023_Months_supply_of_homes_for_sale
092023_Median_sales_price-by_propety_type
092023_Average_Sales_Price-By_Property_Type2
092023_Average_days_on_market

WRAR cautions that average sale price information can help identify long-term trends but should not be to indicate that specific properties have increased or decreased in value. The average sale price is calculated based on the total dollar volume of all properties sold. Months Supply is the inventory of homes for sale at the end of a given month, divided by the average monthly closed sales from the last 12 months. Those requiring specific information on property values should contact a Waterloo Region REALTOR®. REALTORS® have their fingers on the pulse of the market. They know the questions to ask, the areas to probe and what to look for so that you get a complete picture of the property and community you’re considering.


Kitchener Waterloo Market Snapshot August 2023

Wednesday, September 6th, 2023

Soft Home Sales in August Coupled with Strong Listing Activity

If you are considering to Sell your home or Buy a home in the next short while it would be highly beneficial for you to connect with one of our Team Agents at

The Riz Team

Do you want to know what your home is worth today? Click Below for our Online No Obligation Market EvaluationClick Here

Click Here to Evaluate your home

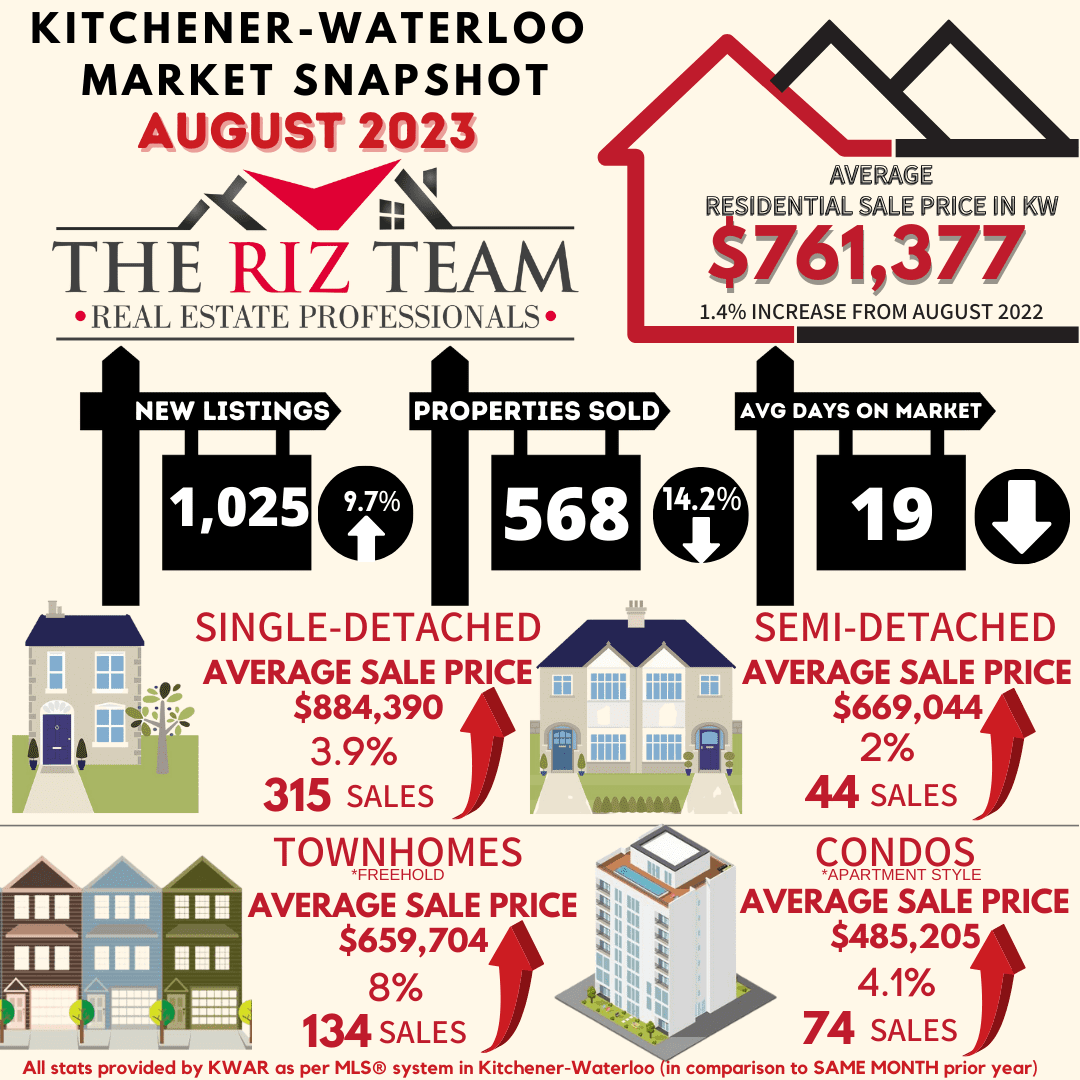
WATERLOO REGION, ON (September 6, 2023) — In August, there were 568 homes sold through the Multiple Listing Service® (MLS®) System of the Waterloo Region Association of REALTORS® (WRAR), representing a decrease of 14.2 per cent compared to the previous year and a decline of 23.5 per cent compared to the previous 5-year average for the month.

“For the first time in a decade we saw August’s home sales slip under the 600-unit mark,” says Megan Bell, president of WRAR.”  “Home sales were softer than normal last month, which is not surprising given the current borrowing environment.”

Total residential sales in August included 315 detached (down 24.1 per cent from August 2022), and 134 townhouses (up 12.6 per cent). Sales also included 74 condominium units (up 10.4 per cent) and 44 semi-detached homes (down 27.9 per cent).

In August, the average sale price for all residential properties in Waterloo Region was $761,377. This represents a 1.4 per cent increase compared to August 2022 and a 4.4 per cent decrease compared to July 2023.

  • The average price of a detached home was $884,390. This represents a 3.9 per cent increase from August 2022 and a decrease of 3.9 per cent compared to July 2023.
  • The average sale price for a townhouse was $659,704. This represents a 8.0 per cent increase from August 2022 and a decrease of 1.7 per cent compared to July 2023.
  • The average sale price for an apartment-style condominium was $485,205. This represents an increase of 4.1 per cent from August 2022 and a decrease of 2.3 per cent compared to July 2023.
  • The average sale price for a semi was $669,044. This represents an increase of 2.0 per cent compared to August 2022 and a decrease of 0.3 per cent compared to July 2023.

WRAR cautions that average sale price information can be useful in establishing long-term trends but should not be used as an indicator that specific properties have increased or decreased in value. The MLS® Home Price Index (HPI) provides the best way to gauge price trends because averages are strongly distorted by changes in the mix of sales activity from one month to the next.

August Average Sales Price - By Property Type 09062023

MLS® Home Price Index Benchmark Price

  Kitchener-Waterloo Cambridge
Benchmark Type: August 2023 Monthly % Change Yr./Yr. % Change August 2023 Monthly % Change Yr./Yr. % Change
Composite $745,100 -2.6 1.1 $758,000 -0.9 1.4
Detached $846,900 -2.5 3.3 $788,100 -1.1 3.3
Townhouse $634,900 -2.1 1.4 $669,300 0.9 -5.5
Apartment $475,400 -2.0 -5.2 $501,000 1.7 -12.4
HPI August 2023

“Home buyers had the advantage of strong listing activity in August, which helped to provide a little more choice and temper prices,” says Bell. “But affordability remains a top concern for many who are looking to get into the market and finding it a challenge to resolve what they want with what they can afford.”

WRAR’s president points out that while market-wide, inventory levels were up 7.6 per cent in August, this was mainly due to the Townhouse/Condo segment, where inventory increased by 35.3 per cent. The property type with the most supply in the market is the condo segment with 3.3 months supply, compared to 1.8 months supply in the detached home category.

“Right now, buyers may find it easier to get into a condominium, which can be a great choice for both first time buyers, and anyone looking for a lifestyle change.”

There were 1,025 new listings added to the MLS® System in Waterloo Region last month, an increase of 9.7 per cent compared to August of last year and a 11.7 per cent increase compared to the previous ten-year average for August.

The total number of homes available for sale in active status at the end of August was 1,094, an increase of 7.6 per cent compared to August of last year and 14.9 per cent below the previous ten-year average of 1431 listings for August.

There were 2.0 months of inventory at the end of August, unchanged from the end of July and in line with the previous 10-year average. The number of months of inventory represents how long it would take to sell off current inventories at the current sales rate.

The average number of days to sell in August was 19, compared to 23 days in August 2022. The previous 5-year average is 21 days.

View our HPI tool here to learn more: https://wrar.ca/hpi/

Click on any of the graphs below for an interactive view.

August Average Sales Price
August Average Sales Price - Township 09062023
Sales By Property Type 09062023
Supply of Homes 09062023
Median Sales - By Property type 09062023
Average Sales Price - By Property Type 09062023
Average Days on Market 09062023

Kitchener Waterloo Market Snapshot July 2023

Thursday, August 3rd, 2023

Strong Listing Activity in July

If you are considering to Sell your home or Buy a home in the next short while it would be highly beneficial for you to connect with one of our Team Agents at

The Riz Team

Do you want to know what your home is worth today? Click Below for our Online No Obligation Market EvaluationClick Here

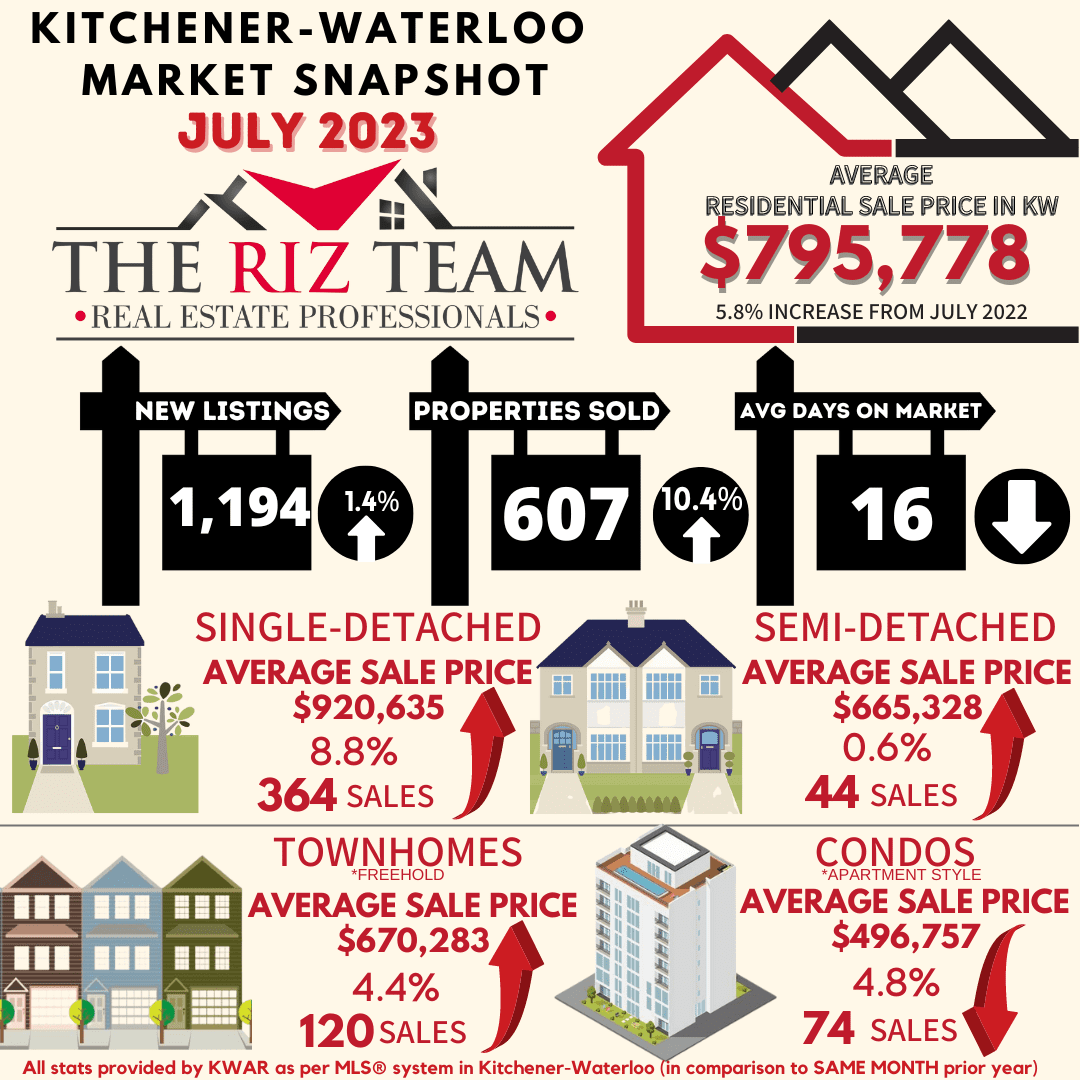
WATERLOO REGION, ON (August 3, 2023) — In July, there were 607 homes sold through the Multiple Listing Service® (MLS®) System of the Waterloo Region Association of REALTORS® (WRAR), representing an increase of 10.4 per cent compared to the previous year and a decline of 21.6 per cent compared to the previous 5-year average for the month.

“The Waterloo Region residential real estate market experienced some growth in terms of unit sales and supply in July, with home prices showing moderate fluctuations,” says Bell. “Despite the Bank of Canada’s most recent interest rate hike, we saw more sellers coming off the sidelines with new listing activity reaching its second highest level for the month of July in over a decade.”

Total residential sales in July included 364 detached (up 8.3 per cent from July 2022), and 120 townhouses (up 7.1 per cent). Sales also included 74 condominium units (up 15.6 per cent) and 44 semi-detached homes (up 22.2 per cent).

In July, the average sale price for all residential properties in Waterloo Region was $795,778. This represents a 5.8 per cent increase compared to July 2022 and a 5.2 per cent decrease compared to June 2023.

  • The average price of a detached home was $920,635. This represents an 8.8 per cent increase from July 2022 and a decrease of 8.4 per cent compared to June 2023.
  • The average sale price for a townhouse was $670,283. This represents a 4.4 per cent increase from July 2022 and an increase of 0.5 per cent compared to June 2023.
  • The average sale price for an apartment-style condominium was $496,757. This represents a decrease of 4.8 per cent from July 2022 and an increase of 5.6 per cent compared to June 2023.
  • The average sale price for a semi was $665,328. This represents an increase of 0.6 per cent compared to July 2022 and a decrease of 3.8 per cent compared to June 2023.

WRAR cautions that average sale price information can be useful in establishing long-term trends but should not be used as an indicator that specific properties have increased or decreased in value. The MLS® Home Price Index (HPI) provides the best way to gauge price trends because averages are strongly distorted by changes in the mix of sales activity from one month to the next.

July Average Sales Price by Property Type

MLS® Home Price Index Benchmark Price

Kitchener-Waterloo Cambridge
Benchmark Type: July 2023 Monthly % Change Yr./Yr. % Change July 2023 Monthly % Change Yr./Yr. % Change
Composite $765,000 -1.7 1.8 $764,600 -1.8 -1.2
Detached $869,000 -2.3 4.4 $797,100 -2.2 1.2
Townhouse $648,700 0.6 -0.3 $663,200 0.5 -11.9
Apartment $484,900 1.2 -5.5 $492,600 2.2 -14.8


July 2023 HPI Image for Stats Release

“In this ever-evolving market, demand persists despite the changing landscape. Increased listing activity is certainly welcomed to help offset the lack of supply and pent-up demand,” says Bell. “Working with a local REALTOR® is vital in navigating these shifting influences during the homebuying and selling process. Waterloo Region properties remain highly sought-after due to our diverse economy and desirable community, solidifying us in a competitive market.”

There were 1,194 new listings added to the MLS® System in Waterloo Region last month, an increase of 1.4 per cent compared to July of last year and a 10.8 per cent increase compared to the previous ten-year average for July.

The total number of homes available for sale in active status at the end of July was 1,107, a decrease of 14.8 per cent compared to July of last year and 22.6 per cent below the previous ten-year average of 1431 listings for July.

There were 2.0 months of inventory at the end of July, up slightly from the end of June and in line with the previous 10-year average. The number of months of inventory represents how long it would take to sell off current inventories at the current sales rate.

The average number of days to sell in July was 16, compared to 18 days in July 2022. The previous 5-year average is 18 days.

View our HPI tool here to learn more: https://wrar.ca/hpi/

Click on any of the graphs below for an interactive view.

average sales price by municipality
average sales price by township
monthly sales by property type
monthly supply of homes for sale
monthly median sales price by property type
monthly average sales price by property type
monthly average days on market

WRAR cautions that average sale price information can help identify long-term trends but should not be to indicate that specific properties have increased or decreased in value. The average sale price is calculated based on the total dollar volume of all properties sold. Months Supply is the inventory of homes for sale at the end of a given month, divided by the average monthly closed sales from the last 12 months. Those requiring specific information on property values should contact a Waterloo Region REALTOR®. REALTORS® have their fingers on the pulse of the market. They know the questions to ask, the areas to probe and what to look for so that you get a complete picture of the property and community you’re considering.


Kitchener Waterloo Market Snapshot June 2023

Thursday, July 6th, 2023

Waterloo Region Real Estate Market Shows Resilience With Increase in Home Sales and Average Prices

If you are considering to Sell your home or Buy a home in the next short while it would be highly beneficial for you to connect with one of our Team Agents at

The Riz Team

Do you want to know what your home is worth today? Click Below for our Online No Obligation Market EvaluationClick Here

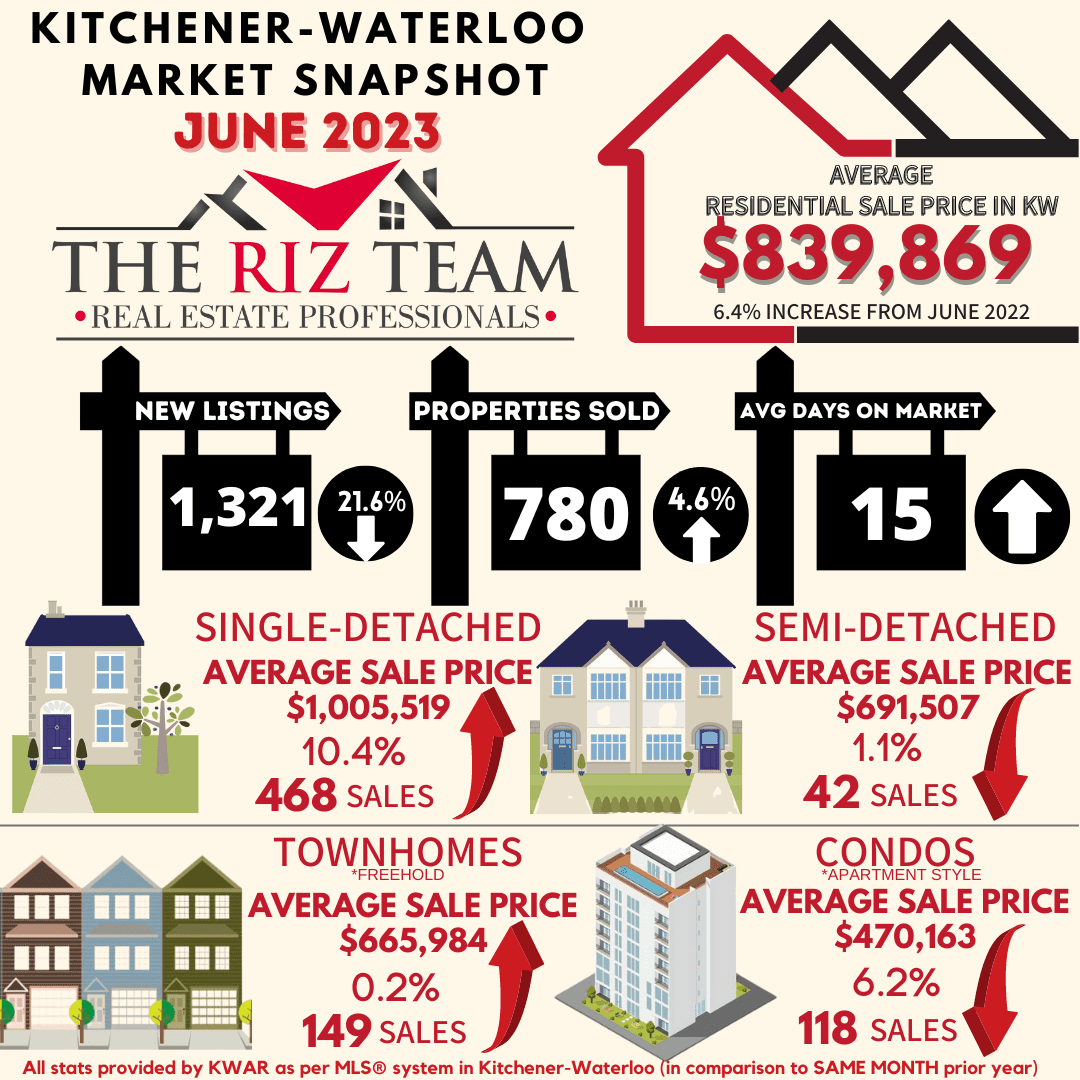
WATERLOO REGION, ON (July 6, 2023) — In June, there were 780 homes sold through the Multiple Listing Service® (MLS®) System of the Waterloo Region Association of REALTORS® (WRAR), representing an increase of 4.6 per cent compared to the previous year and a decline of 12.3 per cent compared to the previous 5-year average for the month.

“The real estate market in Waterloo Region showed signs of a rebound in June, with monthly sales increasing on a year-over-year basis for the first time this year,” says Megan Bell, president of WRAR. “The total number of home sales are down nearly 25 per cent for the first half of 2023 compared to last year but have been steadily climbing since January.”

Total residential sales in June included 468 detached (up 5.9 per cent from June 2022), and 149 townhouses (up 4.9 per cent). Sales also included 118 condominium units (up 22.9 per cent) and 42 semi-detached homes (down 32.3 per cent).

In June, the average sale price for all residential properties in Waterloo Region was $839,869. This represents a 6.4 per cent increase compared to June 2022 and a 2.0 per cent increase compared to May 2023.

  • The average price of a detached home was $1,005,519. This represents a 10.4 per cent increase from June 2022 and an increase of 4.1 per cent compared to May 2023.
  • The average sale price for a townhouse was $665,984. This represents a 0.2 per cent increase from June 2022 and a decrease of 4.4 per cent compared to May 2023.
  • The average sale price for an apartment-style condominium was $470,163. This represents a decrease of 6.2 per cent from June 2022 and a decrease of 3.3 per cent compared to May 2023.
  • The average sale price for a semi was $691,507. This represents a decrease of 1.1 per cent compared to June 2022 and a decrease of 5.0 per cent compared to May 2023.

WRAR cautions that average sale price information can be useful in establishing long-term trends but should not be used as an indicator that specific properties have increased or decreased in value. The MLS® Home Price Index (HPI) provides the best way to gauge price trends because averages are strongly distorted by changes in the mix of sales activity from one month to the next.

June average sales price by property type

MLS® Home Price Index Benchmark Price

  Kitchener-Waterloo Cambridge
Benchmark Type: June 2023 Monthly % Change Yr./Yr. % Change June 2023 Monthly % Change Yr./Yr. % Change
Composite $777,800 0.1 -2.0 $778,600 -1.6 -3.4
Detached $889,400 0.2 0.7 $815,300 -1.9 -1.0
Townhouse $645,200 1.7 -5.9 $660,100 1.2 -14.7
Apartment $479,000 -1.8 -8.7 $481,900 0.2 -16.6


June 2023 HPI Graph

“In June we saw robust demand for detached properties, driving a significant 10.5 per cent increase in the average sale price of a detached home,” says Bell. “While the central bank raised its benchmark interest rate to 4.75 per cent near the beginning of the month, demand remains strong. Buyers and sellers can expect a competitive market as the number of homes for sale continues to be well below the long-term average,” says Bell.

There were 1,321 new listings added to the MLS® System in Waterloo Region last month, a decrease of 21.6 per cent compared to June of last year and a 3.5 per cent increase compared to the previous ten-year average for June.

The total number of homes available for sale in active status at the end of June was 1007, a decrease of 23.1 per cent compared to June of last year and 32.8 per cent below the previous ten-year average of 1499 listings for June.

The number of months of inventory is up 5.9 per cent compared to June of last year, but still historically low at 1.8 months. The number of months of inventory represents how long it would take to sell off current inventories at the current sales rate.

The average number of days to sell in June was 15, compared to 13 days in June 2022. The previous 5-year average is 17 days.

View our HPI tool here to learn more: https://wrar.ca/hpi/

Click on any of the graphs below for an interactive view.

Average Sales Price By Municipality
Average sales price by township
Monthly sales by property type
Monthly supply of homes for sale
Monthly median sales price by property type
Monthly average sales price by property type
Monthly average days on market

WRAR cautions that average sale price information can help identify long-term trends but should not be to indicate that specific properties have increased or decreased in value. The average sale price is calculated based on the total dollar volume of all properties sold. Months Supply is the inventory of homes for sale at the end of a given month, divided by the average monthly closed sales from the last 12 months. Those requiring specific information on property values should contact a Waterloo Region REALTOR®. REALTORS® have their fingers on the pulse of the market. They know the questions to ask, the areas to probe and what to look for so that you get a complete picture of the property and community you’re considering.


Kitchener Waterloo Market Snapshot May 2023

Friday, June 2nd, 2023

Waterloo Region Buyer and Listing Activity Ramps Up In May

If you are considering to Sell your home or Buy a home in the next short while it would be highly beneficial for you to connect with one of our Team Agents at

The Riz Team

Do you want to know what your home is worth today? Click Below for our Online No Obligation Market EvaluationClick HereClick here to see what your home is worth in today's market!!!

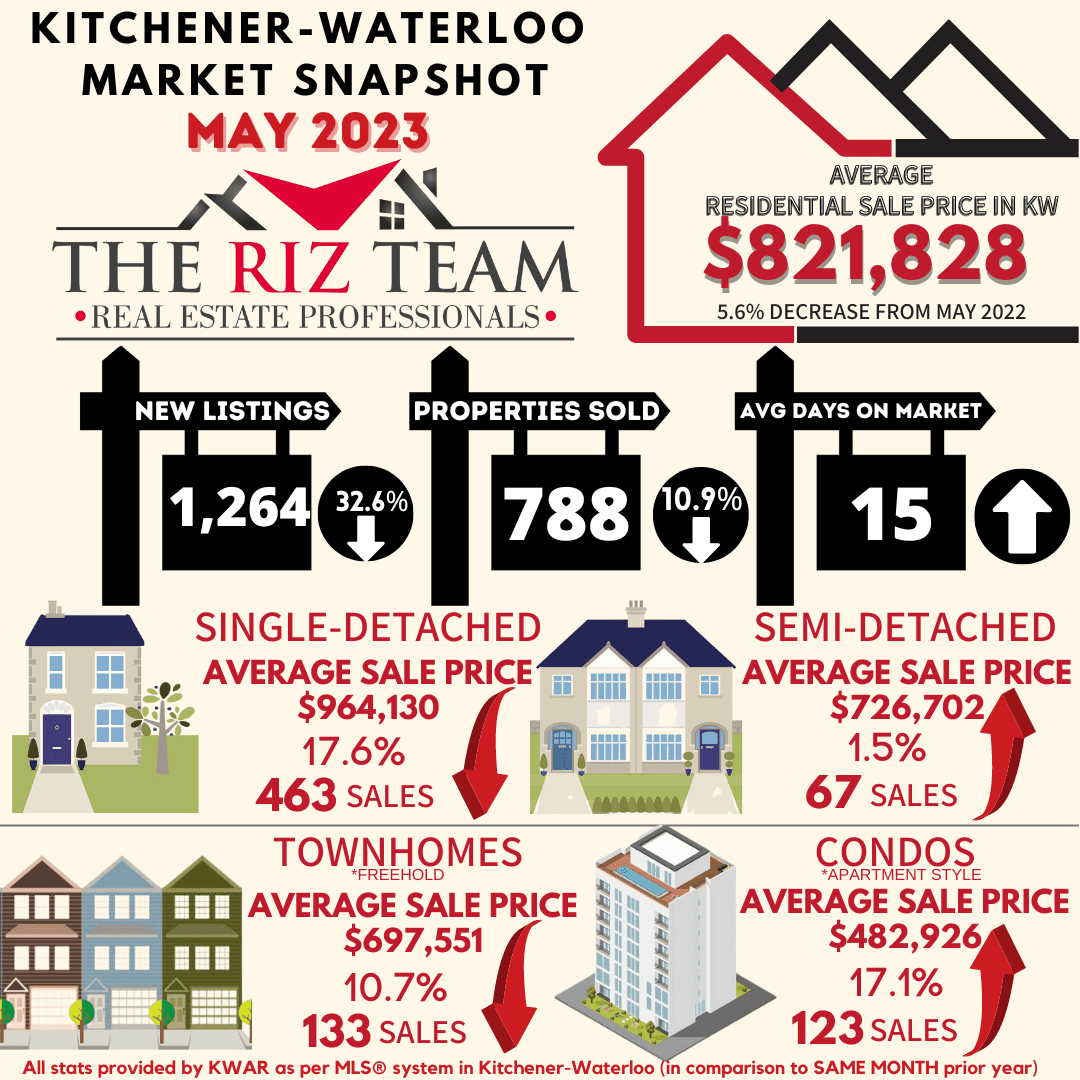
WATERLOO REGION, ON (June 2, 2023) — In May there were 788 homes sold through the Multiple Listing Service® (MLS®) System of the Waterloo Region Association of REALTORS® (WRAR), representing a decrease of 10.9 per cent compared to the previous year and a decline of 12.6 per cent compared to the previous 5-year average for the month.

“The spring market is in full swing with robust buyer and listing activity observed in May,” says Megan Bell, president of WRAR. “It’s encouraging to witness a significant uptick in listing activity compared to April, and we remain optimistic that this positive momentum will carry into June. However, it’s worth noting that the number of listings being added to the MLS® System continues to be historically low.”

Total residential sales in May included 463 detached (down 17.6 per cent from May 2022), and 133 townhouses (down 10.7 percent). Sales also included 123 condominium units (up 17.1 per cent) and 67 semi-detached homes (up 1.5 per cent).

In May, the average sale price for all residential properties in Waterloo Region was $821,828 This represents a 5.6  per cent decrease compared to May 2022 and a 3.1 per cent increase compared to April 2023.

  • The average price of a detached home was $964,130. This represents a 2.8 per cent decrease from May 2022 and an increase of 4.2 per cent compared to April 2023.
  • The average sale price for a townhouse was $697,551. This represents a 2.4 per cent decrease from May 2022 and an increase of 5.0 per cent compared to April 2023.
  • The average sale price for an apartment-style condominium was $482,926. This represents a decrease of 11.8 per cent from May 2022 and a decrease of 1.4 per cent compared to April 2023.
  • The average sale price for a semi was $726,702. This represents an increase of 1.1 per cent compared to May 2022 and an increase of 5.8 per cent compared to April 2023.

WRAR cautions that average sale price information can be useful in establishing long-term trends but should not be used as an indicator that specific properties have increased or decreased in value. The MLS® Home Price Index (HPI) provides the best way to gauge price trends because averages are strongly distorted by changes in the mix of sales activity from one month to the next.

may average sales price by property type

MLS® Home Price Index Benchmark Price

Kitchener-Waterloo Cambridge
Benchmark Type: May 2023 Monthly % Change Yr./Yr. % Change May 2023 Monthly % Change Yr./Yr. % Change
Composite $777,500 2.4 -7.7 $791,000 4.2 -5.5
Detached $887,800 2.5 -5.4 $831,100 4.7 -3.1
Townhouse $634,300 2.7 -13.9 $652,200 1.6 -17.5
Apartment $487,600 2.3 -8.9 $480,700 0.1 -17.8


May 2023 HPI Image for Stats Release

“Waterloo Region properties remain in high demand, driven by our diverse economy and the desirability of our community, we continue to be in a seller’s market,” says Bell. “With limited inventory and a relatively low number of new listings being added to the MLS® system, buyers face intensified competition while sellers receive increasingly competitive offers.”

There were 1,264 new listings added to the MLS® System in Waterloo Region last month, a decrease of 32.6 per cent compared to May of last year and an 11.8 per cent decrease compared to the previous ten-year average for May.

The total number of homes available for sale in active status at the end of May was 900, a decrease of 24.9 per cent compared to May of last year and 41.0 per cent below the previous ten-year average of 1524 listings for May.

The number of months of inventory is up 13.3 per cent compared to May of last year, but still historically low at 1.7 months. The number of months of inventory represents how long it would take to sell off current inventories at the current sales rate.

The average number of days to sell in May was 15, compared to 11 days in May 2022. The previous 5-year average is 16 days.

View our HPI tool here to learn more: https://wrar.ca/hpi/

Click on any of the graphs below for an interactive view.

Average Sales price by municipality
average sales price by township
monthly sales by property type
monthly supply of homes for sale
monthly median sales price by property type
monthly average sales price by property type
monthly average days on market


Kitchener Waterloo Market Snapshot March 2023

Wednesday, April 5th, 2023

Home Prices Inch Up in March as We Enter the Spring Market

If you are considering to Sell your home or Buy a home in the next short while it would be highly beneficial for you to connect with one of our Team Agents at

The Riz Team

Do you want to know what your home is worth today? Click Below for our Online No Obligation Market EvaluationClick Here
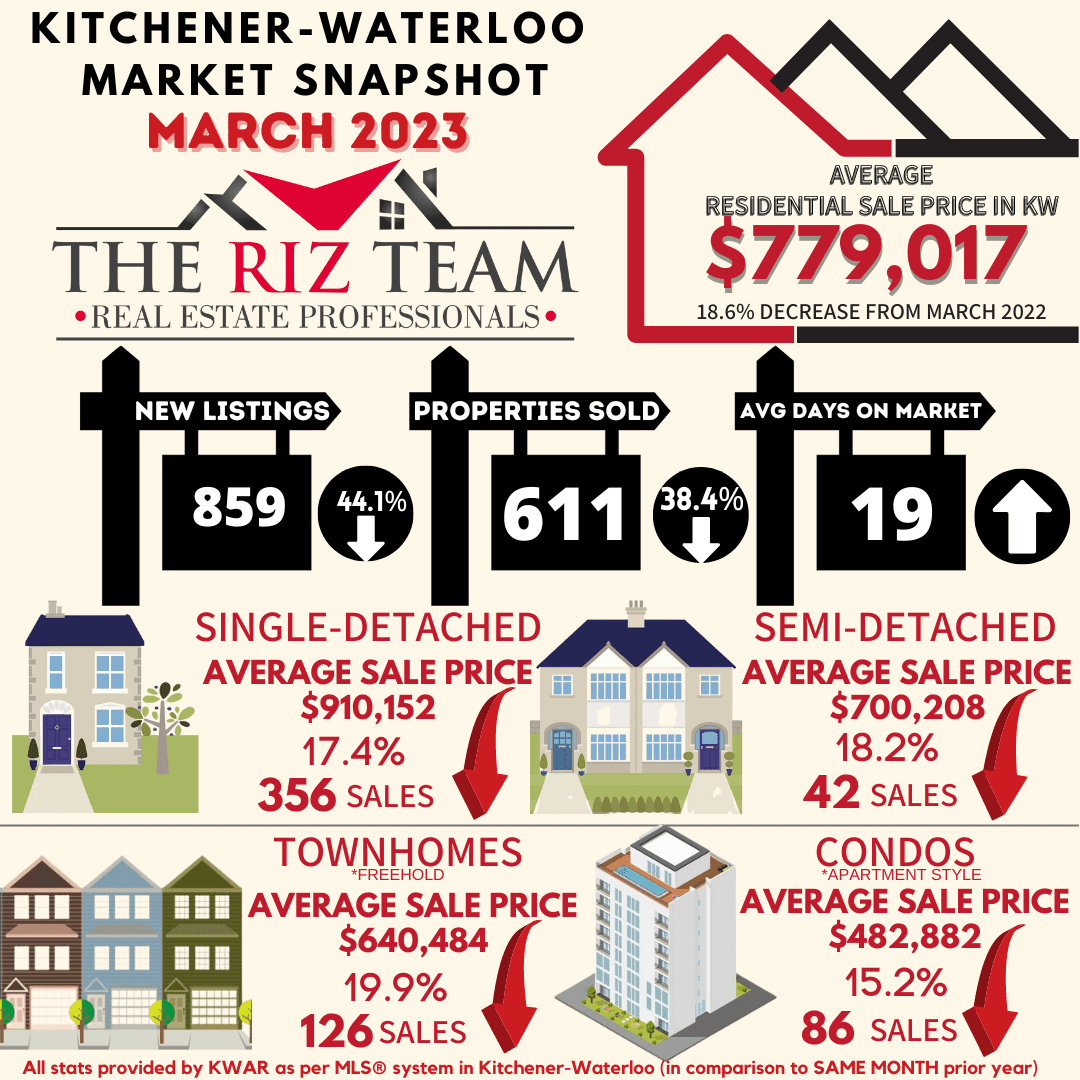
WATERLOO REGION, ON (April 5, 2023) — Sales volume through the Multiple Listing Service® (MLS®) System of the Waterloo Region Association of REALTORS® (WRAR) set another low last month, with 611 homes sold in March, representing a decrease of 38.4 per cent compared to March 2022 and 33.6 per cent below the previous 5-year average for the month.

“Sales activity was well below average in March, and while the number of homes sold is down, sale prices have increased modestly month over month,” says Megan Bell, president of WRAR. “With borrowing costs stabilizing and lenders promoting more appealing rates, I think we will see more buyers coming off the sidelines this spring, adding demand to our already popular Waterloo Region and pushing home prices up slightly.”

Total residential sales in March included 356 detached (down 39.9 per cent from March 2022), and 126 townhouses (down 29.6 per cent). Sales also included 86 condominium units (down 32.8 per cent) and 42 semi-detached homes (down 53.3 per cent).

In March, the average sale price for all residential properties in Waterloo Region was $779,017. This represents a 18.6 per cent decrease compared to March 2022 and a 2.4 per cent increase compared to February 2023.

  • The average price of a detached home was $910,152. This represents a 17.4 per cent decrease from March 2022 and an increase of 2.9 per cent compared to February 2023.
  • The average sale price for a townhouse was $640,484. This represents a 19.9 per cent decrease from March 2022 and a decrease of 6 per cent compared to February 2023.
  • The average sale price for an apartment-style condominium was $482,882. This represents a decrease of 15.2 per cent from March 2022 and an increase of 5.3 per cent compared to February 2023.
  • The average sale price for a semi was $700,208. This represents a decrease of 18.2 per cent compared to March 2022 and an increase of 4.9 per cent compared to February 2023.

WRAR cautions that average sale price information can be useful in establishing long-term trends but should not be used as an indicator that specific properties have increased or decreased in value. The MLS® Home Price Index (HPI) provides the best way to gauge price trends because averages are strongly distorted by changes in the mix of sales activity from one month to the next.

March average sales price by property type

MLS® Home Price Index Benchmark Price

Kitchener-Waterloo Cambridge
Benchmark Type: March 2023 Monthly % Change Yr./Yr. % Change March 2023 Monthly % Change Yr./Yr. % Change
Composite $739,400 1.8 -21.2 $746,300 0.5 -20.6
Detached $839,500 2.0 -20.4 $776,100 0.7 -21.1
Townhouse $600,500 2.0 -23.5 $641,700 0.7 -17.5
Apartment $474,000 0.1 -18.0 $483,000 -1.9 -13.5


“This is a peculiar market. While we certainly will not have the same volume of sales as in 2022, demand remains strong. For those that were previously hesitant to sell their properties, March’s slight uptick in sales prices is a good indication of the continued pent-up demand within the Region and we do not anticipate this slowing down anytime soon,” says Bell. “These and other shifting influences mean it has never been more important for buyers and sellers alike to work with a local REALTOR® to help provide expertise during the homebuying and selling process.”

While on a year-over-year basis, prices have come down close to 20 per cent, they are up compared to two years ago.

There were 859 new listings added to the MLS® System in Waterloo Region last month, a decrease of 44.1 per cent compared to March of last year and a 30.5 per cent decrease compared to the previous ten-year average for March.

The total number of homes available for sale in active status at the end of March was 716, an increase of 17.2 per cent compared to March of last year and 42.4 per cent below the previous ten-year average of 1243 listings for March.

The number of months of inventory is up 85.7 per cent compared to March of last year, but still historically low at 1.3 months. The number of months of inventory represents how long it would take to sell off current inventories at the current sales rate.

The average number of days to sell in March was 19, compared to 8 days in March 2022. The previous 5-year average is 15 days.

View our HPI tool here to learn more: https://wrar.ca/hpi/

Click on any of the graphs below for an interactive view.

Avg Sales Price Municipalities
Avg Sales Price Townships
Monthly Sales Price Property Type
Monthly Supply Homes for Sale
Monthly median sales price property type
monthly average sales price by property type
monthly average days on market

Kitchener-Waterloo Market Snapshot December 2021

Wednesday, January 5th, 2022

Average Price of a Detached Home Reaches Million-dollar Milestone in December

HOME SALES IN 2021 SMASHED LAST YEAR’S RECORD-BREAKING TOTAL BY OVER 1000 UNITS

The 7,581 residential homes sold through the Multiple Listing System (MLS® System) of the Kitchener-Waterloo Association of REALTORS® (KWAR) in 2021 represent an increase of 18.3 per cent compared to last year’s record-setting number of sales that ended the year 2020.

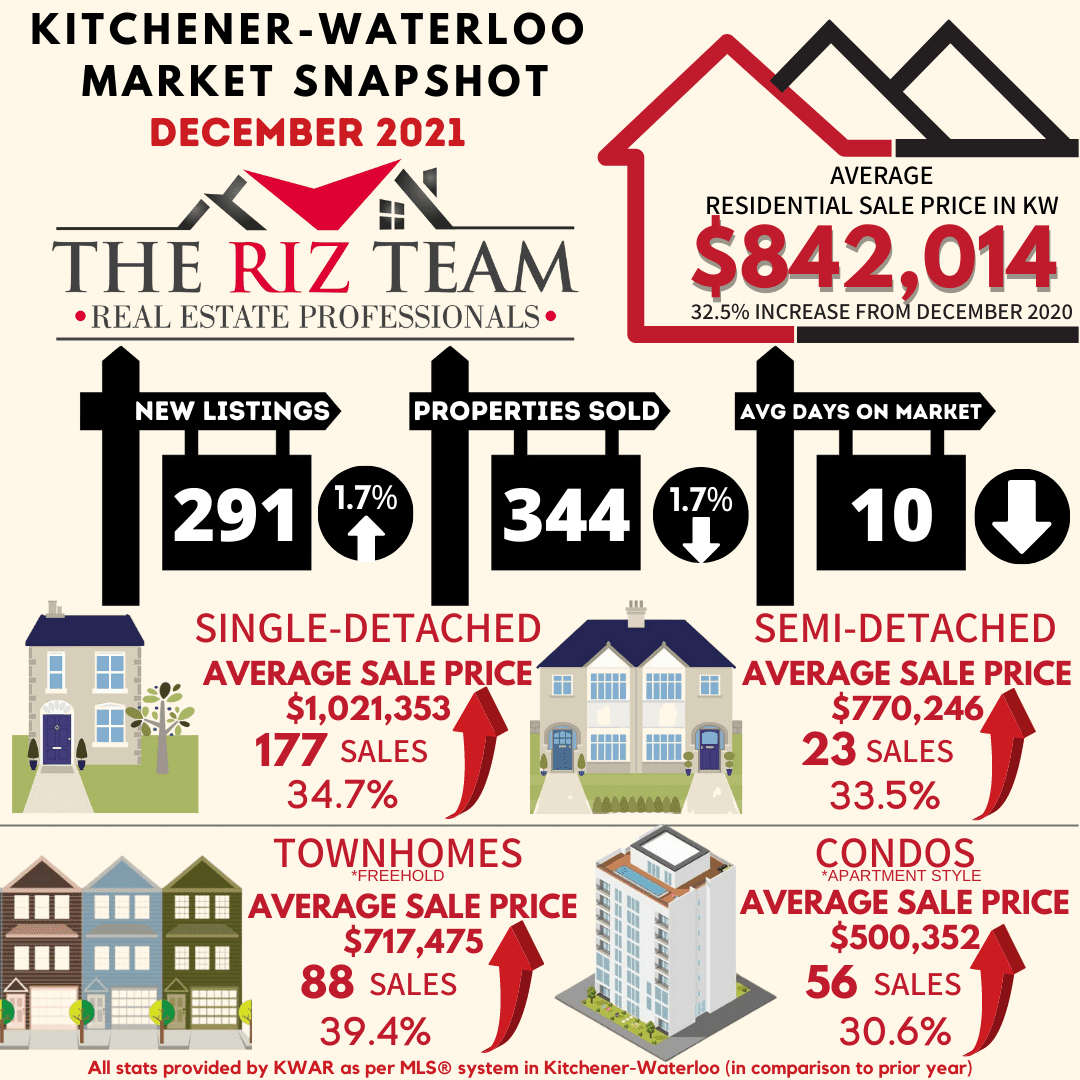
On a monthly basis, there were 344 residential homes sold last month, a decrease of 1.7 percent compared to the same month last year.

“Home sales in 2021 have absolutely smashed last year’s record by more than 1,000 units,” says KWAR’s president, Megan Bell. “While this is a good time to sell your home, it remains a tremendously difficult market for buyers. Affordability for all types of housing within our community continues to be a concern which we expect to continue throughout 2022.”

Total residential sales in December included 177 detached (down 12.4 per cent from December 2020), and 56 condominium units (down 11.1 per cent). Sales also included 23 semi-detached homes (up 9.5 per cent) and 88 townhouses (up 37.5 per cent).

For 2021, total residential sales included 4,272 detached (up 10.8 per cent), and 1,127 condominium units (up 43.4 per cent). Sales also included 578 semi-detached homes (up 31.1 per cent) and 1,602 townhouses (up 20.9 per cent).

In December, the average sale price for all residential properties in the Kitchener-Waterloo area was $842,014. This represents a 32.5 per cent increase over December 2020 and a 2.5 per cent increase compared to November 2021.

  • The average price of a detached home was $1,021,353. This represents a 34.7 per cent increase from December 2020 and an increase of 3.4 per cent compared to November 2021.
  • The average sale price for an apartment-style condominium was $500,352. This represents an increase of 30.6 per cent from December 2020 and an increase of 1.0 per cent compared to November 2021.
  • The average sale price for a townhouse was $717,475. This represents a 39.4 per cent increase from December 2020 and an increase of 2.1 per cent compared to November 2021.
  • The average sale price for a semi was $770,246. This represents an increase of 33.5 per cent compared to December 2020 and an increase 7.3 per cent compared to November 2021.

On a year-to-date basis, the average sale price for all residential properties in the Kitchener-Waterloo area increased 25.8 per cent to $770,596 compared to 2020.

  • The year-to-date average price of a detached home was $920,726. This represents a 28.0 per cent increase compared to 2020.
  • The year-to-date average sale price for an apartment-style condominium was $448,208. This represents an increase of 17.3 compared to 2020
  • The year-to-date average sale price for a townhouse was $632,875. This represents an increase of 34.9 per cent compared to 2020.
  • The year-to-date average sale price for a semi was $673,543. This represents an increase of 29.4 per cent compared to 2020.

KWAR cautions that average sale price information can be useful in establishing long-term trends but should not be used as an indicator that specific properties have increased or decreased in value. The MLS® Home Price Index (HPI) provides the best way to gauge price trends because averages are strongly distorted by changes in the mix of sales activity from one month to the next.

The MLS® HPI composite benchmark price for all residential properties in Kitchener-Waterloo was $851,700 in December. This represents a 32.1 per cent increase over December 2020 and a 3.2 per cent increase compared to November 2021.

  • The benchmark price for a detached home was $945,600. This represents a 33.5 per cent increase from December 2020 and 3.3 per cent increase compared to November 2021.
  • The benchmark price for an apartment-style condominium was $412,700. This represents a 21.1 per cent increase from December 2020 and a 3.7 per cent increase compared to November 2021.
  • The benchmark price for a townhouse is $647,000. This represents a 40.0 per cent increase from December 2020 and a 3.0 per cent increase compared to November 2021.

There were 291 new listings added to the MLS® System in KW and area last month, an increase of 1.7 per cent compared to December of last year, and a 14.6 per cent increase compared to the previous ten-year average for December.

On a year-to-date basis, there were 9,040 new listings added to the MLS® System in KW and area in 2021, an increase of 11.5 per cent compared to 2020, and a 3.8 per cent increase compared to the previous ten-year annual average.

The total number of homes available for sale in active status at the end of December was 104, a decrease of 45.3 per cent compared to December of last year, and 85.7 per cent below the previous ten-year average of 727 listings for December.

The number of months of inventory touched an all time low of 0.2 in December. Inventory has settled at under 1 month for fourteen consecutive months. The number of months of inventory represents how long it would take to sell off current inventories at the current rate of sales.

“Supply not keeping up with demand was a steady refrain in 2021, and unfortunately I expect that will continue to be the case in the year ahead,” says Bell. “We need all levels of government working together to bring more supply into the housing market.”

The average number of days to sell in December stayed at 10 days, compared to 16 days in December 2020 and a previous 5-year average of 28 days.

The average days to sell in 2021 was 10 days, compared to 16 days in 2020 and a previous 5-year average of 22 days.

Those requiring specific information on property values should contact a local REALTOR®.  Working with a Realtor is the best way to get a complete picture of the property and community you are considering.

View our HPI tool here to learn more: https://kwar.ca/hpi-dashboard

Historical Sales By Property Type


Months Supply of Homes for Sale


Historical Median Sales Price – By Property Type

Historical Average Sales Price – By Property Type

Average Days on Market

KWAR cautions that average sale price information can be useful in establishing long term trends but should not be used as an indicator that specific properties have increased or decreased in value. The average sale price is calculated based on the total dollar volume of all properties sold. Months Supply is the inventory of homes for sale at the end of a given month, divided by the average monthly closed sales from the last 12 months Those requiring specific information on property values should contact a local REALTOR®. REALTORS® have their fingers on the pulse of the market. They know the questions to ask, the areas to probe and what to look for so that you get a complete picture of the property and community you’re considering.

Kitchener-Waterloo Market Snapshot November 2021

Friday, December 3rd, 2021

A NEW RECORD HIGH FOR NUMBER OF HOME SALES IN NOVEMBER AND AN ALL-TIME RECORD LOW SUPPLY READING

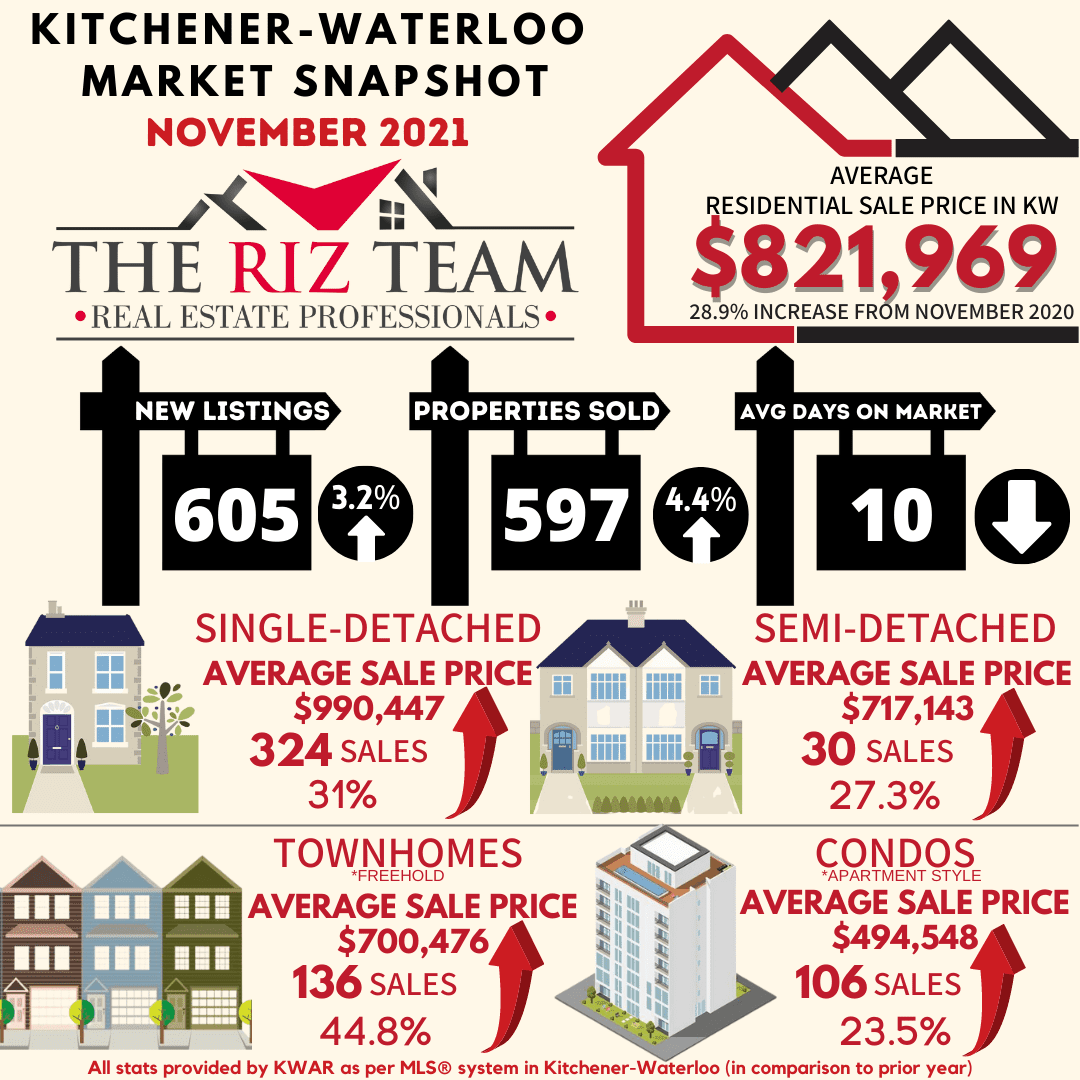
KITCHENER-WATERLOO, ON (December 3, 2021) –– There were 597 residential homes sold last month through the Multiple Listing Service® (MLS® System) of the Kitchener-Waterloo Association of REALTORS® (KWAR) setting a new record high for November. Compared to the same month last year, November sales were up 4.4% and on par with last month. The previous ten-year average number of residential sales for November is 446.

“The elevated pace of home sales we’ve seen for the past year and a half showed no sign of slowing down in November,” says KWAR’s president, Megan Bell. “Despite some speculation of there being a housing market correction in store for Waterloo Region, sustained homebuying demand combined with a record low level of inventory in November produced continued price growth in the MLS® HPI benchmark price.”

Total residential sales in November included 324 detached (down 3.9 per cent from November 2020), and 106 condominium units (up 27.7 per cent). Sales also included 30 semi-detached homes (down 25 per cent) and 136 townhouses (up 21.4 per cent).

In November, the average sale price for all residential properties in the Kitchener-Waterloo area was $821,969. This represents a 28.9 per cent increase over November 2020 and a 2 per cent decrease compared to October 2021.

  • The average price of a detached home was $990,447. This represents a 31 per cent increase from November 2020 and a decrease of 0.6 per cent compared to October 2021.
  • The average sale price for an apartment-style condominium was $494,548. This represents an increase of 23.5 per cent from November 2020 and an increase of 7.1 per cent compared to October 2021.
  • The average sale price for a townhouse was $700,476. This represents a 44.8 per cent increase from November 2020 and an increase of 0.9 per cent compared to October 2021.
  • The average sale price for a semi was $717,143. This represents an increase of 27.3 per cent compared to November 2020 and a decrease of 1.3 per cent compared to October 2021.

KWAR cautions that average sale price information can be useful in establishing long-term trends but should not be used as an indicator that specific properties have increased or decreased in value. The MLS® Home Price Index (HPI) provides the best way to gauge price trends because averages are strongly distorted by changes in the mix of sales activity from one month to the next.

The MLS® HPI composite benchmark price for all residential properties in Kitchener-Waterloo was $825,000 in November. This represents a 34.1 per cent increase over November 2020 and a 2.6 per cent increase compared to October 2021.

  • The benchmark price for a detached home was $915,800. This represents a 35.8 per cent increase from November 2020 and 3.2 per cent increase compared to October 2021.
  • The benchmark price for an apartment-style condominium was $398,000. This represents a 16.7 per cent increase from November 2020 and a 2.1 per cent decrease compared to October 2021.
  • The benchmark price for a townhouse is $627,900. This represents a 45.5 per cent increase from November 2020 and a 4.0 per cent increase compared to October 2021.

“Lack of supply continues to be the refrain in November,” says Bell. “With inventory hitting an all time low it is a tough time to be house hunting right now.”

There were 605 new listings added to the MLS® System in KW and area last month, an increase of 3.2 per cent compared to November of last year, and a 14.6 per cent decrease compared to the previous ten-year average for November.

The total number of homes available for sale in active status at the end of November was 207, a decrease of 40.2 per cent compared to November of last year, and 80.7 per cent below the previous ten-year average of 1,071 listings for November.

The number of months of inventory reached an all time low of 0.3 in November. Inventory has settled at under 1 month for thirteen consecutive months. The number of months of inventory represents how long it would take to sell off current inventories at the current rate of sales.

The average number of days to sell in November stayed at 10 days, compared to 14 days in November 2020 and a previous 5-year average of 24 days.

Bell notes that while the housing market typically slows down around the holiday season, she still expects to see a busier than normal December. “There is growing anxiety out there among buyers caused by the fear of missing out against rumblings of interest rates eventually going up in the year ahead.”

Those requiring specific information on property values should contact a local REALTOR®.  Working with a Realtor is the best way to get a complete picture of the property and community you are considering.

View our HPI tool here to learn more: https://kwar.ca/hpi-dashboard

Historical Sales by Property Type 


Months Supply of Homes for Sale

Historical Median Sales Price – By Property Type

Historical Average Sales Price – By Property Type

Average Days on Market

KWAR cautions that average sale price information can be useful in establishing long term trends but should not be used as an indicator that specific properties have increased or decreased in value. The average sale price is calculated based on the total dollar volume of all properties sold. Months Supply is the inventory of homes for sale at the end of a given month, divided by the average monthly closed sales from the last 12 months Those requiring specific information on property values should contact a local REALTOR®. REALTORS® have their fingers on the pulse of the market. They know the questions to ask, the areas to probe and what to look for so that you get a complete picture of the property and community you’re considering.

Kitchener-Waterloo Market Snapshot August 2021

Friday, September 3rd, 2021

August Stats 2021

HOMEBUYING DEMAND CONTINUES TO OVERWHELM HOUSING SUPPLY

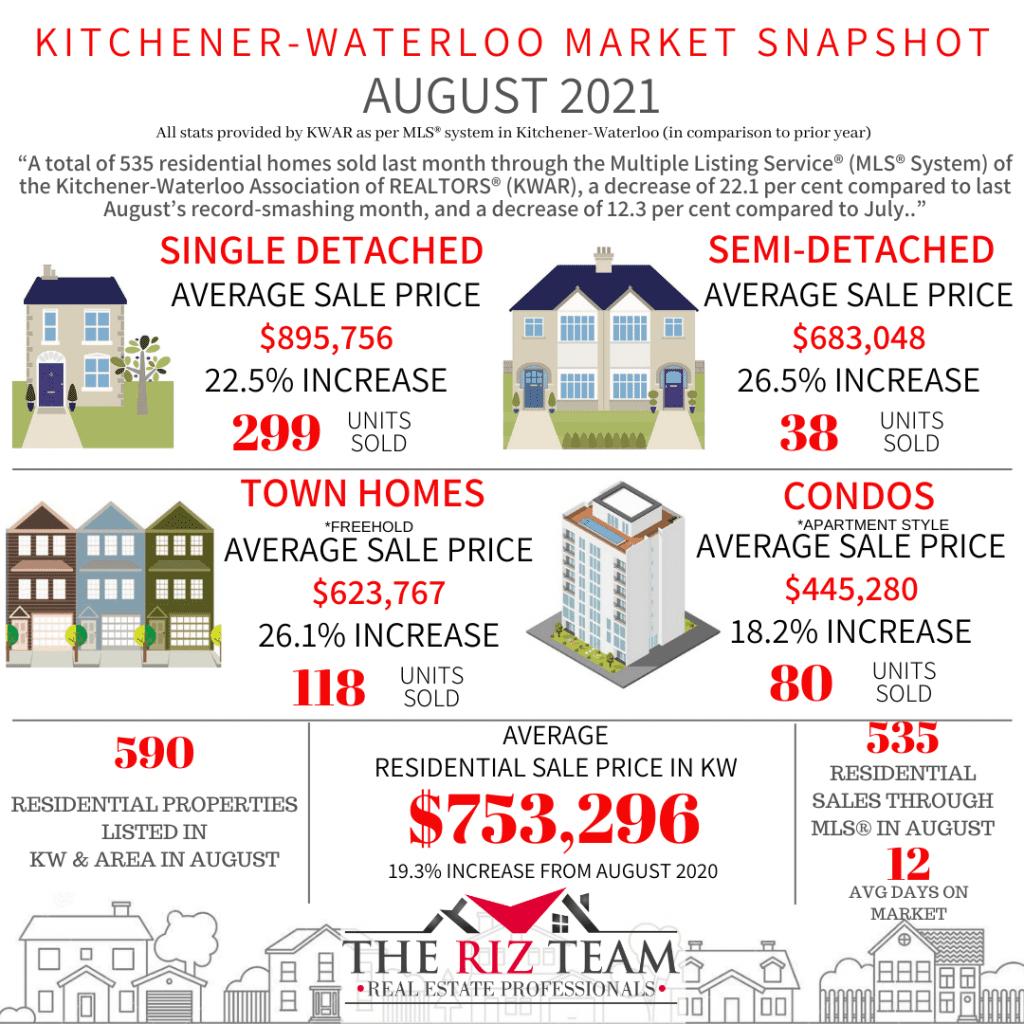
KITCHENER-WATERLOO, ON (September 3, 2021) –– A total of 535 residential homes sold last month through the Multiple Listing Service® (MLS® System) of the Kitchener-Waterloo Association of REALTORS® (KWAR), a decrease of 22.1 per cent compared to last August’s record-smashing month, and a decrease of 12.3 per cent compared to July.

While sales were down relative to last month and last August, they remained well above average notes KWAR’s president, Nicole Pohl. “The main reason for the decrease is simply that last month was the first full month in Step 3 of the reopening, and people were tired of the lockdown,” says Pohl. “They got out and enjoyed their summer and shifted their real estate needs to the back burner for a much-needed change of focus.”

Total residential sales in August included 299 detached (down 30.6 per cent from August 2020), and 80 condominium units (down 1.2 per cent). Sales also included 38 semi-detached homes (down 2.6) and 118 townhouses (down 13.2 per cent).

In August, the average sale price for all residential properties in the Kitchener-Waterloo area was $753,296. This represents a 19.3 per cent increase over August 2020 and a 0.3 per cent decrease compared to July 2021

  • The average price of a detached home was $895,756. This represents a 22.5 per cent increase from August 2020 and a decrease of 1.3 per cent compared to July 2021.
  • The average sale price for an apartment-style condominium was $445,280. This represents an increase of 18.2 per cent from August 2020 and an increase of 3.7 per cent compared to July 2021.
  • The average sale price for a townhouse was $623,767. This represents a 26.1 per cent increase from August 2020 and an increase of 0.1 per cent compared to July 2021.
  • The average sale price for a semi was $683,048. This represents an increase of 26.5 per cent compared to August 2020 and an increase of 2.3 per cent compared to July 2021.


KWAR cautions that average sale price information can be useful in establishing long-term trends but should not be used as an indicator that specific properties have increased or decreased in value. The MLS® Home Price Index (HPI) provides the best way to gauge price trends because averages are strongly distorted by changes in the mix of sales activity from one month to the next.

The MLS® HPI composite benchmark price for all residential properties in Kitchener-Waterloo was $757,900 in August. This represents a 29.5 per cent increase over August 2020 and a 1.2 per cent increase compared to July 2021.

  • The benchmark price for a detached home was $837,100. This represents a 31.5 per cent increase from August 2020 and 1.8 per cent increase compared to July 2021.
  • The benchmark price for an apartment-style condominium was $380,700. This represents a 11.7 per cent increase from August 2020 and a 1.3 per cent decrease compared to July 2021.
  • The benchmark price for a townhouse is $568,000. This represents a 37.3 per cent increase from August 2020 and a 0.6 per cent increase compared to July 2021.


There were 590 new listings added to the MLS® System in KW and area last month, a decrease of 27.6 per cent compared to August of last year, and a 13 per cent decrease compared to the previous ten-year average for August.

The total number of homes available for sale in active status at the end of August was 255, a decrease of 53.6 per cent compared to August of last year, and 79.5 per cent below the previous ten-year average of 1,252 listings for August.

“The number of homes coming to market continues to be overwhelmed by the number of homebuyers we have wanting to purchase in Waterloo Region,” says Pohl.

The number of months of inventory persisted from the July level of 0.4 months in August. Inventory has numbered less than 1 month since October. The number of months of inventory represents how long it would take to sell off current inventories at the current rate of sales.

The average number of days to sell in August was 12 days, compared to 17 days in August 2020 and a previous 5-year average of 26 days.

Those requiring specific information on property values should contact a local REALTOR®.  Working with a Realtor is the best way to get a complete picture of the property and community you are considering.

View our HPI tool here to learn more: https://kwar.ca/hpi-dashboard

Historical Sales By Property Type

Months Supply of Homes for Sale


Historical Median Sales Price – By Property Type


Historical Average Sales Price – By Property Type


Average Days on Market 

Kitchener-Waterloo Market Snapshot April 2021

Wednesday, May 5th, 2021

KW Market Stats April 2021

NUMBER OF HOME SALES IN APRIL SECOND HIGHEST ON RECORD

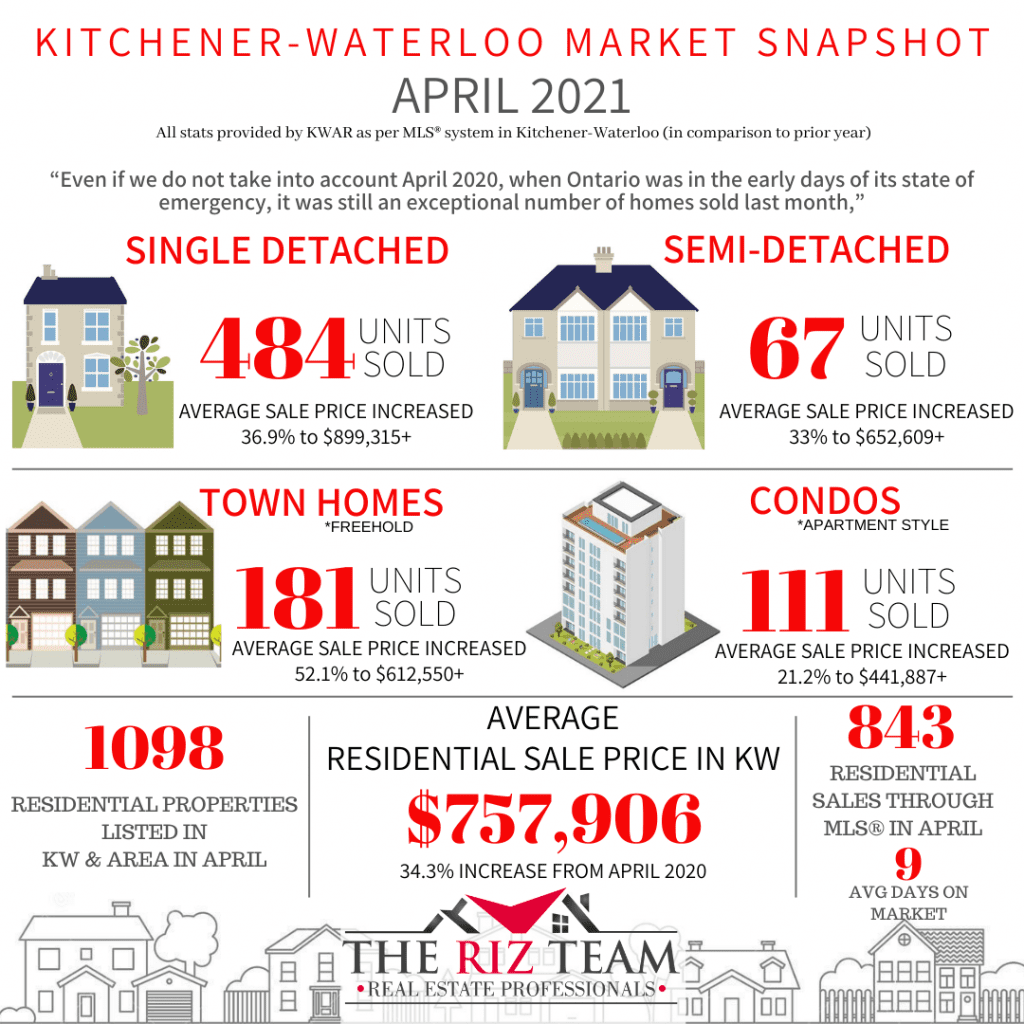
KITCHENER-WATERLOO, ON (May 5, 2021) –– Following last month’s record-smashing number of home sales, the Kitchener-Waterloo Association of REALTORS® (KWAR) posted the second-highest number of monthly home sales in April. There were 843 residential homes sold through the Multiple Listing Service® (MLS® System) of KWAR last month, an increase of 263.4 per cent compared to April 2020, and a decrease of 15.5 per cent compared to March 2021.

“Even if we do not take into account April 2020, when Ontario was in the early days of its state of emergency, it was still an exceptional number of homes sold last month,” says Nicole Pohl, President of KWAR. “The previous 10-year average number of residential sales for April was 618.”

Total residential sales in April included 484 detached (up 233.8 per cent from April 2020), and 111 condominium units (up 382.6 per cent). Sales also included 67 semi-detached homes (up 294.1 per cent) and 181 townhouses (up 285.1 per cent).

In April, the average sale price for all residential properties in the Kitchener-Waterloo area was $757,906. This represents a 34.3 per cent increase over April 2020 and a 0.9 per cent decrease compared to March 2021.

      • The average price of a detached home was $899,315. This represents a 36.9 per cent increase from April 2020 and an increase of 0.04 per cent compared to March 2021.
      • The average sale price for an apartment-style condominium was $441,887. This represents an increase of 21.2 per cent from April 2020 and an increase of 4.2 per cent compared to March 2021.
      • The average sale price for a townhouse was $612,550. This represents a 52.1 per cent increase from April 2020 and a decrease of 2.03 per cent compared to March 2021.
      • The average sale price for a semi was $652,609. This represents an increase of 33.0 per cent compared to April 2020 and an increase of 0.18 per cent compared to March 2021.

“We are starting to see home prices calm down in March and April compared to what was happening in January and February,” says Pohl.

KWAR cautions that average sale price information can be useful in establishing long-term trends but should not be used as an indicator that specific properties have increased or decreased in value. The MLS® Home Price Index (HPI) provides the best way to gauge price trends because averages are strongly distorted by changes in the mix of sales activity from one month to the next.

The MLS® HPI composite benchmark price for all residential properties in Kitchener-Waterloo was $742,800 in April. This represents a 40.4 per cent increase over April 2020 and a 0.6 per cent increase compared to March 2021.

      • The benchmark price for a detached home was $809,000. This represents a 39.9 per cent increase from April 2020 and 1.0 per cent decrease compared to March 2021.
      • The benchmark price for an apartment-style condominium was $374,100. This represents a 31.1 per cent increase from April 2020 and a 4.3 per cent increase compared to March 2021.
      • The benchmark price for a townhouse is $591,300. This represents a 47.2 per cent increase from April 2020 and a 6.6 per cent increase compared to March 2021.

There were 1,098 new listings added to the MLS® System in KW and area last month, an increase of 162.7 per cent compared to April of last year, and a 17.15 per cent increase compared to the previous ten-year average for April* (*calculated from 2019 to 2010 to adjust for the impact of the state of emergency on activity in April 2020).

The total number of homes available for sale in active status at the end of April was 458, a decrease of 21.8 per cent compared to April of last year, and 66.9 per cent below the previous ten-year average of 1,384 listings for April* (*calculated from 2010 to 2019 to adjust for the impact of the state of emergency on activity in April 2020).

The number of months of inventory was 0.7 in April, which is unchanged from March. Inventory has numbered less than 1 month since October. The number of months of inventory represents how long it would take to sell off current inventories at the current rate of sales.

The average number of days to sell in April was 9 days, compared to 19 days in April 2020 and a previous 5-year average of 21 days.

Those requiring specific information on property values should contact a local REALTOR®.  Working with a Realtor is the best way to get a complete picture of the property and community you are considering.

View our HPI tool here to learn more: https://kwar.ca/hpi-dashboard

Historical Sales By Property Type

Months Supply of Homes for Sale

Historical Median Sales Price – By Property Type

Historical Average Sales Price – By Property Type

Average Days on Market Chart


© Copyright 2017, Real Estate Websites by Redman Technologies Inc. | Privacy Policy | Disclaimer | Sitemap

MLS®, REALTOR®, and the associated logos are trademarks of The Canadian Real Estate Association.

The data included on this website is deemed to be reliable, but is not guaranteed to be accurate by the Kitchener-Waterloo Real Estate Board. The trademarks REALTOR®, REALTORS® and the REALTOR® logo are controlled by The Canadian Real Estate Association (CREA) and identify real estate professionals who are members of CREA. Used under license.