The Riz Team Blog

Kitchener Waterloo Market Snapshot March 2023

Home Prices Inch Up in March as We Enter the Spring Market

If you are considering to Sell your home or Buy a home in the next short while it would be highly beneficial for you to connect with one of our Team Agents at

The Riz Team

Do you want to know what your home is worth today? Click Below for our Online No Obligation Market EvaluationClick Here
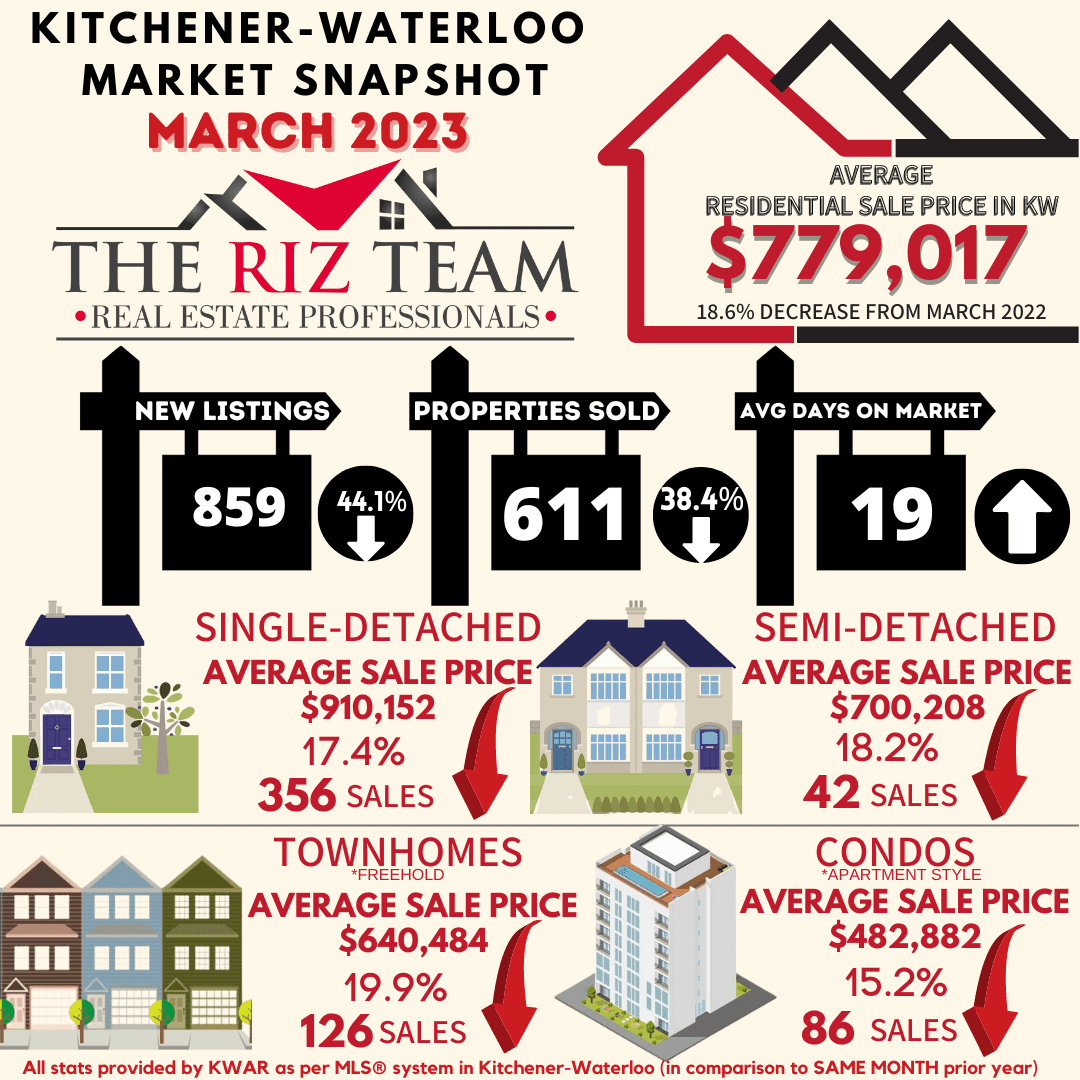
WATERLOO REGION, ON (April 5, 2023) — Sales volume through the Multiple Listing Service® (MLS®) System of the Waterloo Region Association of REALTORS® (WRAR) set another low last month, with 611 homes sold in March, representing a decrease of 38.4 per cent compared to March 2022 and 33.6 per cent below the previous 5-year average for the month.

“Sales activity was well below average in March, and while the number of homes sold is down, sale prices have increased modestly month over month,” says Megan Bell, president of WRAR. “With borrowing costs stabilizing and lenders promoting more appealing rates, I think we will see more buyers coming off the sidelines this spring, adding demand to our already popular Waterloo Region and pushing home prices up slightly.”

Total residential sales in March included 356 detached (down 39.9 per cent from March 2022), and 126 townhouses (down 29.6 per cent). Sales also included 86 condominium units (down 32.8 per cent) and 42 semi-detached homes (down 53.3 per cent).

In March, the average sale price for all residential properties in Waterloo Region was $779,017. This represents a 18.6 per cent decrease compared to March 2022 and a 2.4 per cent increase compared to February 2023.

  • The average price of a detached home was $910,152. This represents a 17.4 per cent decrease from March 2022 and an increase of 2.9 per cent compared to February 2023.
  • The average sale price for a townhouse was $640,484. This represents a 19.9 per cent decrease from March 2022 and a decrease of 6 per cent compared to February 2023.
  • The average sale price for an apartment-style condominium was $482,882. This represents a decrease of 15.2 per cent from March 2022 and an increase of 5.3 per cent compared to February 2023.
  • The average sale price for a semi was $700,208. This represents a decrease of 18.2 per cent compared to March 2022 and an increase of 4.9 per cent compared to February 2023.

WRAR cautions that average sale price information can be useful in establishing long-term trends but should not be used as an indicator that specific properties have increased or decreased in value. The MLS® Home Price Index (HPI) provides the best way to gauge price trends because averages are strongly distorted by changes in the mix of sales activity from one month to the next.

March average sales price by property type

MLS® Home Price Index Benchmark Price

Kitchener-Waterloo Cambridge
Benchmark Type: March 2023 Monthly % Change Yr./Yr. % Change March 2023 Monthly % Change Yr./Yr. % Change
Composite $739,400 1.8 -21.2 $746,300 0.5 -20.6
Detached $839,500 2.0 -20.4 $776,100 0.7 -21.1
Townhouse $600,500 2.0 -23.5 $641,700 0.7 -17.5
Apartment $474,000 0.1 -18.0 $483,000 -1.9 -13.5


“This is a peculiar market. While we certainly will not have the same volume of sales as in 2022, demand remains strong. For those that were previously hesitant to sell their properties, March’s slight uptick in sales prices is a good indication of the continued pent-up demand within the Region and we do not anticipate this slowing down anytime soon,” says Bell. “These and other shifting influences mean it has never been more important for buyers and sellers alike to work with a local REALTOR® to help provide expertise during the homebuying and selling process.”

While on a year-over-year basis, prices have come down close to 20 per cent, they are up compared to two years ago.

There were 859 new listings added to the MLS® System in Waterloo Region last month, a decrease of 44.1 per cent compared to March of last year and a 30.5 per cent decrease compared to the previous ten-year average for March.

The total number of homes available for sale in active status at the end of March was 716, an increase of 17.2 per cent compared to March of last year and 42.4 per cent below the previous ten-year average of 1243 listings for March.

The number of months of inventory is up 85.7 per cent compared to March of last year, but still historically low at 1.3 months. The number of months of inventory represents how long it would take to sell off current inventories at the current sales rate.

The average number of days to sell in March was 19, compared to 8 days in March 2022. The previous 5-year average is 15 days.

View our HPI tool here to learn more: https://wrar.ca/hpi/

Click on any of the graphs below for an interactive view.

Avg Sales Price Municipalities
Avg Sales Price Townships
Monthly Sales Price Property Type
Monthly Supply Homes for Sale
Monthly median sales price property type
monthly average sales price by property type
monthly average days on market

Tags: , , , , , , , , , , , ,


© Copyright 2017, Real Estate Websites by Redman Technologies Inc. | Privacy Policy | Disclaimer | Sitemap

MLS®, REALTOR®, and the associated logos are trademarks of The Canadian Real Estate Association.

The data included on this website is deemed to be reliable, but is not guaranteed to be accurate by the Kitchener-Waterloo Real Estate Board. The trademarks REALTOR®, REALTORS® and the REALTOR® logo are controlled by The Canadian Real Estate Association (CREA) and identify real estate professionals who are members of CREA. Used under license.