Kitchener Waterloo Market Snapshot February 2023
Home Sales Down, Prices Stabilizing in February
If you are considering to Sell your home or Buy a home in the next short while it would be highly beneficial for you to connect with one of our Team Agents at
The Riz Team
Do you want to know what your home is worth today? Click Below for our Online No Obligation Market Evaluation
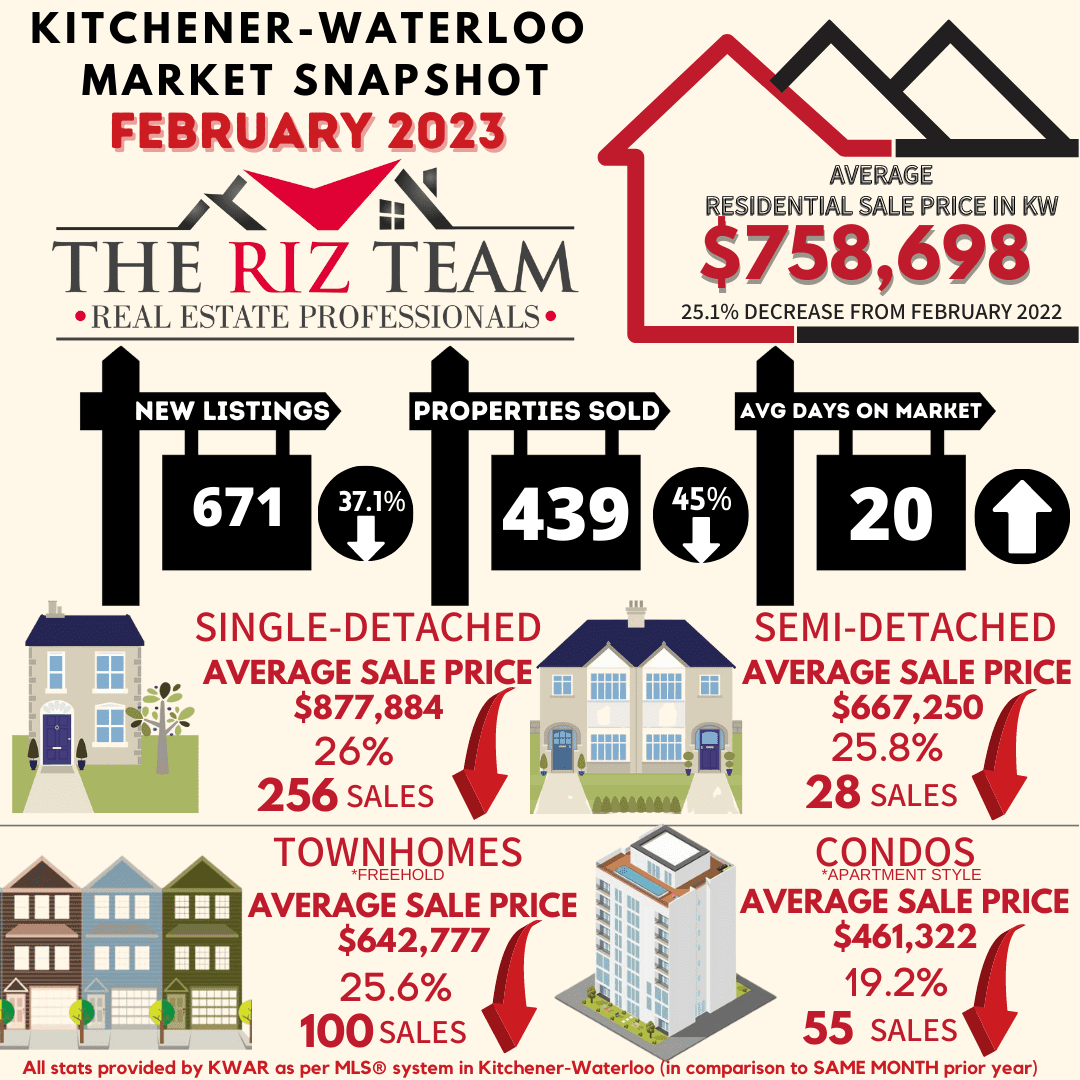
WATERLOO REGION, ON (March 3, 2023) —Sales volume through the Multiple Listing Service® (MLS®) System of the Waterloo Region Association of REALTORS® (WRAR) set a low for the month of February, with 439 homes sold, representing a decrease of 45.0 per cent compared to February 2022 and 31.5 per cent below the previous 5-year average for the month.
“Once again, we experienced record low listing sales in February,” says Megan Bell, president of WRAR. “Increased borrowing costs, coupled with a shortage of housing supply and strong demand, have put a strain on prospective buyers as affordability continues to be a top concern; however, home prices have remained stable for the past several months.”
Total residential sales in February included 256 detached (down 45.3 per cent from February 2022), and 100 townhouses (down 33.3 per cent). Sales also included 55 condominium units (down 52.6 per cent) and 28 semi-detached homes (down 56.3 per cent).
In February, the average sale price for all residential properties in Waterloo Region was $758,698. This represents a 25.1 per cent decrease compared to February 2022 and a 0.6 per cent decrease compared to January 2023.
- The average price of a detached home was $877,884. This represents a 26.0 per cent decrease from February 2022 and a decrease 0.9 per cent compared to January 2023.
- The average sale price for a townhouse was $642,777. This represents a 25.6 per cent decrease from February 2022 and an increase of 2.7 per cent compared to January 2023.
- The average sale price for an apartment-style condominium was $461,322. This represents a decrease of 19.2 per cent from February 2022 and a decrease of 6.9 per cent compared to January 2023.
- The average sale price for a semi was $667,250. This represents a decrease of 25.8 per cent compared to February 2022 and an increase of 2.6 per cent compared to January 2023.
WRAR cautions that average sale price information can be useful in establishing long-term trends but should not be used as an indicator that specific properties have increased or decreased in value. The MLS® Home Price Index (HPI) provides the best way to gauge price trends because averages are strongly distorted by changes in the mix of sales activity from one month to the next.

MLS® Home Price Index Benchmark Price |
||||||
| Kitchener-Waterloo | Cambridge | |||||
| Benchmark Type: | February 2023 | Monthly % Change | Yr./Yr. % Change | February 2023 | Monthly % Change | Yr./Yr. % Change |
| Composite | $726,500 | 3.0 | -24.2 | $742,300 | 1.6 | -25.3 |
| Detached | $822,800 | 4.2 | -24.8 | $770,800 | 1.8 | -27.0 |
| Townhouse | $588,500 | 0.9 | -22.3 | $637,400 | -0.2 | -13.8 |
| Apartment | $473,800 | -1.6 | -14.3 | $492,100 | 0.9 | -7.6 |

“Limited supply and the small number of listings coming to the market continues to be a trend within the region,” says Bell. “There may be some hesitation for those considering selling their property due to decreased reported sale prices; however, with demand continuing to outpace supply and prices stabilizing, sellers are in a healthy position to make their move.”
Bell points out that although prices have fallen more than 20 per cent from their peak in February 2022, they remain significantly higher than three years ago.
There were 671 new listings added to the MLS® System in Waterloo Region last month, a decrease of 37.1 per cent compared to February of last year and a 24.8 per cent decrease compared to the previous ten-year average for February.
The total number of homes available for sale in active status at the end of February was 692, an increase of 75.2 per cent compared to February of last year and 38.0 per cent below the previous ten-year average of 1117 listings for February.
The number of months of inventory is up 140.0 per cent compared to February of last year, but still historically low at 1.2 months. The number of months of inventory represents how long it would take to sell off current inventories at the current sales rate.
The average number of days to sell in February was 20, compared to 8 days in February 2022. The previous 5-year average is 16 days.
View our HPI tool here to learn more: https://wrar.ca/hpi/
Click on any of the graphs below for an interactive view.


Tags: buyers, Kitchener Buyers, Kitchener Sellers, kitchener-waterloo, Market Update, real estate market, riz jadavji, royal lepage, Royal Lepage Wolle Realty, the riz team, Waterloo Buyers, waterloo real estate, Waterloo Sellers
This entry was posted on Friday, March 3rd, 2023 at 11:55 am and is filed under Kitchener Buyers, Kitchener Sellers, Market Stats, Market Update, Real Estate News, Realtor Tips, Waterloo Buyers, Waterloo Sellers. You can follow any responses to this entry through the RSS 2.0 feed. Both comments and pings are currently closed.