Posts Tagged ‘kitchener realtor’
Friday, February 6th, 2026
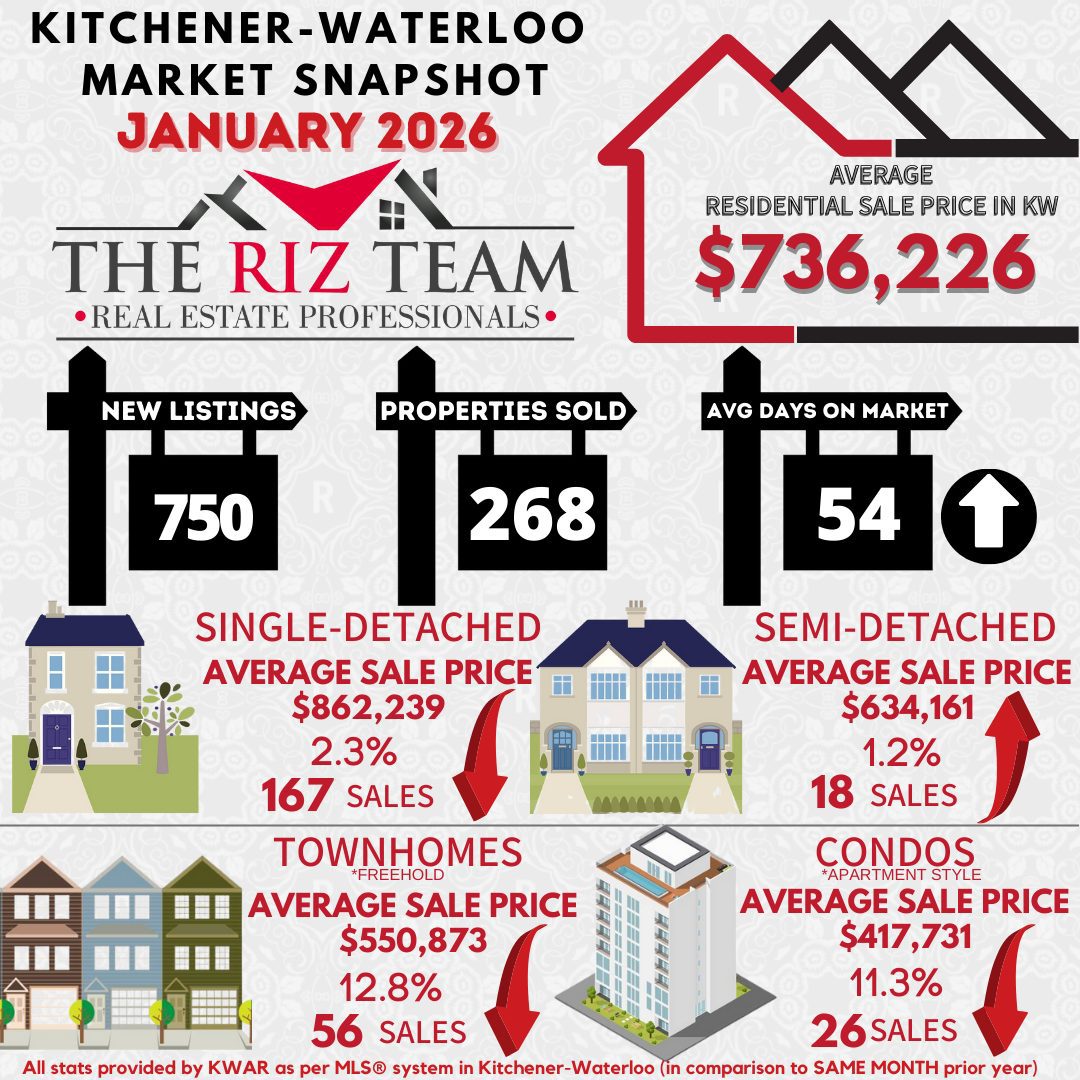
Waterloo Region Housing Market Start in 2026
“Despite the monthly decrease in sales volume, Waterloo Region is showing encouraging signs with modest monthly price growth in both Kitchener-Waterloo and Cambridge. The doubling of new listings from December to January demonstrates renewed seller confidence, especially considering January’s challenging weather conditions that included significant snowstorms and periods of extreme cold that prompted weather warnings across the region.” – Bill Duce, Cornerstone CEO
If you are considering to SELL your home or BUY a home in the next short while,
it would be highly beneficial for you to connect with one of our Team Agents at
Do you want to know what your home is worth today? Click Below for our Online No Obligation Market Evaluation:

Waterloo Region Area Highlights:
- Waterloo Region home sales decreased 13.9% month-over-month.
- The number of newly listed properties increased 100.3% on a month-over-month basis.
- In Kitchener-Waterloo the MLS® Home Price Index (HPI) increased 1.0% month-over-month and was down 9.3% on a year-over-year basis. In Cambridge the HPI increased 0.3% month-over-month and was down 8.7% on a year-over-year basis.
- The supply of inventory across the market increased 13.6 percent on a year-over-year basis, resulting in a 2.5-month supply of all property types by the end January
Tags: buyers, for sale, Homes For Sale, Kitchener Buyers, Kitchener Homes, kitchener real estate, kitchener realtor, kitchener-waterloo association of realtors, rizsellskw.com, royal lepage, Royal Lepage Wolle Realty, the riz team, Waterloo Buyers, waterloo real estate, waterloo realtor, Waterloo Sellers
Posted in Kitchener Buyers, Kitchener Sellers, Market Stats, Market Update, Real Estate News, Realtor Tips, Waterloo Buyers, Waterloo Sellers | Comments Off on Kitchener Waterloo Market Snapshot January 2026
Friday, September 5th, 2025
Waterloo Region Real Estate Market Shows Signs of Stabilization as Interest Rates Hold Steady
“The market is showing signs of stabilization, though we’re seeing a continued cooling trend compared to last year. While sales volumes have only slightly decreased year-over-year, the more notable change is in pricing, with most property types experiencing moderate downward pressure,” says Christal Moura, spokesperson for the Waterloo Region market.
If you are considering to SELL your home or BUY a home in the next short while,
it would be highly beneficial for you to connect with one of our Team Agents at
Do you want to know what your home is worth today? Click Below for our Online No Obligation Market Evaluation:
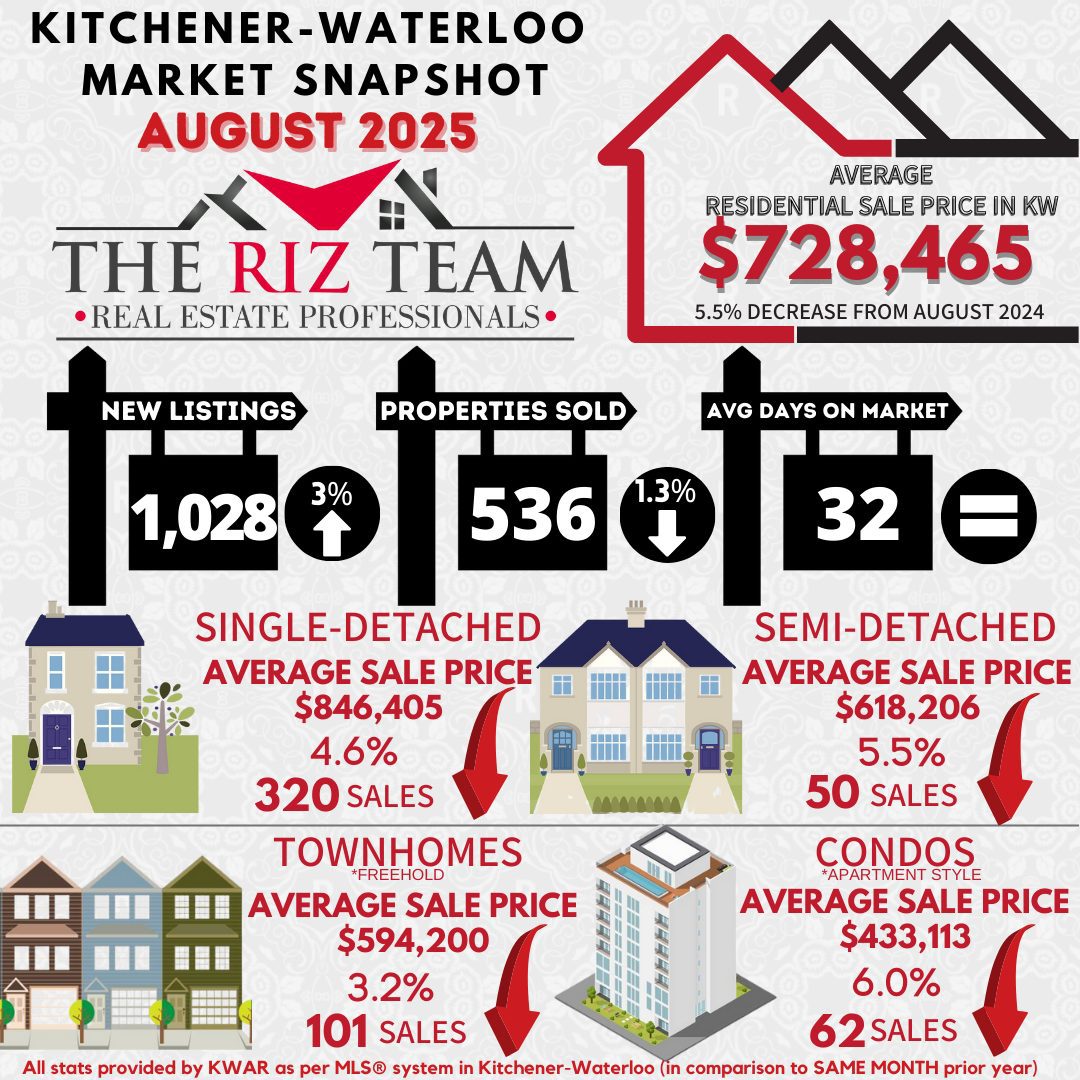
WATERLOO REGION, ON (September 5, 2025) —In August, a total of 536 homes were sold in the Waterloo Region via the Multiple Listing Service® (MLS®) System of the Cornerstone Association of REALTORS® (Cornerstone). This is a decrease of 1.3 per cent compared with the same period last year and a decline of 23.1 per cent compared to the average number of homes sold in the previous ten years for the same month.
Total residential sales in August included 320 detached homes (down 5.6 per cent from August 2024), and 101 townhouses (down 1.0 per cent). Sales also included 62 condominium units (up 1.6 per cent) and 50 semi-detached homes (up 25.0 per cent).
In August, the average sale price for all residential properties in Waterloo Region was $728,465. This represents a 5.5 per cent decrease compared to August 2024 and a 1.0 per cent decrease compared to July 2025.
- The average sale price of a detached home was $846,405. This represents a 4.6 per cent decrease from August 2024 and a decrease of 1.3 per cent compared to July 2025.
- The average sale price for a townhouse was $594,200. This represents a 3.2 percent decrease from August 2024 and a 1.7 percent decrease compared to July 2025.
- The average sale price for an apartment-style condominium was $433,113. This represents a 6.0 per cent decrease from August 2024 and an increase of 4.2 per cent compared to July 2025.
- The average sale price for a semi was $618,206. This represents a 5.5 per cent decrease from August 2024 and a 4.1 per cent decrease compared to July 2025.
CORNERSTONE cautions that average sale price information can help establish long-term trends but does not indicate specific properties have increased or decreased in value. The MLS® Home Price Index (HPI) provides the best way to gauge price trends because averages are strongly distorted by changes in the mix of sales activity from one month to the next.
MLS® Home Price Index Benchmark Price (HPI)
|
|
Kitchener-Waterloo |
Cambridge |
| Benchmark Type: |
August 2025 |
Monthly % Change |
Yr./Yr. % Change |
August 2025 |
Monthly % Change |
Yr./Yr. % Change |
| Composite |
$675,400 |
-0.4 |
-7.1 |
$701,100 |
-1.5 |
-5.6 |
| Single Family |
$795,400 |
-0.1 |
-5.2 |
$742,100 |
-1.7 |
-4.4 |
| Townhouse |
$555,400 |
-1.3 |
-8.5 |
$609,600 |
-0.2 |
-6.6 |
| Apartment |
$409,900 |
-0.2 |
-7.1 |
$455,200 |
-0.5 |
-5.7 |

There were 1,028 new listings added to the MLS® System in Waterloo Region last month, an increase of 3. per cent compared to August last year and a 11.0 per cent increase compared to the previous ten-year average for August.
The average time to sell a home in August was 32 days, which is the same as the previous month. In August 2024, it took 25 days for a home to sell, and the five-year average was 19 days.
“Despite the softer market conditions, we are encouraged by the healthy increase in new listings, which gives buyers more options,” says Moura. “While our local market statistics indicate signs of stabilization, we are operating in a complex economic environment. The Bank of Canada’s decision to maintain interest rates at 2.75% for the third consecutive time provides some predictability for both buyers and sellers. However, economic uncertainty and the Bank’s focus on inflation, especially regarding shelter costs, remind us that we are in a period where both buyers and sellers need to stay informed and collaborate closely with their REALTOR® to navigate current market conditions.”
Tags: buyers, for sale, kitchener for sale, kitchener real estate, kitchener realtor, kitchener-waterloo, KW Market Update, KW Real Estate, riz jadavji, Royal Lepage Wolle Realty, sales representative, waterloo for sale, waterloo real estate, www.rizsellskw.com
Posted in Kitchener Buyers, Kitchener Sellers, Market Stats, Market Update, Real Estate News, Waterloo Buyers, Waterloo Sellers | Comments Off on Kitchener Waterloo Market Snapshot August 2025
Thursday, August 7th, 2025
July Sees Stable Sales and Market Balance in Waterloo Region Housing
“While sales volumes remained stable compared to last year, we’re seeing continued price adjustments across all property types,” says Christal Moura, spokesperson for the Waterloo Region market. “The Bank of Canada’s decision to hold rates steady in July, combined with increased inventory and price moderation, is creating more opportunities for buyers who have been waiting to enter the market, though broader economic uncertainties surrounding the Canada-US trade war continue to impact consumer confidence.”
If you are considering to SELL your home or BUY a home in the next short while,
it would be highly beneficial for you to connect with one of our Team Agents at
Do you want to know what your home is worth today? Click Below for our Online No Obligation Market Evaluation:
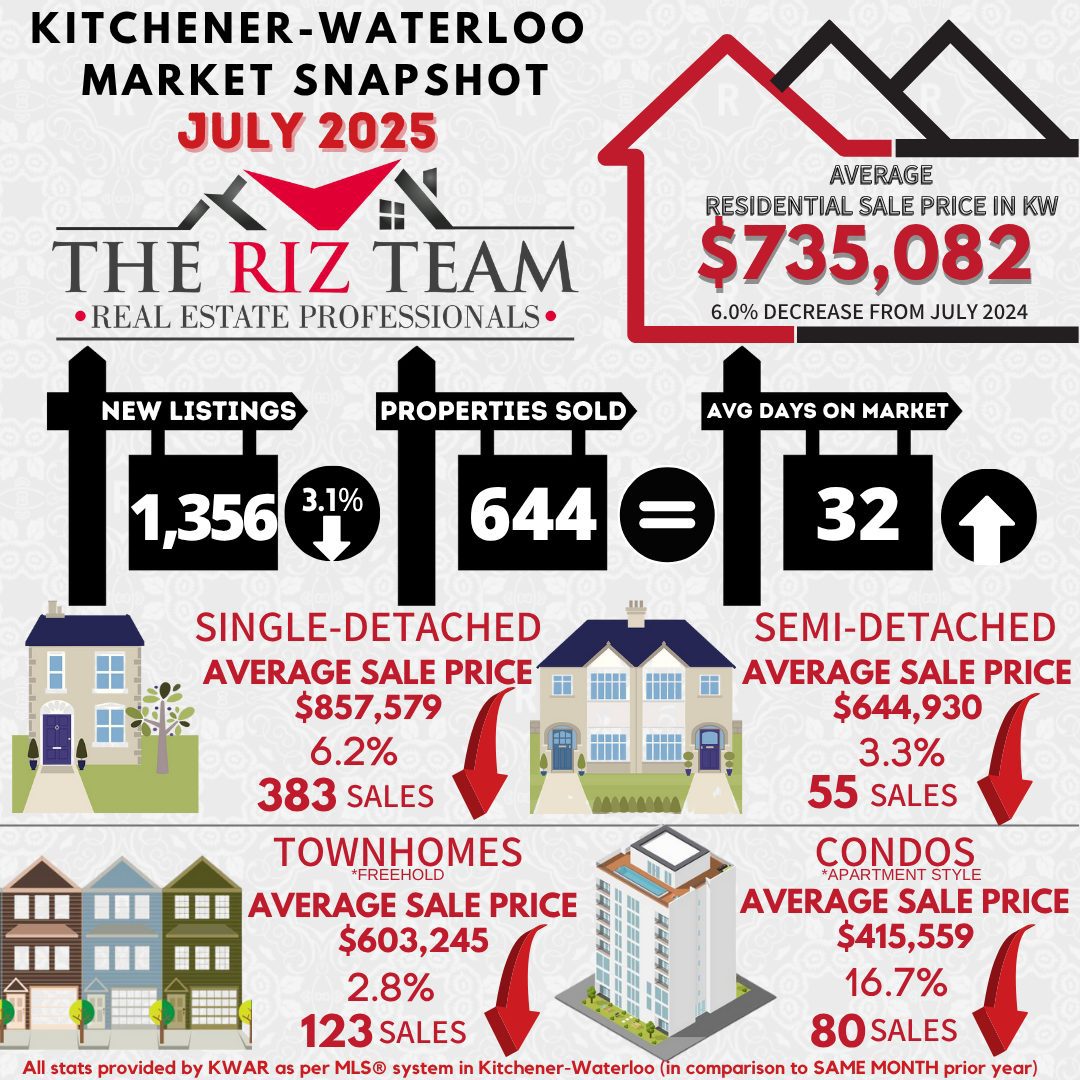
WATERLOO REGION, ON (August 7, 2025) —In July, a total of 644 homes were sold in the Waterloo Region via the Multiple Listing Service® (MLS®) System of the Cornerstone Association of REALTORS® (Cornerstone). This is on par with the same period last year and a decline of 14.3 per cent compared to the average number of homes sold in the previous ten years for the same month.
“While sales volumes remained stable compared to last year, we’re seeing continued price adjustments across all property types,” says Christal Moura, spokesperson for the Waterloo Region market. “The Bank of Canada’s decision to hold rates steady in July, combined with increased inventory and price moderation, is creating more opportunities for buyers who have been waiting to enter the market, though broader economic uncertainties surrounding the Canada-US trade war continue to impact consumer confidence.”
Total residential sales in July included 383 detached homes (up 0.5 per cent from July 2024), and 123 townhouses (down 5.4 per cent). Sales also included 80 condominium units (down 3.6 per cent) and 55 semi-detached homes (up 14.6 per cent).
In July, the average sale price for all residential properties in Waterloo Region was $735,082. This represents a 6.0 per cent decrease compared to July 2024 and a 5.7 per cent decrease compared to June 2025.
- The average sale price of a detached home was $857,579. This represents a 6.2 per cent decrease from July 2024 and a decrease of 4.5 per cent compared to June 2025.
- The average sale price for a townhouse was $603,245. This represents a 2.8 percent decrease from July 2024 and a 3.5 percent decrease compared to June 2025.
- The average sale price for an apartment-style condominium was $415,559. This represents a 16.7 per cent decrease from July 2024 and a decrease of 4.4 per cent compared to June 2025.
- The average sale price for a semi was $644,930. This represents a 3.3 per cent decrease from July 2024 and a 0.6 per cent decrease compared to June 2025.
CORNERSTONE cautions that average sale price information can help establish long-term trends but does not indicate specific properties have increased or decreased in value. The MLS® Home Price Index (HPI) provides the best way to gauge price trends because averages are strongly distorted by changes in the mix of sales activity from one month to the next.
|
MLS® Home Price Index Benchmark Price (HPI)
|
| |
Kitchener-Waterloo |
Cambridge |
| Benchmark Type: |
July 2025 |
Monthly % Change |
Yr./Yr. % Change |
July 2025 |
Monthly % Change |
Yr./Yr. % Change |
| Composite |
$677,900 |
-1.2 |
-7.3 |
$711,600 |
-1.7 |
-4.2 |
| Single Family |
$796,000 |
-1.2 |
-5.1 |
$755,000 |
-1.6 |
-2.8 |
| Townhouse |
$562,600 |
-1.0 |
-9.0 |
$610,700 |
-2.1 |
-6.2 |
| Apartment |
$410,600 |
-1.7 |
-9.7 |
$457,600 |
-0.1 |
-7.8 |

There were 1,356 new listings added to the MLS® System in Waterloo Region last month, a decrease of 3.1 per cent compared to July last year and a 21.2 per cent increase compared to the previous ten-year average for July.
The average time to sell a home in July was 32 days, compared to 27 days in the previous month. In July 2024, it took 22 days for a home to sell, and the five-year average was 17 days.
“The longer average days on the market reflect that we’re in a more balanced market environment,” Moura says. “This means that buyers can take their time to make informed decisions, while sellers are adjusting their expectations to fit the current market conditions.”
View our HPI tool here to learn more: https://www.cornerstone.inc/stats/
Download PDF Version
Cornerstone Association of REALTORS® cautions that average sale price information can help identify long-term trends but should not indicate that specific properties have increased or decreased in value. The average sale price is calculated based on the total dollar volume of all properties sold. Months’ Supply is the inventory of homes for sale at the end of a given month, divided by the average monthly closed sales from the last 12 months. Those requiring specific information on property values should contact a Waterloo Region REALTOR®. REALTORS® have their fingers on the pulse of the market. They know the questions to ask, the areas to probe and what to look for to get a complete picture of the property and community you’re considering.
Tags: buyers, for sale, Homes For Sale, kitchener for sale, Kitchener Homes, kitchener realtor, Kitchener Sellers, kitchener-waterloo, KW Market Update, KW Real Estate, riz jadavji, Royal Lepage Wolle Realty, sales representative, the riz team, waterloo for sale, waterloo real estate, www.rizsellskw.com
Posted in Kitchener Buyers, Kitchener Sellers, Market Stats, Market Update, Real Estate News, Realtor Tips, Waterloo Buyers, Waterloo Sellers | Comments Off on Kitchener Waterloo Market Snapshot July 2025
Thursday, August 3rd, 2023
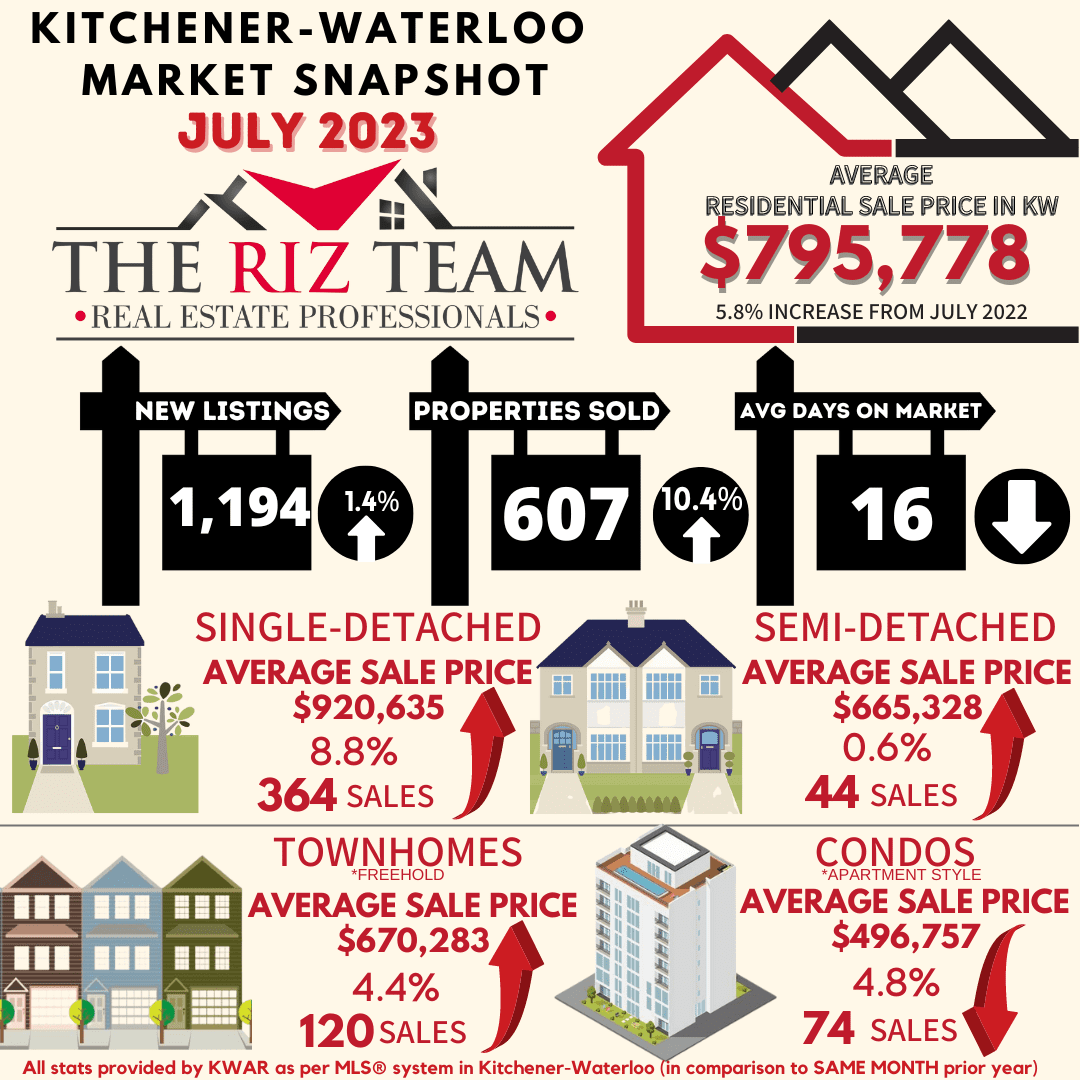
Strong Listing Activity in July
If you are considering to Sell your home or Buy a home in the next short while it would be highly beneficial for you to connect with one of our Team Agents at
Do you want to know what your home is worth today? Click Below for our Online No Obligation Market Evaluation
Tags: buyers, for sale, home sales, Homes For Sale, kitchener for sale, kitchener real estate, kitchener realtor, Kitchener Sellers, kitchener-waterloo, kitchener-waterloo association of realtors, real estate, riz jadavji, Royal Lepage Wolle Realty, the riz team, TheRizTeam, waterloo, Waterloo Homes, waterloo real estate, waterloo realtor
Posted in Enhance Your Home, Kitchener Buyers, Kitchener Sellers, Market Stats, Market Update, Real Estate News, Realtor Tips, Waterloo Buyers, Waterloo Sellers | Comments Off on Kitchener Waterloo Market Snapshot July 2023
Monday, April 4th, 2022
KITCHENER-WATERLOO HOME SALES UP IN MARCH, AVERAGE PRICE DIPS FROM FEBRUARY
“The skyrocketing prices of the last two months took a bit of a breather in March, with the overall average price dipping five per cent compared to what we saw in February,” said Megan Bell, President of KWAR. “While it is too soon to draw conclusions from just one month of home sales, I know many will be comforted to see a leveling off on the average price, no matter how incremental.”
If you are considering to Sell your home or Buy a home in the next short while it would be highly beneficial for you to connect with one of our Team Agents at
Do you want to know what your home is worth today? Click Below for our Online No Obligation Market Evaluation
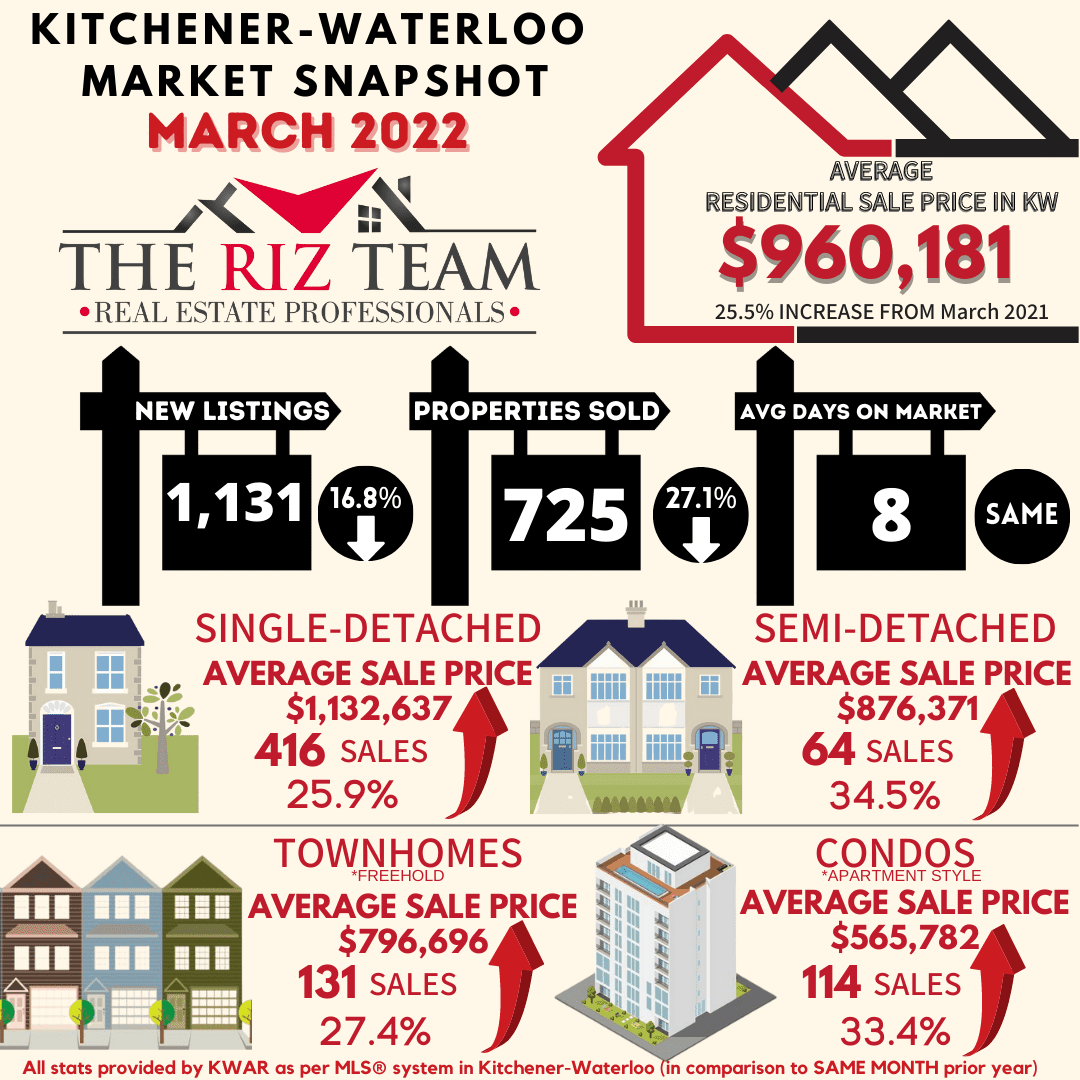
Total residential sales in March included 416 detached (down 29.7 per cent from March 2021), and 114 condominium units (down 9.5 per cent). Sales also included 64 semi-detached homes (down 17.9 per cent) and 131 townhouses (down 33.8 per cent).
In March, the average sale price for all residential properties in the Kitchener-Waterloo area was $960,181. This represents a 25.5 per cent increase over March 2021 and a 4.6 per cent decrease compared to February 2022.
- The average price of a detached home was $1,132,637. This represents a 25.9 per cent increase from March 2021 and a decrease 6.4 per cent compared to February 2022.
- The average sale price for an apartment-style condominium was $565,782. This represents an increase of 33.4 per cent from March 2021 and a decrease of 1.2 per cent compared to February 2022.
- The average sale price for a townhouse was $796,696. This represents a 27.4 per cent increase from March 2021 and a decrease of 7.6 per cent compared to February 2022.
- The average sale price for a semi was $876,371. This represents an increase of 34.5 per cent compared to March 2021 and a decrease of 5.0 per cent compared to February 2022.

KWAR cautions that average sale price information can be useful in establishing long-term trends but should not be used as an indicator that specific properties have increased or decreased in value. The MLS®® Home Price Index (HPI) provides the best way to gauge price trends because averages are strongly distorted by changes in the mix of sales activity from one month to the next.
The MLS® HPI composite benchmark price for all residential properties in Kitchener-Waterloo was $960,100 in March. This represents a 29.6 per cent increase over March 2021 and a 1.5 per cent decrease compared to February 2022.
- The benchmark price for a detached home was $1,046,200. This represents a 28.1 per cent increase from March 2021 and 4.0 per cent decrease compared to February 2022.
- The benchmark price for an apartment-style condominium was $484,000. This represents a 32.9 per cent increase from March 2021 and a 4.2 per cent increase compared to February 2022.
- The benchmark price for a townhouse is $765,500. This represents a 41.3 per cent increase from March 2021 and a 4.9 per cent increase compared to February 2022.
-

“Even though the average price decreased across all property types on a month-to-month basis, the MLS® HPI showed continued monthly gains for both townhouse and apartment property types,” notes Bell. “As the province feels its way out of the pandemic, we are beginning to see some very preliminary signs of a potential cooling. We are not seeing quite as many multiple offers and some offers are coming in with conditions. Of course, when we say cooling, we’re talking about a market that has been scorching hot which is why we are pleased to see this happening.”
There were 1,131 new listings added to the MLS® System in KW and area last month, a decrease 16.8 per cent compared to the record topping number of listings added in March of last year, and a 28.0 per cent increase compared to the previous ten-year average for March.
The total number of homes available for sale in active status at the end of March was 441, an increase of 1.1 per cent compared to March of last year, and 59.0 per cent below the previous ten-year average of 1,072 listings for March.
The number of months of inventory nudged up to 0.7 months in March from 0.5 months in February. Inventory has been under the one-month mark since October 2020. The number of months of inventory represents how long it would take to sell off current inventories at the current rate of sales.
The average number of days to sell in March was 8 days, the same as it was in March 2021. The previous 5-year average is 16 days.
The More Homes for Everyone Act
Statement from KWAR President Megan Bell
Last week the Government of Ontario introduced a new bill, the More Homes for Everyone Act to address the province’s housing affordability crisis.
While we welcome several aspects of the proposed More Homes for Everyone bill, such as measures to support more timely municipal decision making and developing policies and tools to support multi-generational homes in existing neighbourhoods—bolder actions to increase supply were notably missing.
Ontario’s Housing Affordability Task Force had recommended limiting exclusionary zoning and allowing “as of right” residential housing up to four units and up to four storeys on a single residential lot. Instead, the government has committed to the Task Force’s recommendations as part of a “long term roadmap”.
KWAR is optimistic Waterloo Region will be bold about housing in their official plan update
Ending exclusionary zoning to allow for gentle density in our neighbourhoods is critical to filling the lack of “missing middle” supply for family-sized households.
While Minister Clark states that some municipalities (such as Toronto and Mississauga) were not ready, KWAR is optimistic that the Region of Waterloo (ROW) will take a more progressive view toward increasing density. On the development side, the Waterloo region has been exceeding density targets set by the province. At KWAR’s recently held Where Do We Grow From Here Symposium we learned from the ROW’s Commissioner, Rod Regier the Region is proposing policies for the ROW official plan that would see a tiered approach to missing middle housing by allowing 4 units and up to 4 storeys, as-of-right, on all land currently zoned residential and on any new greenfield land (residential); and allow a range of 8 to 12 storeys, along specific corridors, such as the ION corridor.
KWAR encourages the Region of Waterloo to stay the course on its bold proposals for its Regional Official Plan and create ways to bring a broad range of housing options to our community.
Those requiring specific information on property values should contact a local REALTOR®. Working with a Realtor is the best way to get a complete picture of the property and community you are considering.
View our HPI tool here to learn more: https://kwar.ca/hpi-dashboard
Historical Sales By Property Type

Months Supply of Homes for Sale

Historical Median Sales Price – By Property Type

Historical Average Sales Price – By Property Type

Average Days on Market Chart

KWAR cautions that average sale price information can be useful in establishing long term trends but should not be used as an indicator that specific properties have increased or decreased in value. The average sale price is calculated based on the total dollar volume of all properties sold. Months Supply is the inventory of homes for sale at the end of a given month, divided by the average monthly closed sales from the last 12 months Those requiring specific information on property values should contact a local REALTOR®. REALTORS® have their fingers on the pulse of the market. They know the questions to ask, the areas to probe and what to look for so that you get a complete picture of the property and community you’re considering.
Tags: buyers, for sale, home, home sales, Homes For Sale, kitchener, Kitchener Buyers, kitchener for sale, Kitchener Homes, kitchener real estate, kitchener realtor, kitchener-waterloo, kitchener-waterloo association of realtors, KW Real Estate, Market Update, real estate market, Riz Sells KW, Royal Lepage Wolle Realty, Waterloo Sellers
Posted in Kitchener Buyers, Kitchener Sellers, Market Stats, Market Update, Real Estate News, Realtor Tips, Uncategorized, Waterloo Buyers, Waterloo Sellers | Comments Off on Kitchener-Waterloo Market Snapshot March 2022
Wednesday, January 5th, 2022
Average Price of a Detached Home Reaches Million-dollar Milestone in December
HOME SALES IN 2021 SMASHED LAST YEAR’S RECORD-BREAKING TOTAL BY OVER 1000 UNITS
The 7,581 residential homes sold through the Multiple Listing System (MLS® System) of the Kitchener-Waterloo Association of REALTORS® (KWAR) in 2021 represent an increase of 18.3 per cent compared to last year’s record-setting number of sales that ended the year 2020.
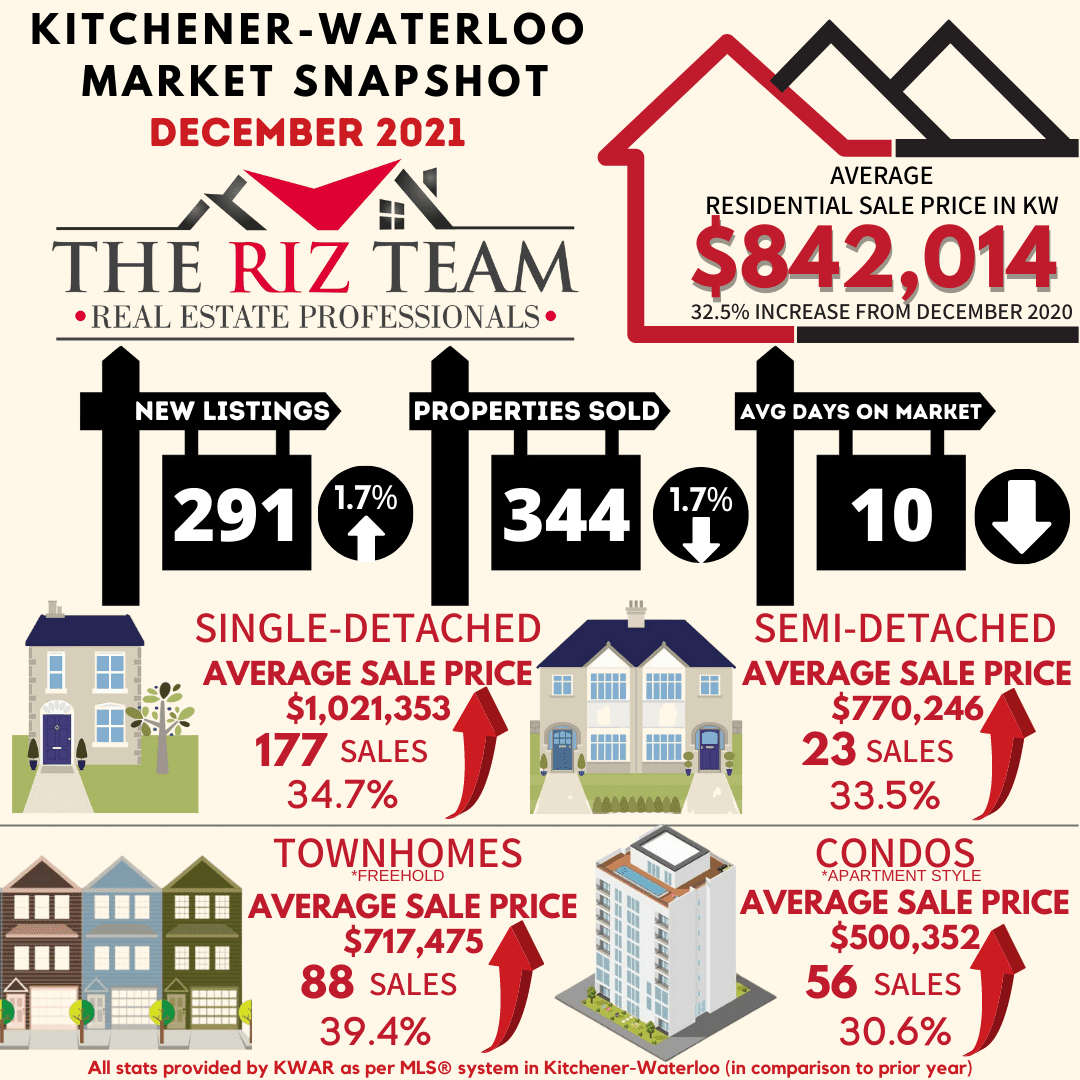
On a monthly basis, there were 344 residential homes sold last month, a decrease of 1.7 percent compared to the same month last year.
“Home sales in 2021 have absolutely smashed last year’s record by more than 1,000 units,” says KWAR’s president, Megan Bell. “While this is a good time to sell your home, it remains a tremendously difficult market for buyers. Affordability for all types of housing within our community continues to be a concern which we expect to continue throughout 2022.”
Total residential sales in December included 177 detached (down 12.4 per cent from December 2020), and 56 condominium units (down 11.1 per cent). Sales also included 23 semi-detached homes (up 9.5 per cent) and 88 townhouses (up 37.5 per cent).
For 2021, total residential sales included 4,272 detached (up 10.8 per cent), and 1,127 condominium units (up 43.4 per cent). Sales also included 578 semi-detached homes (up 31.1 per cent) and 1,602 townhouses (up 20.9 per cent).
In December, the average sale price for all residential properties in the Kitchener-Waterloo area was $842,014. This represents a 32.5 per cent increase over December 2020 and a 2.5 per cent increase compared to November 2021.
- The average price of a detached home was $1,021,353. This represents a 34.7 per cent increase from December 2020 and an increase of 3.4 per cent compared to November 2021.
- The average sale price for an apartment-style condominium was $500,352. This represents an increase of 30.6 per cent from December 2020 and an increase of 1.0 per cent compared to November 2021.
- The average sale price for a townhouse was $717,475. This represents a 39.4 per cent increase from December 2020 and an increase of 2.1 per cent compared to November 2021.
- The average sale price for a semi was $770,246. This represents an increase of 33.5 per cent compared to December 2020 and an increase 7.3 per cent compared to November 2021.
On a year-to-date basis, the average sale price for all residential properties in the Kitchener-Waterloo area increased 25.8 per cent to $770,596 compared to 2020.
- The year-to-date average price of a detached home was $920,726. This represents a 28.0 per cent increase compared to 2020.
- The year-to-date average sale price for an apartment-style condominium was $448,208. This represents an increase of 17.3 compared to 2020
- The year-to-date average sale price for a townhouse was $632,875. This represents an increase of 34.9 per cent compared to 2020.
- The year-to-date average sale price for a semi was $673,543. This represents an increase of 29.4 per cent compared to 2020.

KWAR cautions that average sale price information can be useful in establishing long-term trends but should not be used as an indicator that specific properties have increased or decreased in value. The MLS® Home Price Index (HPI) provides the best way to gauge price trends because averages are strongly distorted by changes in the mix of sales activity from one month to the next.
The MLS® HPI composite benchmark price for all residential properties in Kitchener-Waterloo was $851,700 in December. This represents a 32.1 per cent increase over December 2020 and a 3.2 per cent increase compared to November 2021.
- The benchmark price for a detached home was $945,600. This represents a 33.5 per cent increase from December 2020 and 3.3 per cent increase compared to November 2021.
- The benchmark price for an apartment-style condominium was $412,700. This represents a 21.1 per cent increase from December 2020 and a 3.7 per cent increase compared to November 2021.
- The benchmark price for a townhouse is $647,000. This represents a 40.0 per cent increase from December 2020 and a 3.0 per cent increase compared to November 2021.

There were 291 new listings added to the MLS® System in KW and area last month, an increase of 1.7 per cent compared to December of last year, and a 14.6 per cent increase compared to the previous ten-year average for December.
On a year-to-date basis, there were 9,040 new listings added to the MLS® System in KW and area in 2021, an increase of 11.5 per cent compared to 2020, and a 3.8 per cent increase compared to the previous ten-year annual average.
The total number of homes available for sale in active status at the end of December was 104, a decrease of 45.3 per cent compared to December of last year, and 85.7 per cent below the previous ten-year average of 727 listings for December.
The number of months of inventory touched an all time low of 0.2 in December. Inventory has settled at under 1 month for fourteen consecutive months. The number of months of inventory represents how long it would take to sell off current inventories at the current rate of sales.
“Supply not keeping up with demand was a steady refrain in 2021, and unfortunately I expect that will continue to be the case in the year ahead,” says Bell. “We need all levels of government working together to bring more supply into the housing market.”
The average number of days to sell in December stayed at 10 days, compared to 16 days in December 2020 and a previous 5-year average of 28 days.
The average days to sell in 2021 was 10 days, compared to 16 days in 2020 and a previous 5-year average of 22 days.
Those requiring specific information on property values should contact a local REALTOR®. Working with a Realtor is the best way to get a complete picture of the property and community you are considering.
View our HPI tool here to learn more: https://kwar.ca/hpi-dashboard
Historical Sales By Property Type

Months Supply of Homes for Sale

Historical Median Sales Price – By Property Type

Historical Average Sales Price – By Property Type

Average Days on Market

KWAR cautions that average sale price information can be useful in establishing long term trends but should not be used as an indicator that specific properties have increased or decreased in value. The average sale price is calculated based on the total dollar volume of all properties sold. Months Supply is the inventory of homes for sale at the end of a given month, divided by the average monthly closed sales from the last 12 months Those requiring specific information on property values should contact a local REALTOR®. REALTORS® have their fingers on the pulse of the market. They know the questions to ask, the areas to probe and what to look for so that you get a complete picture of the property and community you’re considering.
Tags: Homes For Sale, Kitchener Buyers, kitchener real estate, kitchener realtor, kitchener-waterloo, KW Market Update, real estate market, Royal Lepage Wolle Realty, the riz team, waterloo, Waterloo Homes, waterloo realtor, Waterloo Sellers
Posted in Kitchener Buyers, Kitchener Sellers, Market Stats, Market Update, Real Estate News, Realtor Tips, Waterloo Buyers, Waterloo Sellers | Comments Off on Kitchener-Waterloo Market Snapshot December 2021
Wednesday, May 5th, 2021
NUMBER OF HOME SALES IN APRIL SECOND HIGHEST ON RECORD
KITCHENER-WATERLOO, ON (May 5, 2021) –– Following last month’s record-smashing number of home sales, the Kitchener-Waterloo Association of REALTORS® (KWAR) posted the second-highest number of monthly home sales in April. There were 843 residential homes sold through the Multiple Listing Service® (MLS® System) of KWAR last month, an increase of 263.4 per cent compared to April 2020, and a decrease of 15.5 per cent compared to March 2021.
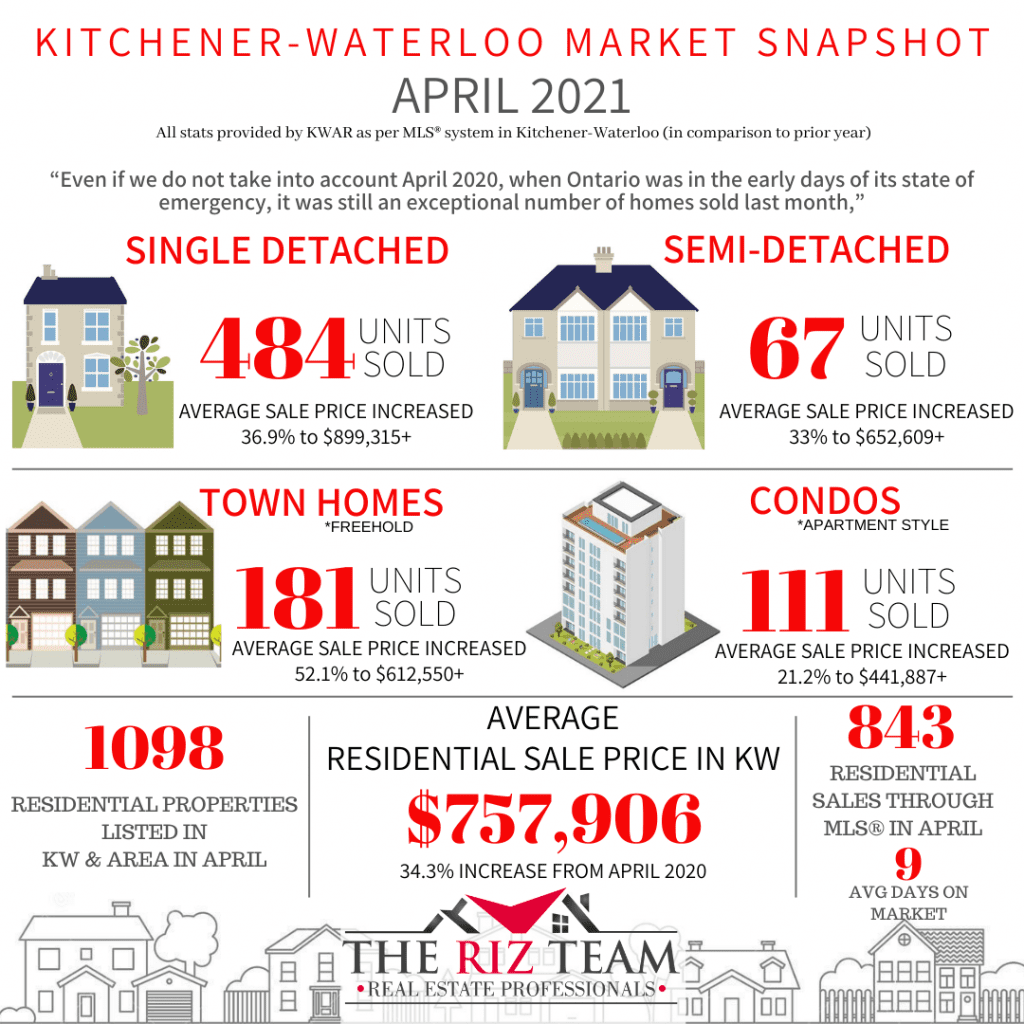
“Even if we do not take into account April 2020, when Ontario was in the early days of its state of emergency, it was still an exceptional number of homes sold last month,” says Nicole Pohl, President of KWAR. “The previous 10-year average number of residential sales for April was 618.”
Total residential sales in April included 484 detached (up 233.8 per cent from April 2020), and 111 condominium units (up 382.6 per cent). Sales also included 67 semi-detached homes (up 294.1 per cent) and 181 townhouses (up 285.1 per cent).
In April, the average sale price for all residential properties in the Kitchener-Waterloo area was $757,906. This represents a 34.3 per cent increase over April 2020 and a 0.9 per cent decrease compared to March 2021.
-
-
- The average price of a detached home was $899,315. This represents a 36.9 per cent increase from April 2020 and an increase of 0.04 per cent compared to March 2021.
-
-
- The average sale price for an apartment-style condominium was $441,887. This represents an increase of 21.2 per cent from April 2020 and an increase of 4.2 per cent compared to March 2021.
-
-
- The average sale price for a townhouse was $612,550. This represents a 52.1 per cent increase from April 2020 and a decrease of 2.03 per cent compared to March 2021.
-
-
- The average sale price for a semi was $652,609. This represents an increase of 33.0 per cent compared to April 2020 and an increase of 0.18 per cent compared to March 2021.
“We are starting to see home prices calm down in March and April compared to what was happening in January and February,” says Pohl.

KWAR cautions that average sale price information can be useful in establishing long-term trends but should not be used as an indicator that specific properties have increased or decreased in value. The MLS® Home Price Index (HPI) provides the best way to gauge price trends because averages are strongly distorted by changes in the mix of sales activity from one month to the next.
The MLS® HPI composite benchmark price for all residential properties in Kitchener-Waterloo was $742,800 in April. This represents a 40.4 per cent increase over April 2020 and a 0.6 per cent increase compared to March 2021.
-
-
- The benchmark price for a detached home was $809,000. This represents a 39.9 per cent increase from April 2020 and 1.0 per cent decrease compared to March 2021.
-
- The benchmark price for an apartment-style condominium was $374,100. This represents a 31.1 per cent increase from April 2020 and a 4.3 per cent increase compared to March 2021.
-
- The benchmark price for a townhouse is $591,300. This represents a 47.2 per cent increase from April 2020 and a 6.6 per cent increase compared to March 2021.

There were 1,098 new listings added to the MLS® System in KW and area last month, an increase of 162.7 per cent compared to April of last year, and a 17.15 per cent increase compared to the previous ten-year average for April* (*calculated from 2019 to 2010 to adjust for the impact of the state of emergency on activity in April 2020).
The total number of homes available for sale in active status at the end of April was 458, a decrease of 21.8 per cent compared to April of last year, and 66.9 per cent below the previous ten-year average of 1,384 listings for April* (*calculated from 2010 to 2019 to adjust for the impact of the state of emergency on activity in April 2020).
The number of months of inventory was 0.7 in April, which is unchanged from March. Inventory has numbered less than 1 month since October. The number of months of inventory represents how long it would take to sell off current inventories at the current rate of sales.
The average number of days to sell in April was 9 days, compared to 19 days in April 2020 and a previous 5-year average of 21 days.
Those requiring specific information on property values should contact a local REALTOR®. Working with a Realtor is the best way to get a complete picture of the property and community you are considering.
View our HPI tool here to learn more: https://kwar.ca/hpi-dashboard
Historical Sales By Property Type

Months Supply of Homes for Sale

Historical Median Sales Price – By Property Type

Historical Average Sales Price – By Property Type

Average Days on Market Chart

Tags: buyers, for sale, home sales, kitchener, Kitchener Homes, kitchener realtor, kitchener-waterloo, kitchener-waterloo association of realtors, KW Market Update, real estate market, Royal Lepage Wolle Realty, Waterloo Homes
Posted in Kitchener Buyers, Kitchener Sellers, Market Stats, Market Update, Waterloo Buyers, Waterloo Sellers | Comments Off on Kitchener-Waterloo Market Snapshot April 2021
Friday, April 3rd, 2020
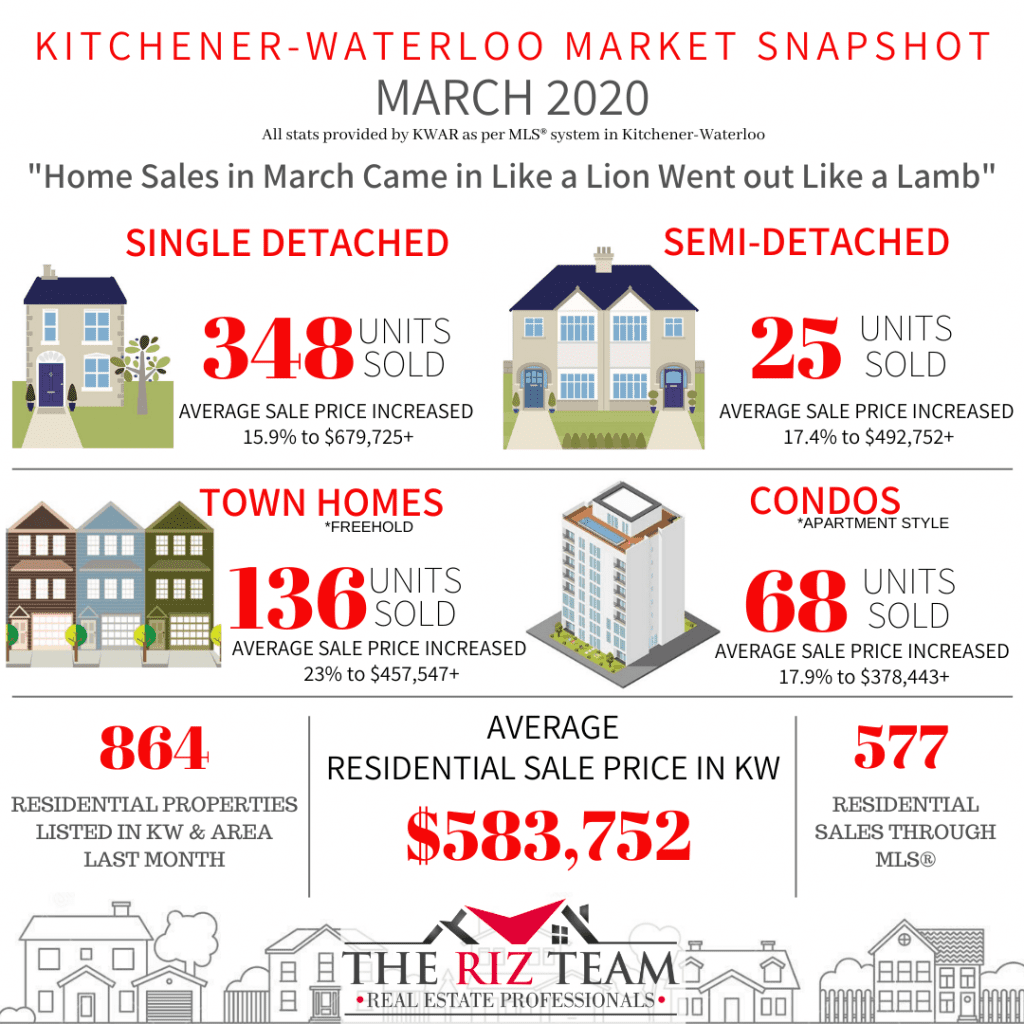
Home Sales in March Came in Like a Lion Went out Like a Lamb
KITCHENER-WATERLOO, ON (April 3, 2020) ––There were 577 residential homes sold through the Multiple Listing System (MLS® System) of the Kitchener-Waterloo Association of REALTORS® in March, an increase of 13.1 per cent compared to the same month last year, and 0.2 per cent below the previous 5-year average.
“We had a very strong start to the month which carried through right up until the province declared its COVID-19 related state of emergency on March 17th,” says Colleen Koehler, President of KWAR. “Before the pandemic hit our region, I believe we were on pace to set a record number of sales for March with the continuance of high demand, low inventory, and a strong seller’s market.
During the first quarter of 2020, there were 1,327 home sales, 14.6 per cent above last year’s result for the same period and 4 per cent above the previous 5-year average.
Total residential sales in March included 348 detached homes (up 7.1 per cent), and 68 condominium apartments (up 5.1 per cent). Sales also included 136 townhouses (up 17.2 per cent) and 25 semi-detached homes (up 4.2 per cent).
The average sale price of all residential properties sold in March increased 15.3 per cent to $583,752 compared to the same month last year, while detached homes sold for an average price of $679,728 an increase of 15.9 per cent. During this same period, the average sale price for an apartment-style condominium was $378,443 for an increase of 17.9 per cent. Townhomes and semis sold for an average of $457,547 (up 23 per cent) and $492,752 (up 17.4 per cent) respectively.
The median price of all residential properties sold in March increased 14.6 per cent to $544,500 and the median price of a detached home during the same period increased 16.2 per cent to $628,500.
“Of course, what is on everyone’s mind is the Coronavirus, and how this global pandemic is impacting every facet of our lives. The Ontario government included real estate services, legal and land registry as an essential service, but by no means is this business as usual for Realtors or their clients,” says Koehler. “As people everywhere follow instructions to only leave their homes for essential reasons, this is impacting the number of showings, and how properties are shown. Not everyone is in the position to postpone the purchase or sale of their home, and Realtors are adapting the technology we already use to serve our clients in this new environment and rigidly following Health Canada’s guidelines.”
REALTORS® listed a higher than average number of homes during the Month of March. There were 864 new listings added to the MLS® System in KW and area last month, an increase of 7.6 per cent compared to March of 2019, and the greatest number since 2015. The number of new residential listings was also 3.7 per cent higher than the previous ten-year average for March.
The total number of homes available for sale in active status at the end of March was 535, a decrease of 35.9 per cent compared to March of last year.
Despite the much-needed addition of new inventory coming to the market, the number of Months Supply (also known as absorption rate) continues to be very low at just 1.1 months for the month of March, 35.3 per cent below the same period last year. The previous ten-year average supply of homes for March was 2.73 months, and in the past 5 years, the average supply for March was 1.94 months.
KWAR’s president wishes to emphasize that while real estate continues to be an essential service in Ontario, consumers can expect that a REALTOR® will be taking all the necessary protections to ensure we’re doing our part to flatten the curve.
Koehler notes last month 51 listings were suspended on KWAR’s MLS® System, which means the listing is temporarily “off-market,” and there can be no marketing showings or offers during this period. KWAR’s president encourages buyers and sellers to discuss the current situation with their REALTOR®, to find out what they are doing to ensure the safety of everyone involved in the transaction and to make the best and safest decision on how to move forward or hold your real estate decisions during this unprecedented time.
Trying to sell your home while in quarantine, self-isolating or worse yet, while someone in the house is sick, is not going to be in anyone’s best interest. We know many people are postponing their plans to list their home for the time being.
The average days to sell in March was 15 days, compared to 21 days in March 2019.
Media Contact: Tania Benninger, Stakeholder Relations, 519-584-1141
Read Online: https://kwar.ca/home-sales-march-2020
Historical Sales By Property Type

Months Supply of Homes for Sale

Tags: buyers, for sale, home sales, Homes For Sale, house, housing, Kitchener Buyers, kitchener for sale, kitchener realtor, kitchener-waterloo, kitchener-waterloo association of realtors, KW Market Update, KW Real Estate, real estate, realtor, riz jadavji, Royal Lepage Wolle Realty, sales representative, the riz team, waterloo, Waterloo Buyers, Waterloo Homes, waterloo realtor
Posted in Market Stats, Market Update | Comments Off on Kitchener Market Snapshot for March 2020
Monday, July 27th, 2015
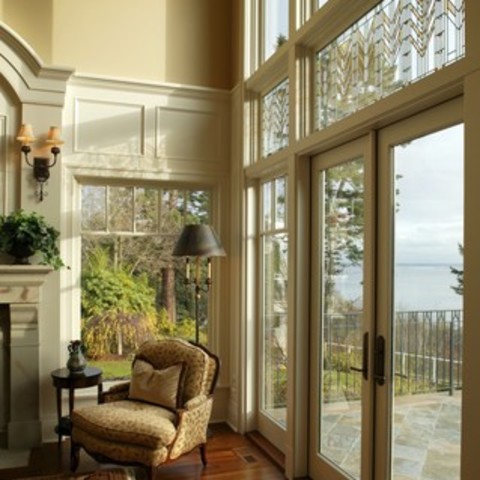 Screen doors let the breeze in and keep the bugs out. They open your home to the sounds and scents of summer, and help cool your house without wasting energy on air conditioning. Want to let in a little more summer this year? Here’s what you need to know about picking the perfect door.
Screen doors have come a long way from the hard-to-open metal models and flapping wood doors of your childhood. Available in metal, vinyl or wood, many feature smooth hydraulic or pneumatic closers and springs or chain stops that keep them from slamming shut or swinging open. Designed for both practicality and curb appeal, doors are available in a wide variety of colours, styles and finishes. Your choices include:
1. Basic vinyl or aluminum. Durable and affordable, these doors come in a surprising variety of attractive styles; you’ll find everything from traditional designs to art deco-inspired geometrics.
2. Storm/screen door combo. Traditionally, people replace the screen door with a storm door in the winter. A combination door makes the “swap” easier; simply remove or slide the glass down in summer and replace it with a screen.
3. Wood. From rustic doors featuring carved animals to pretty “granny doors,” wood can really add to the look of your home. However, winter cold and damp can be hard on them, so manufacturers suggest that you take them down when it gets cold to prevent warping.
4. Sliding. Inexpensive and easy to maintain, sliding screen doors that go with patio doors make it easy to open up your home to a fresh breeze.
5. Retractable screens. If you don’t like the look of a screen door, these are a great option, and are available at your local home improvement store. Screens pull out from the sides and lock shut with a magnetic catch. Handy homeowners will be able to install them with little effort.
With the right screen door for your home, comfort and curb appeal are a breeze!
Tips for installation
Thinking about installing your screen door yourself? Manufacturers include installation instructions that only require hand tools, but most DIY resources suggest an intermediate level of “handiness.” If that doesn’t sound like you, consider using an experienced carpenter or the store’s installation service.
Condo Cool
You don’t have to live in a house to kick back and enjoy the breeze. Welcome summer into your space by installing a screen door to your balcony. It’s a great way to make your indoor and outdoor spaces feel unified and to make your condo feel more spacious.
Tags: buyers, for sale, home sales, Homes For Sale, kitchener, Kitchener Buyers, kitchener for sale, Kitchener Homes, kitchener real estate, kitchener realtor, kitchener-waterloo, kitchener-waterloo association of realtors, riz jadavji, Riz Sells KW, rizsellskw, rizsellskw.com, royal lepage, Royal Lepage Wolle Realty, Waterloo Buyers, waterloo for sale, Waterloo Homes, waterloo real estate, waterloo realtor, Waterloo Sellers, www.rizsellskw.com
Posted in Enhance Your Home, For Sale, From The Riz Team, Kitchener Buyers, Kitchener Sellers, Realtor Tips, Uncategorized, Waterloo Buyers, Waterloo Sellers | Comments Off on Screen Door Decor
Tuesday, July 7th, 2015
What goes under foot is seldom an easy decision. Colour, surface texture, room usage and price all come into play. Today, greener options abound, adding to the myriad of choices already available.
Increasing interest in incorporating renewable resources into the home has resulted in many beautiful eco-friendly flooring options.
For homeowners looking on the greener side, it’s worth a look at the many sustainable products available today:
• Give a tree another lease on life with salvaged wood flooring. A rustic look can be created with reclaimed wood. Buying reclaimed lumber continues to get easier, and in some instances, less expensive relative to the cost of new hardwoods.
• Bamboo is a good option for rooms with low humidity. High abundance and a natural look make sustainable bamboo an attractive flooring option. Bamboo grows to maturity in three to five years, about a quarter of the time it takes to grow trees used for hardwood.
• Linoleum flooring has retained its popularity over decades. Unlike vinyl flooring, which is a synthetic product made of chlorinated petrochemicals, linoleum is manufactured from natural compounds including linseed oil, cork dust, tree resins and ground limestone. With natural, renewable elements used in its manufacturing, this eco-friendly flooring option continues to remain a popular option.
• Cork flooring has many eco-friendly attributes. Like bamboo, cork is quickly renewable. It is harvested from the bark of the cork oak tree and grows back every three years. Cork has anti-microbial properties to reduce allergens, is fire retardant and provides a comfortable feel under foot. Cork flooring can be finished in a variety of paints and stains to complement any room setting.
• Polyester (P.E.T.) Berber carpet is a sustainable option made of recycled plastic bottles. Anytime we can reuse these materials, we reduce the amount of new materials being manufactured and we reduce non-biodegradable materials in our landfills. Polyester Berber is spill resistant and comes in a variety of aesthetically – pleasing colours and patterns.
Whatever your home’s style or design, an eco-friendly flooring option exists to complement the desired look and existing patterns.
Tags: buyers, easy home improvement tips, for sale, home, home sales, home staging, Homes For Sale, house, housing, kitchener, Kitchener Buyers, kitchener for sale, Kitchener Homes, kitchener real estate, kitchener realtor, Kitchener Sellers, kitchener-waterloo, kitchener-waterloo association of realtors, kw, MLS, preparing to sell, real estate, real estate market, realtor, riz jadavji, Riz Sells KW, rizsellskw.com, royal lepage, Royal Lepage Wolle Realty, seller's tips, waterloo, waterloo real estate, waterloo realtor, Waterloo Sellers, www.rizsellskw.com
Posted in Enhance Your Home, For Sale, From The Riz Team, Kitchener Buyers, Kitchener Sellers, Real Estate Listings, Real Estate News, Realtor Tips, Uncategorized, Waterloo Buyers, Waterloo Sellers | Comments Off on Flooring choices on the greener side!


