Posts Tagged ‘Kitchener Buyers’
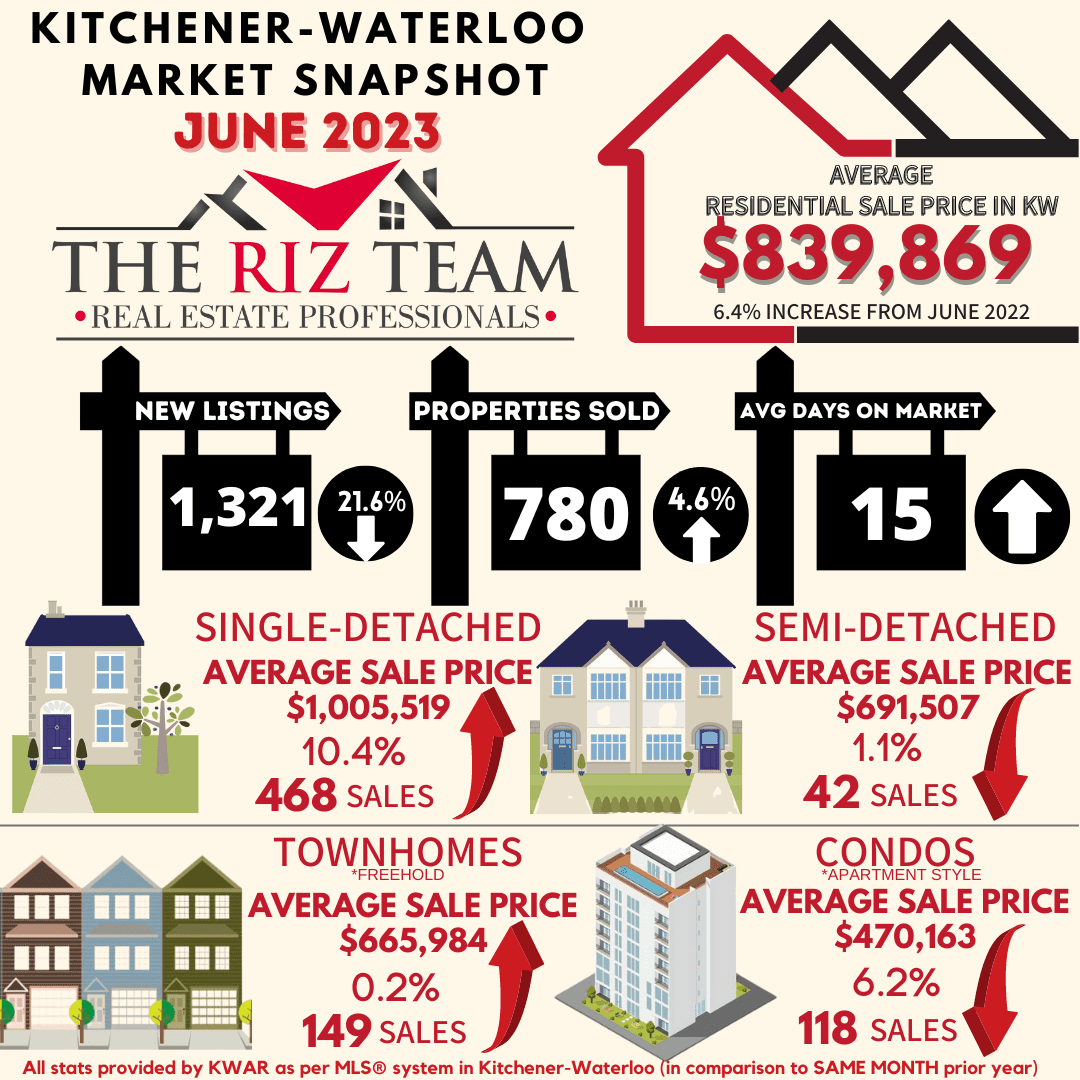
Thursday, July 6th, 2023
Waterloo Region Real Estate Market Shows Resilience With Increase in Home Sales and Average Prices
If you are considering to Sell your home or Buy a home in the next short while it would be highly beneficial for you to connect with one of our Team Agents at
Do you want to know what your home is worth today? Click Below for our Online No Obligation Market Evaluation
Tags: buyers, for sale, Homes For Sale, Kitchener Buyers, kitchener real estate, kitchener-waterloo, Market Update, real estate market, sales representative, sellers, the riz team, waterloo for sale, Waterloo Homes, Waterloo Sellers
Posted in Kitchener Buyers, Kitchener Sellers, Market Stats, Market Update, Real Estate News, Waterloo Buyers, Waterloo Sellers | Comments Off on Kitchener Waterloo Market Snapshot June 2023
Thursday, May 4th, 2023
Demand Remains Strong as Home Prices Increase Month-Over-Month
If you are considering to Sell your home or Buy a home in the next short while it would be highly beneficial for you to connect with one of our Team Agents at
Do you want to know what your home is worth today? Click Below for our Online No Obligation Market Evaluation
Tags: buyers, for sale, Homes For Sale, Kitchener Buyers, kitchener-waterloo, kitchener-waterloo association of realtors, KW Market Update, realtor, Royal Lepage Wolle Realty, the riz team, waterloo, waterloo real estate, waterloo realtor, Waterloo Sellers
Posted in Kitchener Buyers, Kitchener Sellers, Market Stats, Market Update, Real Estate News, Waterloo Buyers, Waterloo Sellers | Comments Off on Kitchener Waterloo Market Snapshot April 2023
Friday, March 3rd, 2023
Home Sales Down, Prices Stabilizing in February
If you are considering to Sell your home or Buy a home in the next short while it would be highly beneficial for you to connect with one of our Team Agents at
Do you want to know what your home is worth today? Click Below for our Online No Obligation Market Evaluation
Tags: buyers, Kitchener Buyers, Kitchener Sellers, kitchener-waterloo, Market Update, real estate market, riz jadavji, royal lepage, Royal Lepage Wolle Realty, the riz team, Waterloo Buyers, waterloo real estate, Waterloo Sellers
Posted in Kitchener Buyers, Kitchener Sellers, Market Stats, Market Update, Real Estate News, Realtor Tips, Waterloo Buyers, Waterloo Sellers | Comments Off on Kitchener Waterloo Market Snapshot February 2023
Friday, February 3rd, 2023
Number of Home Sales in January Exceptionally Low
If you are considering to Sell your home or Buy a home in the next short while it would be highly beneficial for you to connect with one of our Team Agents at
Do you want to know what your home is worth today? Click Below for our Online No Obligation Market Evaluation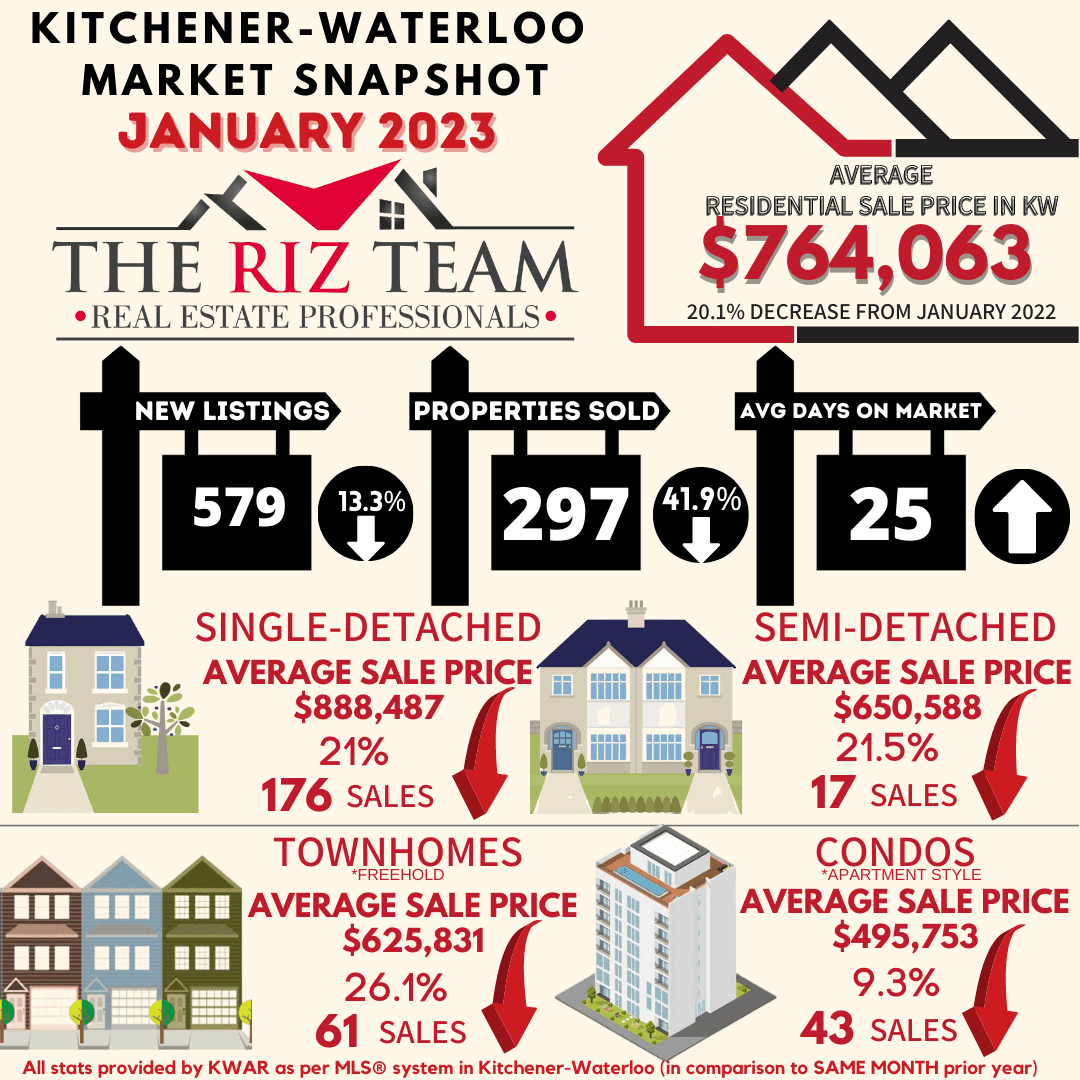
“On a monthly basis, we saw the average sale price increase across all property types in January,” says Bell. “I’m also noticing more multiple offers happening, especially on detached homes that are priced under eight hundred thousand dollars.”
Meanwhile, the Bank of Canada again increased interest rates at the end of January by 25 basis points to 4.5 per cent. “While not a huge increase, the continuance of interest rate hikes is an ongoing factor in the reduction of home sales within the market,” says Bell.
There were 579 new listings added to the MLS® System in Waterloo Region last month, a decrease of 13.3 per cent compared to January of last year and a 28.7 per cent decrease compared to the previous ten-year average for January.
The total number of homes available for sale in active status at the end of January was 651, an increase of 167.9 per cent compared to January of last year and 34.7 per cent below the previous ten-year average of 998 listings for January.
The number of months of inventory is up 233.3 per cent compared to January of last year, but still historically low at one month. Between 2011 and 2015, January’s average months of inventory was 3.0 months. The number of months of inventory represents how long it would take to sell off current inventories at the current sales rate.
The average number of days to sell in January was 25, compared to 9 days in January 2022. The previous 5-year average is 21 days.
WRAR’s president says, “The demographic of buyers is also shifting as we observe fewer buyers coming from the GTA into the region. While there are still some, it is nowhere like it was last January. These and other shifting influences mean it has never been more important for buyers and sellers to work with a local REALTOR® to help provide expertise during the homebuying and selling process.”
Affordability, combined with ongoing supply constraints, makes it difficult for buyers to navigate the continuous market changes while sellers also need to adjust to the evolving circumstances. Those requiring specific information on property values should contact a local REALTOR®. Working with a Realtor is the best way to get a complete picture of the property and community you are considering.
View our HPI tool here to learn more: https://wrar.ca/hpi/
Tags: buyers, for sale, Homes For Sale, Kitchener Buyers, kitchener for sale, kitchener real estate, Kitchener Sellers, kitchener-waterloo, KW Market Update, KW Real Estate, real estate, Royal Lepage Wolle Realty, Waterloo Sellers
Posted in Kitchener Buyers, Kitchener Sellers, Market Stats, Market Update, Real Estate News, Realtor Tips, Waterloo Buyers, Waterloo Sellers | Comments Off on Kitchener Waterloo Market Snapshot January 2023
Thursday, January 5th, 2023
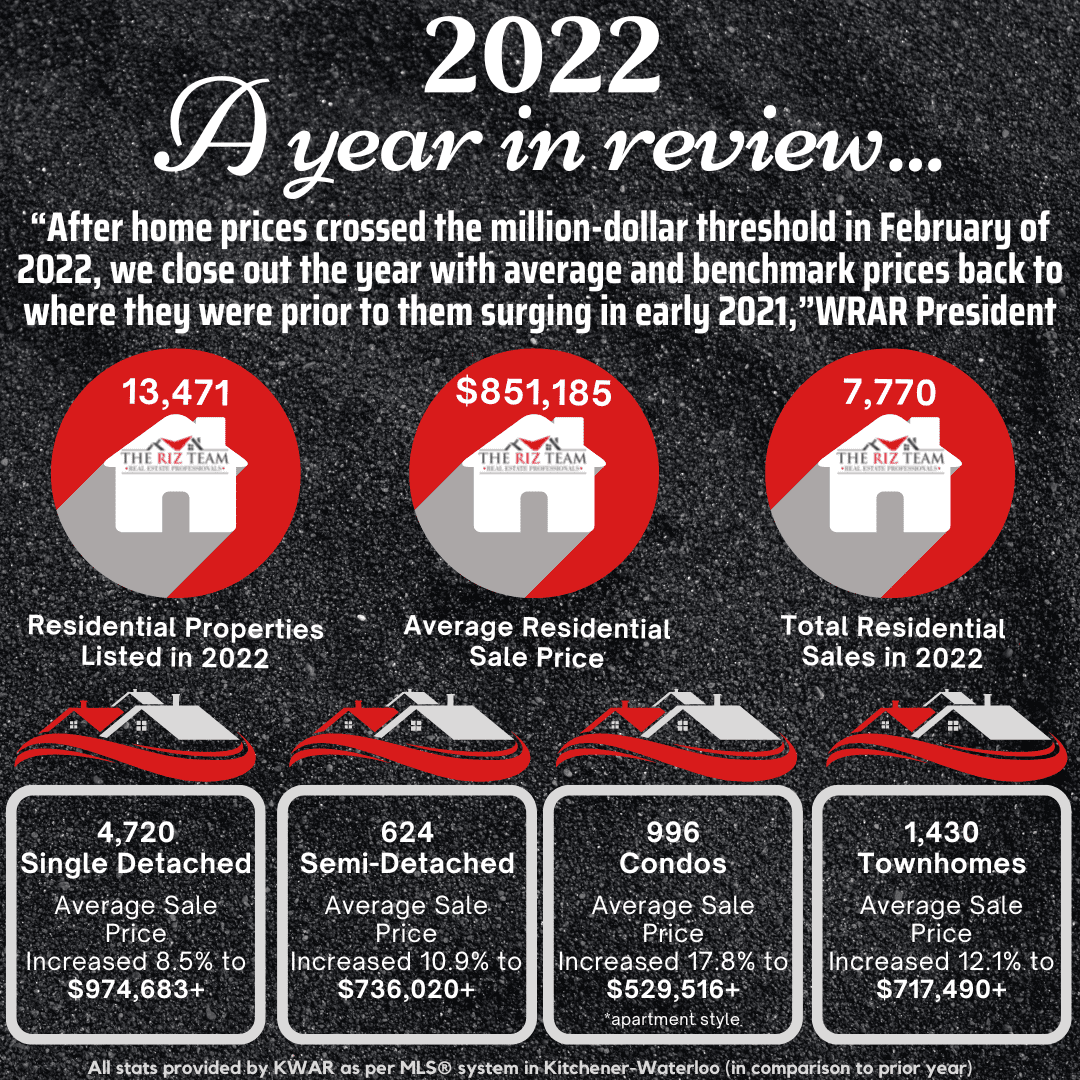
Fewer Homes Sales in December Ends a Year of Weaker Sales Activity in Waterloo Region
If you are considering to Sell your home or Buy a home in the next short while it would be highly beneficial for you to connect with one of our Team Agents at
Do you want to know what your home is worth today? Click Below for our Online No Obligation Market Evaluation
WATERLOO REGION, ON (January 5, 2023) —There were 7,770 homes sold through the Multiple Listing Service® (MLS®) System of the Waterloo Region Association of REALTORS® (WRAR) in 2022, a decrease of 24.8 per cent compared to 2021. On a historical basis, 2022 performed lower than previous years, with annual sales down 12.4 per cent compared to the previous 5-year average and 8.2 per cent below the previous 10-year average.
On a monthly basis, there were 280 homes sold in December, a decrease of 38.7 per cent compared to December 2021, and 32.3 per cent below the previous 5-year average for the month.
“The number of homes sold in December was lower than any single month in well over a decade, marking an end to a turbulent year for home sales in Waterloo Region,” says Megan Bell, President of WRAR.

Tags: buyers, first-time buyers, homes, Kitchener Buyers, kitchener real estate, Kitchener Sellers, kitchener-waterloo, Re/Max, Royal Lepage Wolle Realty, sellers, waterloo real estate, Waterloo Sellers, Zillow
Posted in Kitchener Buyers, Kitchener Sellers, Market Stats, Market Update, Real Estate News, Realtor Tips, Uncategorized, Waterloo Buyers, Waterloo Sellers | Comments Off on Kitchener Waterloo Market Snapshot & Yearly Summary December 2022
Friday, December 2nd, 2022
Waterloo Region Home Prices Continue to Cool in November
“Home sales continued to decrease in November, as they traditionally do at this time of year,” “At the same time, we know ever-increasing homeownership costs are contributing to the decline and putting downward pressure on sales prices which have plateaued since July.”
If you are considering to Sell your home or Buy a home in the next short while it would be highly beneficial for you to connect with one of our Team Agents at
Do you want to know what your home is worth today? Click Below for our Online No Obligation Market Evaluation

“The Waterloo Region market has been moving towards more of a balanced market throughout the latter part of the year, and November followed that trend,” says Bell. “We have a long way to go before the pendulum swings into it being a buyer’s market. However, if the Bank of Canada yet again raises its key interest rate on December 7, it is likely to result in fewer buyers competing for more inventory.”
There were 752 new listings added to the MLS® System in the Waterloo Region last month, a decrease of 6.6 per cent compared to November of last year and a 1.3 per cent increase compared to the previous ten-year average for November.
The total number of homes available for sale in active status at the end of November was 860, an increase of 209.4 per cent compared to November of last year and 29.9 per cent below the previous ten-year average of 1227 listings for November.
The number of months of inventory is up 333.3 per cent compared to November of last year, but still historically low at 1.3 months. Between 2009 and 2015, November’s average months of inventory was 3.2 months. The number of months of inventory represents how long it would take to sell off current inventories at the current sales rate.
The average number of days to sell in November was 21, compared to 10 days in November 2021. The previous 5-year average is 21 days.
WRAR’s president says, “It has never been more important for both buyers and sellers to work with a REALTOR® to help provide expertise during the homebuying and selling process. Affordability, combined with ongoing supply constraints, are making it difficult for buyers to navigate the continuous market changes while sellers are also having to adjust in concurrence with the evolving circumstances”.
Those requiring specific information on property values should contact a local REALTOR®. Working with a Realtor is the best way to get a complete picture of the property and community you are considering.
View our HPI tool here to learn more: https://wrar.ca/hpi/
Tags: buyers, for sale, Homes For Sale, Kitchener Buyers, kitchener for sale, kitchener real estate, kitchener-waterloo, kitchener-waterloo association of realtors, real estate market, Royal Lepage Wolle Realty, sales representative, Waterloo Buyers, waterloo real estate, waterloo realtor, Waterloo Sellers
Posted in Kitchener Buyers, Kitchener Sellers, Market Stats, Market Update, Real Estate News, Waterloo Buyers, Waterloo Sellers | Comments Off on Kitchener Waterloo Market Snapshot November 2022
Wednesday, October 5th, 2022
Fewer Home Sales in October
“Unsurprisingly, the pace of home sales continued to slow in October after the Bank of Canada’s sixth straight interest rate hike in September,” says Megan Bell, President of WRAR. “Faced with higher borrowing costs, some buyers have had to re-assess what they can afford. As these buyers get moved to the sidelines, sellers question if now is the best possible time to sell.”
If you are considering to Sell your home or Buy a home in the next short while it would be highly beneficial for you to connect with one of our Team Agents at
Do you want to know what your home is worth today? Click Below for our Online No Obligation Market Evaluation

Tags: buyers, kitchener, Kitchener Buyers, kitchener real estate, Kitchener Sellers, kitchener-waterloo, kitchener-waterloo association of realtors, KW Real Estate, Market Stats, real estate, rizsellskw.com, sellers, the riz team, TheRizTeam, waterloo real estate
Posted in Enhance Your Home, Kitchener Buyers, Kitchener Sellers, Market Stats, Market Update, Real Estate News, Realtor Tips, Uncategorized, Waterloo Buyers, Waterloo Sellers | Comments Off on Kitchener Waterloo Market Snapshot October 2022
Wednesday, September 7th, 2022
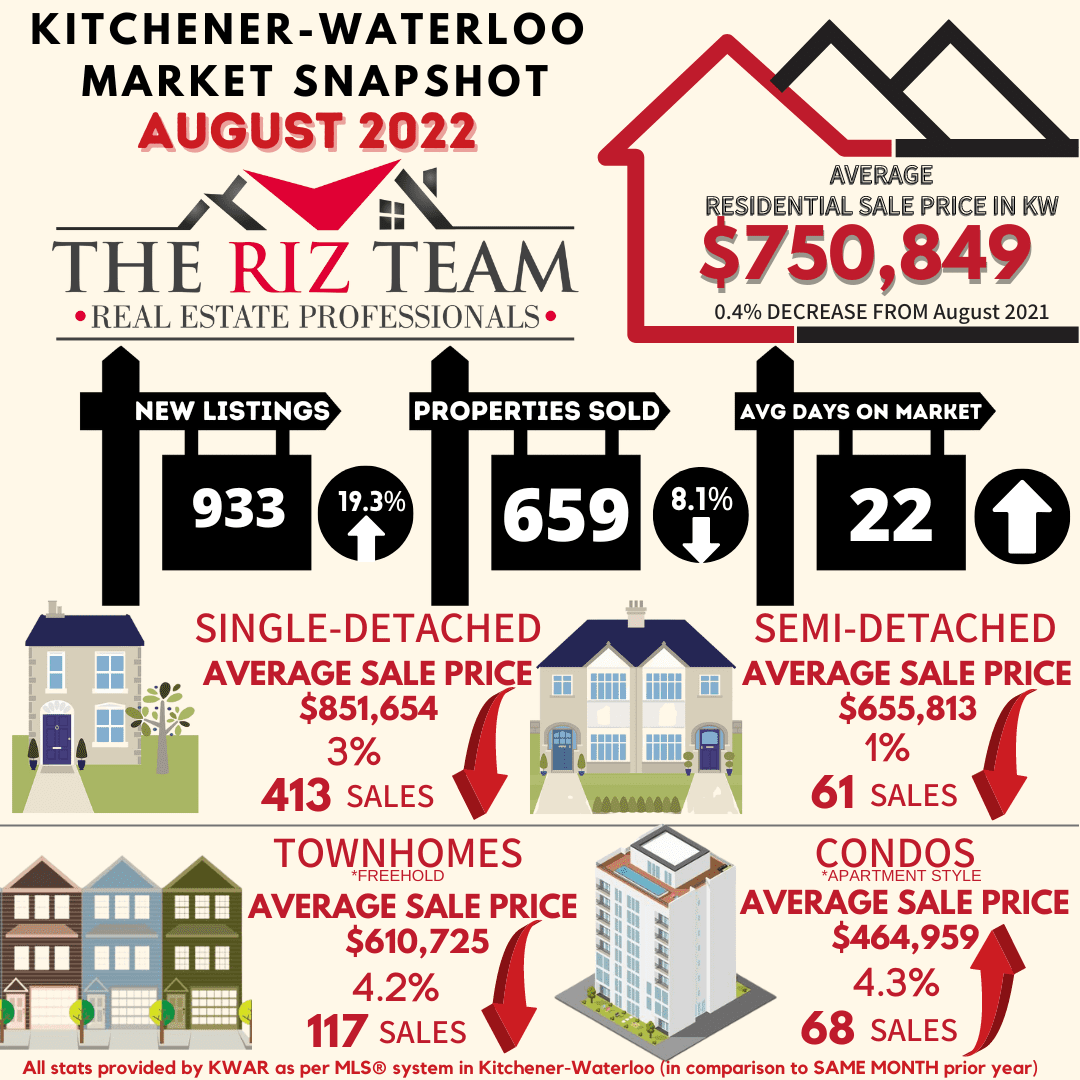
Rising Borrowing Costs Continue to Tame Home Sales in August
“The decline was most pronounced in the apartment-style condo and townhouse categories which could indicate that rising borrowing costs are having a greater impact on first-time buyers and those looking for more affordable options.”
If you are considering to Sell your home or Buy a home in the next short while it would be highly beneficial for you to connect with one of our Team Agents at
Do you want to know what your home is worth today? Click Below for our Online No Obligation Market Evaluation
Tags: buyers, kitchener, Kitchener Buyers, kitchener real estate, Kitchener Sellers, kitchener-waterloo, kitchener-waterloo association of realtors, KW Real Estate, Market Stats, real estate, rizsellskw.com, sellers, the riz team, TheRizTeam, waterloo real estate
Posted in Enhance Your Home, Kitchener Buyers, Kitchener Sellers, Market Stats, Market Update, Real Estate News, Realtor Tips, Uncategorized, Waterloo Buyers, Waterloo Sellers | Comments Off on Kitchener Waterloo Market Snapshot August 2022
Friday, August 5th, 2022
“In the wake of July’s interest rate hike, home sales in Waterloo Region continued to slow,” says Megan Bell, President of WRAR. “We’re seeing a clear shift in the market and what people can afford to purchase or are willing to pay. On the bright side for buyers, it’s not the extreme sellers’ market it was.”
If you are considering to Sell your home or Buy a home in the next short while it would be highly beneficial for you to connect with one of our Team Agents at
Do you want to know what your home is worth today? Click Below for our Online No Obligation Market Evaluation

WATERLOO REGION, ON (August 5, 2022) — 550 residential homes were sold through the Multiple Listing Service® (MLS®) System of the Waterloo Region Association of REALTORS® (WRAR) in July, a decrease of 32.8 per cent compared to July 2021, and 32.3 per cent below the previous 5-year average for the month.
Tags: buyers, kitchener, Kitchener Buyers, kitchener real estate, Kitchener Sellers, kitchener-waterloo, kitchener-waterloo association of realtors, KW Real Estate, Market Stats, real estate, rizsellskw.com, sellers, the riz team, TheRizTeam, waterloo real estate
Posted in Kitchener Buyers, Kitchener Sellers, Market Stats, Market Update, Real Estate News, Realtor Tips, Waterloo Buyers, Waterloo Sellers | Comments Off on Kitchener Waterloo Market Snapshot July 2022
Wednesday, July 6th, 2022
HOME PRICES CONTINUE TO DIP AS MONTHS SUPPLY RETURNS TO PRE-PANDEMIC LEVEL
If you are considering to Sell your home or Buy a home in the next short while it would be highly beneficial for you to connect with one of our Team Agents at
Do you want to know what your home is worth today? Click Below for our Online No Obligation Market Evaluation

The Riz Team monthly market stats June 2022. Kitchener Waterloo, ON.
There were 561 residential homes sold through the Multiple Listing Service® System (MLS® System) of the Kitchener-Waterloo Association of REALTORS® (KWAR) in June, a decrease of 24.0 per cent compared to the same month last year, and 17.3 per cent below the previous 5-year average. “For the fourth consecutive month we’re seeing home prices moderate as the number of properties available for sale has steadily increased” says Megan Bell, President of KWAR. “In June the average price of a detached home has levelled off to where it was this time last year.”
Total residential sales in June included 326 detached (down 20.7 per cent from June 2021), and 103 townhouses (down 32.2 per cent). Sales also included 84 condominium units (down 18.4 per cent) and 48 semi-detached homes (down 33.3 per cent).
In June, the average sale price for all residential properties in the Kitchener-Waterloo area was $791,674. This represents a 4.2 per cent increase over June 2021 and a 9.6 per cent decrease compared to May 2022.
- The average price of a detached home was $920,349. This represents a 0.0 per cent change from June 2021 and a decrease 9.5 per cent compared to May 2022.
- The average sale price for a townhouse was $662,305. This represents a 11.9 per cent increase from June 2021 and a decrease of 6.5 per cent compared to May 2022.
- The average sale price for an apartment-style condominium was $497,429. This represents an increase of 11.7 per cent from June 2021 and a decrease of 8.9 per cent compared to May 2022.
- The average sale price for a semi was $710,284. This represents an increase of 9.5 per cent compared to June 2021 and a decrease of 2.8 per cent compared to May 2022.

KWAR cautions that average sale price information can be useful in establishing long-term trends but should not be used as an indicator that specific properties have increased or decreased in value. The MLS® Home Price Index (HPI) provides the best way to gauge price trends because averages are strongly distorted by changes in the mix of sales activity from one month to the next.
The MLS® HPI composite benchmark price for all residential properties in Kitchener-Waterloo was $790,600 in June. This represents a 6.8 per cent increase over June 2021 and a 6.8 per cent decrease compared to May 2022.
- The benchmark price for a detached home was $876,600. This represents a 5.3 per cent increase from June 2021 and 7.3 per cent decrease compared to May 2022.
- The benchmark price for a townhouse is $676,900. This represents a 15.8 per cent increase from June 2021 and a 7.1 per cent decrease compared to May 2022.
- The benchmark price for an apartment-style condominium was $537,100. This represents a 24.2 per cent increase from June 2021 and a 2.4 per cent decrease compared to May 2022.

“This time last year, sales were going through the roof,” says Bell. “The home buying scene is a little different this year with folks finally taking their postponed trips, attending weddings, and generally catching up on the many missed occasions of the past two years.” Of course, recent hikes in mortgage rates are also contributing to sales cooling, notes KWAR’s president.
“While any shift in the market will result in some individuals predicting the worse, the simple reality is that the market we had been in was unsustainable,” says Bell. “What this means for buyers is more inventory, more choices, and perhaps most importantly, potentially less stress when purchasing. For sellers, they need to ensure their properties stand out from the competition and be aware it may take more time to sell their home and for potentially less money than they were expecting.”
There were 1,285 new listings added to the MLS® System in KW and area last month, an increase of 49.2 per cent compared to June of last year, and a 41.7 per cent increase compared to the previous ten-year average for June.
The total number of homes available for sale in active status at the end of June was 991, an increase of 165.0 per cent compared to June of last year, and 20.6 per cent below the previous ten-year average of 1249 listings for June.
The number of months of inventory increased to 1.8 months in June from 1.6 months in May. While inventory is still at historic lows, this is the highest it’s been since September 2019 and a return to where inventory was in the pre-pandemic June of 2019. The number of months of inventory represents how long it would take to sell off current inventories at the current rate of sales.
The average number of days to sell in June was 13 days, compared to 11 days in June 2021. The previous 5-year average is 17 days.
Those requiring specific information on property values should contact a local REALTOR®. Working with a Realtor is the best way to get a complete picture of the property and community you are considering.
View our HPI tool here to learn more: https://kwar.ca/hpi-dashboard
Historical Sales By Property Type

Months Supply of Homes for Sale

Historical Median Sales Price – By Property Type

Historical Average Sales Price – By Property Type

Average Days on Market

KWAR cautions that average sale price information can be useful in establishing long term trends but should not be used as an indicator that specific properties have increased or decreased in value. The average sale price is calculated based on the total dollar volume of all properties sold. Months Supply is the inventory of homes for sale at the end of a given month, divided by the average monthly closed sales from the last 12 months Those requiring specific information on property values should contact a local REALTOR®. REALTORS® have their fingers on the pulse of the market. They know the questions to ask, the areas to probe and what to look for so that you get a complete picture of the property and community you’re considering.
Tags: buyers, kitchener, Kitchener Buyers, kitchener real estate, Kitchener Sellers, kitchener-waterloo, kitchener-waterloo association of realtors, KW Real Estate, rizsellskw.com, TheRizTeam, waterloo real estate, www.rizsellskw.com
Posted in Enhance Your Home, Kitchener Buyers, Kitchener Sellers, Market Stats, Market Update, Real Estate News, Realtor Tips, Uncategorized, Waterloo Buyers, Waterloo Sellers | Comments Off on Kitchener Waterloo Market Snapshot June 2022


