Kitchener-Waterloo Market Snapshot September 2021
HOME PRICES CONTINUE TO CLIMB IN SEPTEMBER
LISTINGS CONTINUE TO BE OUTSTRIPPED BY BUYING DEMAND
KITCHENER-WATERLOO, ON (October 4, 2021) –– A total of 506 residential homes sold last month through the Multiple Listing Service® (MLS® System) of the Kitchener-Waterloo Association of REALTORS® (KWAR), a decrease of 32.1 per cent compared to last September and a decrease of 5.9 per cent compared to August.
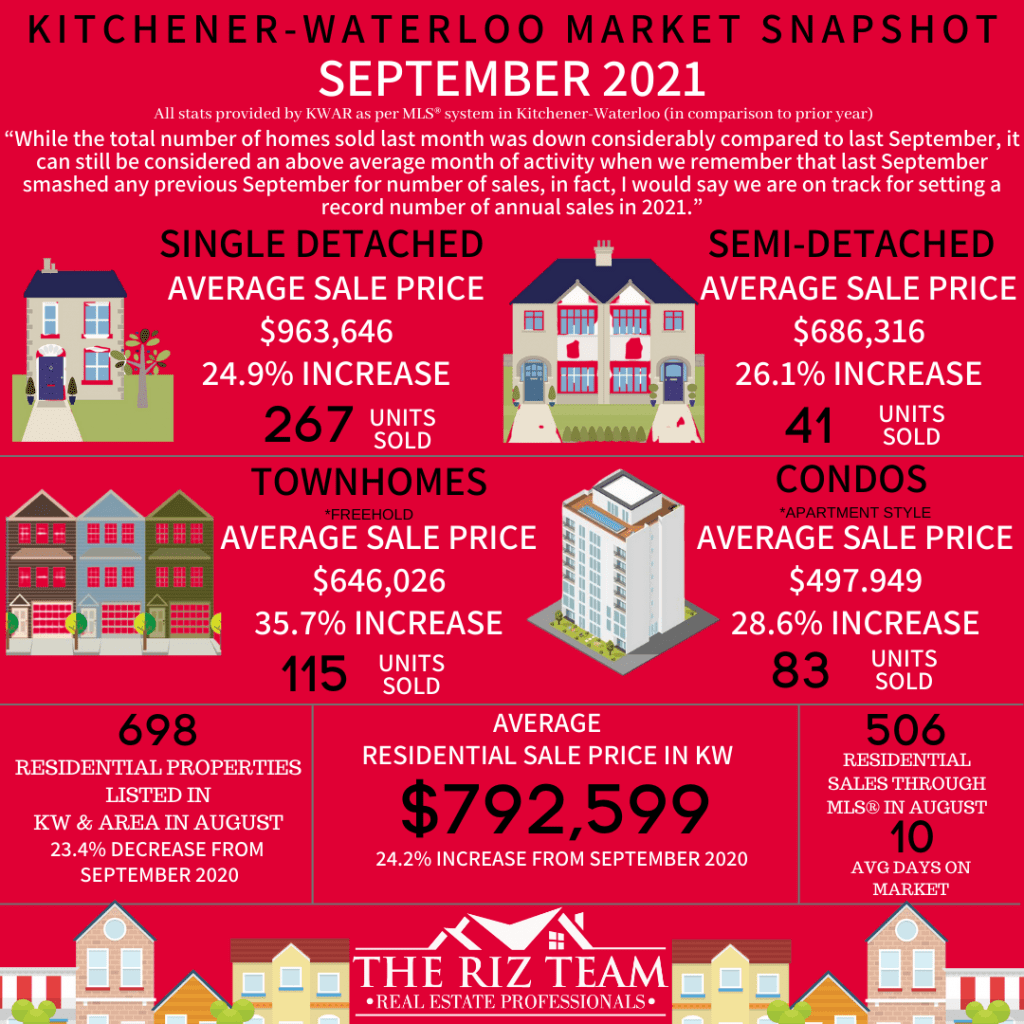
“While the total number of homes sold last month was down considerably compared to last September, it can still be considered an above average month of activity when we remember that last September smashed any previous September for number of sales,” says KWAR’s president, Nicole Pohl. “In fact, I would say we are on track for setting a record number of annual sales in 2021.”
Total residential sales in September included 267 detached (down 37.3 per cent from September 2020), and 83 condominium units (down 11.7 per cent). Sales also included 41 semi-detached homes (down 21.2) and 115 townhouses (down 33.5 per cent).
In September, the average sale price for all residential properties in the Kitchener-Waterloo area was $792,599. This represents a 24.2 per cent increase over September 2020 and a 5.7 per cent increase compared to August 2021.
- The average price of a detached home was $963,646. This represents a 24.9 per cent increase from September 2020 and an increase of 7.9 per cent compared to August 2021.
- The average sale price for an apartment-style condominium was $497,949. This represents an increase of 28.6 per cent from September 2020 and an increase of 12.4 per cent compared to August 2021.
- The average sale price for a townhouse was $646,026. This represents a 35.7 per cent increase from September 2020 and an increase of 3.7 per cent compared to August 2021.
- The average sale price for a semi was $686,316. This represents an increase of 26.1 per cent compared to September 2020 and an increase of 0.5 per cent compared to August 2021.

KWAR cautions that average sale price information can be useful in establishing long-term trends but should not be used as an indicator that specific properties have increased or decreased in value. The MLS® Home Price Index (HPI) provides the best way to gauge price trends because averages are strongly distorted by changes in the mix of sales activity from one month to the next.
The MLS® HPI composite benchmark price for all residential properties in Kitchener-Waterloo was $784,200 in September. This represents a 33.0 per cent increase over September 2020 and a 3.5 per cent increase compared to August 2021.
- The benchmark price for a detached home was $869,220. This represents a 34.2 per cent increase from September 2020 and 3.8 per cent increase compared to August 2021.
- The benchmark price for an apartment-style condominium was $392,600. This represents a 21.5 per cent increase from September 2020 and a 3.1 per cent increase compared to August 2021.
- The benchmark price for a townhouse is $581,700. This represents a 40.0 per cent increase from September 2020 and a 2.4 per cent increase compared to August 2021.

There were 698 new listings added to the MLS® System in KW and area last month, a decrease of 23.4 per cent compared to September of last year, and a 13 per cent decrease compared to the previous ten-year average for September.
The total number of homes available for sale in active status at the end of September was 345, a decrease of 35.3 per cent compared to September of last year, and 73.2 per cent below the previous ten-year average of 1,285 listings for September.
“Home prices reached all new highs in September, “says Pohl. “And while there is a growing call to add more transparency to how real estate is traded in Ontario —the brutal reality of this market is that supply is simply not keeping up with demand and that is what is driving up prices.”
The President of KWAR says: “While there are many who have zeroed in on the blind bidding process, the greater concern is that homes are being purchased without all the normal conditions you would see in a balanced market. As a practicing REALTOR® I completely support and hope the government will add the ability for REALTORS® to provide greater transparency on offers,” says Pohl. “But as it is, we are legislatively restricted from disclosing anything more than simply the number of offers, which is not working for homebuyers.”
The number of months of inventory nudged up slightly from August’s 0.4 months to half a month in September. Inventory has settled at under 1 month for the past 11 consecutive months. The number of months of inventory represents how long it would take to sell off current inventories at the current rate of sales.
The average number of days to sell in September was 10 days, compared to 14 days in September 2020 and a previous 5-year average of 23 days.
Those requiring specific information on property values should contact a local REALTOR®. Working with a Realtor is the best way to get a complete picture of the property and community you are considering.
View our HPI tool here to learn more: https://kwar.ca/hpi-dashboard
Historical Sales By Property Type

Months Supply of Homes for Sale

Historical Median Sales Price – By Property Type

Historical Average Sales Price – By Property Type


KWAR cautions that average sale price information can be useful in establishing long-term trends but should not be used as an indicator that specific properties have increased or decreased in value. The average sale price is calculated based on the total dollar volume of all properties sold. Months Supply is the inventory of homes for sale at the end of a given month, divided by the average monthly closed sales from the last 12 months Those requiring specific information on property values should contact a local REALTOR®. REALTORS® have their fingers on the pulse of the market. They know the questions to ask, the areas to probe, and what to look for so that you get a complete picture of the property and community you’re considering.
Tags: buyers, for sale, Homes For Sale, Kitchener Buyers, kitchener for sale, kitchener real estate, kitchener-waterloo, kitchener-waterloo association of realtors, KW Market Update, Market Update, the riz team, Waterloo Buyers, waterloo real estate