Posts Tagged ‘buyers’
Thursday, October 3rd, 2024
Waterloo Region Sees Decrease in Home Sales for September
In September, a total of 521 homes were sold in the Waterloo Region via the Multiple Listing Service® (MLS®) System of the Cornerstone Association of REALTORS® (Cornerstone). This represents a decrease of 2.1 per cent compared to the same period last year and a decline of 23.5 per cent compared to the average number of homes sold in the previous ten years for the same month.
“In September, there was an overall slowdown in home sales, but we continued to see strong demand for detached homes, resulting in an increase in sales for that specific type of property,” said Christal Moura, spokesperson for the Waterloo Region market area. “Meanwhile, buyers have a bit more selection than a year ago as inventory is up, and homes take a little longer to sell. This can mean a less stressful homebuying experience, but for sellers, the current market may require more patience or even adjustment in price expectation.”
If you are considering to Sell your home or Buy a home in the next short while it would be highly beneficial for you to connect with one of our Team Agents at
Do you want to know what your home is worth today? Click Below for our Online No Obligation Market Evaluation
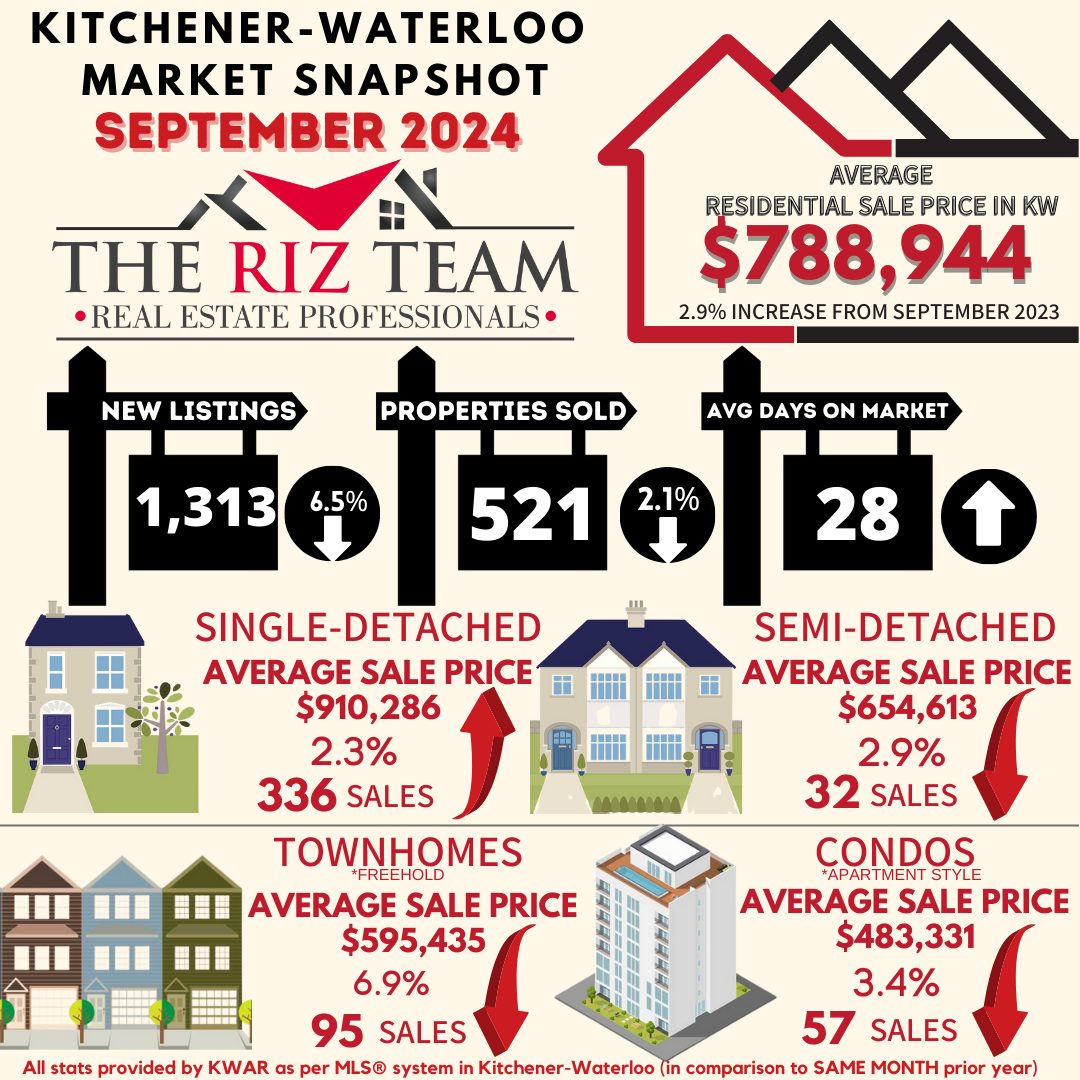
Total residential sales in September included 336 detached homes (up 9.4 per cent from September 2023), and 95 townhouses (down 22.1 per cent). Sales also included 57 condominium units (down 16.2 per cent) and 32 semi-detached homes (down 3.0 per cent).
In September, the average sale price for all residential properties in Waterloo Region was $788,944. This represents a 2.9 per cent increase compared to September 2023 and a 2.3 per cent increase compared to August 2024.
- The average price of a detached home was $910,286. This represents a 2.3 per cent increase from September 2023 and an increase of 2.2 per cent compared to August 2024.
- The average sale price for a townhouse was $595,435. This represents a 6.9 per cent decrease from September 2023 and a decrease of 2.7 per cent compared to August 2024.
- The average sale price for an apartment-style condominium was $483,331. This represents a decrease of 3.4 per cent from September 2023 and an increase of 4.9 per cent compared to August 2024.
- The average sale price for a semi was $654,613. This represents a decrease of 2.9 per cent compared to September 2023 and an increase of 0.1 per cent compared to August 2024.

MLS® Home Price Index Benchmark Price
|
|
Kitchener-Waterloo |
Cambridge |
| Benchmark Type: |
September 2024 |
Monthly % Change |
Yr./Yr. % Change |
September 2024 |
Monthly % Change |
Yr./Yr. % Change |
| Composite |
$728,700 |
0.2 |
-1.8 |
$741,800 |
-0.1 |
0.0 |
| Single Family |
$844,400 |
0.6 |
0.3 |
$777,500 |
0.2 |
1.3 |
| Townhouse |
$602,800 |
-0.7 |
-5.5 |
$641,700 |
-1.7 |
-4.8 |
| Apartment |
$435,700 |
-1.3 |
-8.3 |
$481,500 |
-0.2 |
-4.2 |

In September, Cornerstone welcomed policy changes from the federal government. These changes include extending mortgage terms to 30 years for first-time homebuyers and all buyers of new builds and raising the CMHC insurance cap from $1 million to $1.5 million. These changes will come into effect later this year. Combined with anticipated further interest rate cuts, these adjustments could enable more buyers to purchase their first home.
There were 1,313 new listings added to the MLS® System in Waterloo Region last month, a decrease of 6.5 per cent compared to September last year and a 20.0 per cent increase compared to the previous ten-year average for September.
The total number of homes available for sale in active status at the end of September was 1,751 an increase of 21.3 per cent compared to September of last year and 42.2 per cent above the previous ten-year average of 1,232 listings for September.
The total inventory across the market increased by 23.1 percent, resulting in a 3.2-month supply of all property types by the end of September. Condominium apartments had the highest inventory, with 5.5 months’ supply, followed by townhouses with 3.6 months’ supply and detached homes with 2.7 months’ supply. The number of months of inventory represents the time it would take to sell off current inventories at the current sales rate.
The average time it took to sell a home in September was 28 days, which is three days longer than the previous month. In September 2023, it took 19 days for a home to sell, and the five-year average is 18 days.
Cornerstone emphasizes the importance of consulting a local REALTOR® when considering buying or selling property in the Waterloo Region. Their expertise can provide valuable insights into the current market conditions, enabling individuals to make well-informed decisions aligned with their goals and preferences.


Tags: buyers, for sale, home sales, kitchener, kitchener real estate, kitchener-waterloo, KW Market Update, KW Real Estate, real estate, riz jadavji, Royal Lepage Wolle Realty, sales representative, sellers, the riz team, waterloo, Waterloo Buyers, Waterloo Sellers, www.rizsellskw.com
Posted in Kitchener Buyers, Kitchener Sellers, Market Stats, Market Update, Real Estate News, Realtor Tips, Waterloo Buyers, Waterloo Sellers | Comments Off on Kitchener Waterloo Market Snapshot September 2024
Thursday, September 5th, 2024
Waterloo Region Sees Strong Demand for Detached Homes Amid Cooler Residential Sales in August
In August, a total of 539 homes were sold in the Waterloo Region via the Multiple Listing Service® (MLS®) System of the Cornerstone Association of REALTORS® (Cornerstone). This represents a decrease of 5.3 per cent compared to the same period last year and a decline of 24.1 per cent compared to the average number of homes sold in the previous ten years for the same month.
“Despite a cooling market, detached homes continue to see strong demand, reflected in a 6.0 percent increase in sales year-over-year,” says Christal Moura, spokesperson for the Waterloo Region market area. “With home prices showing stability in recent months and interest rates decreasing, we saw some home buyers finally come out from the wings to take advantage of the summer slowdown to seek out specific property types, like single-family homes.”
If you are considering to Sell your home or Buy a home in the next short while it would be highly beneficial for you to connect with one of our Team Agents at
Do you want to know what your home is worth today? Click Below for our Online No Obligation Market Evaluation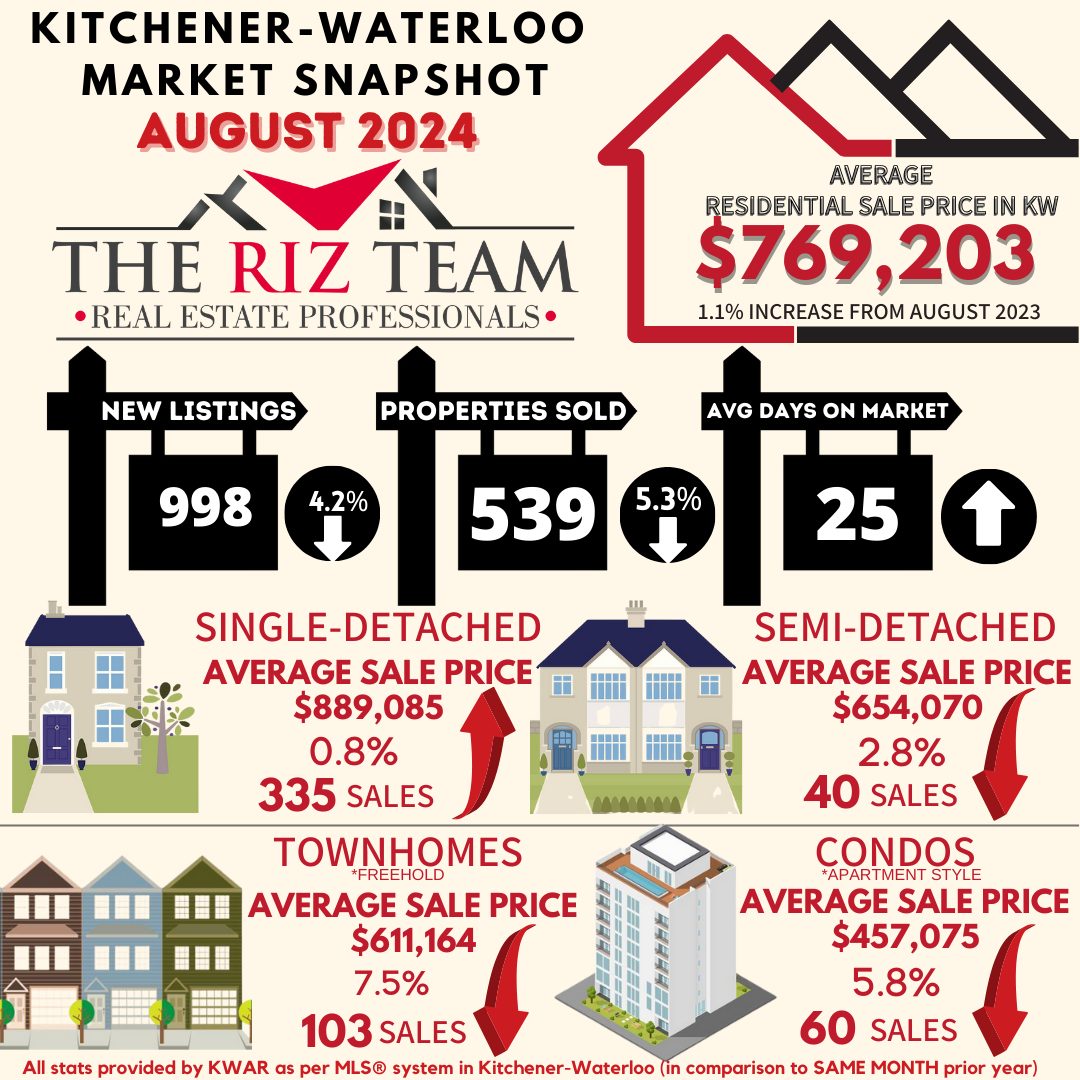
WATERLOO REGION, ON (September 5, 2024) —In August, a total of 539 homes were sold in the Waterloo Region via the Multiple Listing Service® (MLS®) System of the Cornerstone Association of REALTORS® (Cornerstone). This represents a decrease of 5.3 per cent compared to the same period last year and a decline of 24.1 per cent compared to the average number of homes sold in the previous ten years for the same month.
“Despite a cooling market, detached homes continue to see strong demand, reflected in a 6.0 percent increase in sales year-over-year,” says Christal Moura, spokesperson for the Waterloo Region market area. “With home prices showing stability in recent months and interest rates decreasing, we saw some home buyers finally come out from the wings to take advantage of the summer slowdown to seek out specific property types, like single-family homes.”
Total residential sales in August included 335 detached homes (up 6.0 per cent from August 2023), and 103 townhouses (down 22.6 per cent). Sales also included 60 condominium units (down 18.9 per cent) and 40 semi-detached homes (down 11.1 per cent).
In August, the average sale price for all residential properties in Waterloo Region was $769,203. This represents a 1.1 per cent increase compared to August 2023 and a 1.7 per cent decrease compared to July 2024.
- The average price of a detached home was $889,085. This represents a 0.8 per cent increase from August 2023 and a decrease of 2.7 per cent compared to July 2024.
- The average sale price for a townhouse was $611,164. This represents a 7.5 per cent decrease from August 2023 and a decrease of 1.5 per cent compared to July 2024.
- The average sale price for an apartment-style condominium was $457,075. This represents a decrease of 5.8 per cent from August 2023 and a decrease of 7.7 per cent compared to July 2024.
- The average sale price for a semi was $654,070. This represents a decrease of 2.8 per cent compared to August 2023 and a decrease of 1.9 per cent compared to July 2024.


ABOUT CORNERSTONE
Cornerstone Association of REALTORS® (Cornerstone) is a brand-new, novel association formed on July 1, 2024. Representing REALTORS® serving in the markets of Mississauga, Burlington, Hamilton, Waterloo Region, Niagara North, Haldimand County, Norfolk County and surrounding areas, it will become Ontario’s second-largest real estate board comprised of nearly 9,000 REALTORS®.
Established to better serve and represent REALTORS®, its vision is to establish a new, more influential, capable, and member-centric organization designed to meet the evolving needs of REALTORS® and help them thrive in the marketplace.
Cornerstone stands for transparency, honesty, and integrity. By taking a proactive stance toward the future and not being afraid to question some of the long-standing assumptions, Cornerstone offers a unique value proposition, paving the way for members’ brighter future.
We are Cornerstone. REALTORS® Together, Stronger Together.
More information at www.cornerstone.inc
Tags: buyers, for sale, home sales, kitchener, kitchener real estate, kitchener-waterloo, KW Market Update, real estate, riz jadavji, Royal Lepage Wolle Realty, sales representative, sellers, the riz team, waterloo, Waterloo Buyers, waterloo real estate, Waterloo Sellers, www.rizsellskw.com
Posted in Kitchener Buyers, Kitchener Sellers, Market Stats, Market Update, Real Estate News, Realtor Tips, Waterloo Buyers, Waterloo Sellers | Comments Off on Kitchener Waterloo Market Snapshot August 2024
Tuesday, August 6th, 2024
Waterloo Region Housing Market Sees Modest Sales Uptick in July Amid Lower Interest Rates and Increased Inventory
“In July, we observed a slight increase in home sales year-over-year following a reduction in interest rates, which seems to have provided a modest boost to market activity,” says Christal Moura, spokesperson for the Waterloo Region market area. “While this uptick is encouraging, it is evident that many potential buyers are adopting a wait-and-see approach, anticipating further decreases in interest rates and better buying conditions in the near future.”
If you are considering to Sell your home or Buy a home in the next short while it would be highly beneficial for you to connect with one of our Team Agents at
Do you want to know what your home is worth today? Click Below for our Online No Obligation Market Evaluation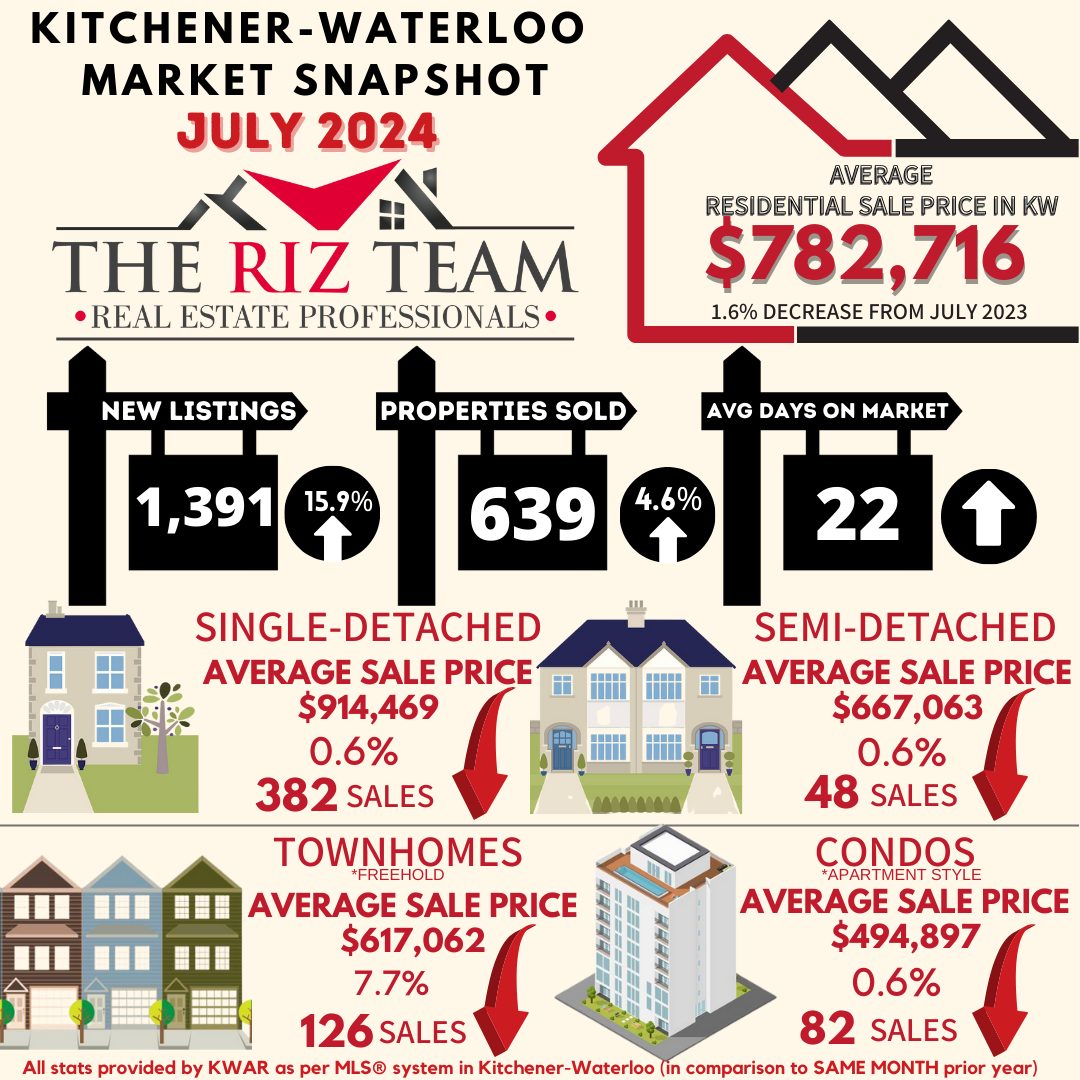
WATERLOO REGION, ON (August 6, 2024) —In July, a total of 639 homes were sold in the Waterloo Region via the Multiple Listing Service® (MLS®) System of the Cornerstone Association of REALTORS® (Cornerstone). This represents an increase of 4.6 per cent compared to the same period last year and a decline of 16.6 per cent compared to the average number of homes sold in the previous ten years for the same month.
“In July, we observed a slight increase in home sales year-over-year following a reduction in interest rates, which seems to have provided a modest boost to market activity,” says Christal Moura, spokesperson for the Waterloo Region market area. “While this uptick is encouraging, it is evident that many potential buyers are adopting a wait-and-see approach, anticipating further decreases in interest rates and better buying conditions in the near future.”
Total residential sales in July included 382 detached homes (up 4.1 per cent from July 2023), and 126 townhouses (up 5.0 per cent). Sales also included 82 condominium units (up 9.3 per cent) and 48 semi-detached homes (up 9.1 per cent).
In July, the average sale price for all residential properties in Waterloo Region was $782,716. This represents a 1.6 per cent decrease compared to July 2023 and a 0.9 per cent decrease compared to June 2024.
- The average price of a detached home was $914,469. This represents a 0.6 per cent decrease from July 2023 and an increase of 1.6 per cent compared to June 2024.
- The average sale price for a townhouse was $617,062. This represents a 7.7 per cent decrease from July 2023 and a decrease of 7.1 per cent compared to June 2024.
- The average sale price for an apartment-style condominium was $494,897. This represents a decrease of 0.6 per cent from July 2023 and an increase of 7.1 per cent compared to June 2024.
- The average sale price for a semi was $667,063. This represents a decrease of 0.6 per cent compared to July 2023 and an increase of 2.7 per cent compared to June 2024.


Cornerstone Association of REALTORS® cautions that average sale price information can help identify long-term trends but should not be to indicate that specific properties have increased or decreased in value. The average sale price is calculated based on the total dollar volume of all properties sold. Months Supply is the inventory of homes for sale at the end of a given month, divided by the average monthly closed sales from the last 12 months. Those requiring specific information on property values should contact a Waterloo Region REALTOR®. REALTORS® have their fingers on the pulse of the market. They know the questions to ask, the areas to probe and what to look for so that you get a complete picture of the property and community you’re considering.
ABOUT CORNERSTONE
Cornerstone Association of REALTORS® (Cornerstone) is a brand-new, novel association formed on July 1, 2024. Representing REALTORS® serving in the markets of Mississauga, Burlington, Hamilton, Waterloo Region, Niagara North, Haldimand County, Norfolk County and surrounding areas, it will become Ontario’s second-largest real estate board comprised of nearly 9,000 REALTORS®.
Established to better serve and represent REALTORS®, its vision is to establish a new, more influential, capable, and member-centric organization designed to meet the evolving needs of REALTORS® and help them thrive in the marketplace.
Cornerstone stands for transparency, honesty, and integrity. By taking a proactive stance toward the future and not being afraid to question some of the long-standing assumptions, Cornerstone offers a unique value proposition, paving the way for members’ brighter future.
We are Cornerstone. REALTORS® Together, Stronger Together.
More information at www.cornerstone.inc
Tags: buyers, for sale, home sales, kitchener, kitchener real estate, kitchener-waterloo, KW Market Update, real estate, riz jadavji, rizsellskw, Royal Lepage Wolle Realty, sales representative, sellers, the riz team, waterloo, Waterloo Buyers, waterloo real estate, Waterloo Sellers, www.rizsellskw.com
Posted in Kitchener Buyers, Kitchener Sellers, Market Stats, Market Update, Real Estate News, Realtor Tips, Waterloo Buyers, Waterloo Sellers | Comments Off on Kitchener Waterloo Market Snapshot July 2024
Wednesday, July 24th, 2024
This decrease will assist buyers by offering a better affordability plan on their monthly payments, while also helping sellers within a more active marketplace as buyers start to re-enter. Be sure to connect with anyone from The Riz Team and let’s put a plan in place for your next move….

Do you want to know what your home is worth today? Click Below for our Online No Obligation Market Evaluation
Bank of Canada cuts key interest rate again, more cuts ‘reasonable’ if inflation keeps easing
For the second time in a row, Canada’s central bank has cut its overnight lending rate.
In its pre-scheduled July 2024 announcement, the Bank of Canada dropped the target for the overnight lending rate by 25 basis points to 4.50%.
While inflation remains above the Bank’s 2% target, it is expected that inflation will continue to ease as the global economy expands into 2026, bolstering the Bank’s decision to continue lowering rates.
In his opening remarks to reporters at a press conference following the announcement, Tiff Macklem, Governor of the Bank of Canada, cited that the risk that inflation continues to grow must be balanced against the risk that the economy and inflation could weaken.
“Looking ahead, we expect inflation to moderate further, though progress over the next year will likely be uneven. This forecast reflects the opposing forces affecting inflation. The overall weakness in the economy is pulling inflation down. At the same time, price pressures in shelter and some other services are holding inflation up,” said Macklem. “We are increasingly confident that the ingredients to bring inflation back to target are in place. But the push-pull of these opposing forces means the decline in inflation will likely be gradual, and there could be setbacks along the way.”

| Date* |
Target (%) |
Change (%) |
| July 24, 2024 |
4.5 |
-0.25 |
| June 5, 2024 |
4.75 |
-0.25 |
| April 10, 2024 |
5 |
— |
| March 6, 2024 |
5 |
— |
| January 24, 2024 |
5 |
— |
| December 6, 2023 |
5 |
— |
| October 25, 2023 |
5 |
— |
| September 6, 2023 |
5 |
— |
| July 12, 2023 |
5 |
0.25 |
| June 7, 2023 |
4.75 |
0.25 |
| April 12, 2023 |
4.5 |
— |
| March 8, 2023 |
4.5 |
— |
According to a recent Royal LePage survey, conducted by Leger,1 51% of Canadians who put their home buying plans on hold the last two years said they would return to the market when the Bank of Canada reduced its key lending rate. Eighteen percent said they would wait for a cut of 50 to 100 basis points, and 23% said they’d need to see a cut of more than 100 basis points before considering resuming their search.
“Our research shows that many buyer hopefuls have been waiting for a concrete signal from the Bank of Canada that the economy is moving in the right direction. A second cut to the overnight lending rate indicates just that, and with mortgage qualification thresholds continuing to come down, sidelined buyers may have the confidence they need to make their return to the housing market,” said Karen Yolevski, COO of Royal LePage Real Estate Services Ltd.
“We expect this will prompt a slight boost in activity in the short-term, followed by more robust buyer demand in the fall. In the meantime, some much-needed inventory has been building in major markets over the last few months, giving buyers more options to choose from. In addition to lower rates, this may also encourage more buyers to re-enter the market in the near future.”
The Bank of Canada will make its next announcement on Wednesday, September 4th.
Read the full July 24th report here.
Article excerpts brought to you by
Michelle McNally
Communications manager, Royal LePage
Tags: buyers, housing, kitchener-waterloo, KW Market Update, royal lepage, Royal Lepage Wolle Realty, sales representative, the riz team, TheRizTeam, waterloo, Waterloo Buyers, waterloo for sale, Waterloo Homes, waterloo real estate, waterloo realtor, Waterloo Sellers
Posted in Kitchener Buyers, Kitchener Sellers, Market Stats, Market Update, Real Estate News, Realtor Tips, Uncategorized, Waterloo Buyers, Waterloo Sellers | Comments Off on Bank of Canada makes second consecutive rate cut, lowers overnight lending rate to 4.50%
Thursday, July 4th, 2024
Waterloo Region Housing Market Sees Cooling Trend: Increased Inventory and Lower Prices Provide Opportunities for Buyers
“The Waterloo Region housing market is cooling, with a year-over-year decrease in home sales in June, while the number of homes for sale is rising, offering more inventory to buyers,” says Christal Moura, Cornerstone spokesperson for the Waterloo Region market area.”
If you are considering to Sell your home or Buy a home in the next short while it would be highly beneficial for you to connect with one of our Team Agents at
Do you want to know what your home is worth today? Click Below for our Online No Obligation Market Evaluation
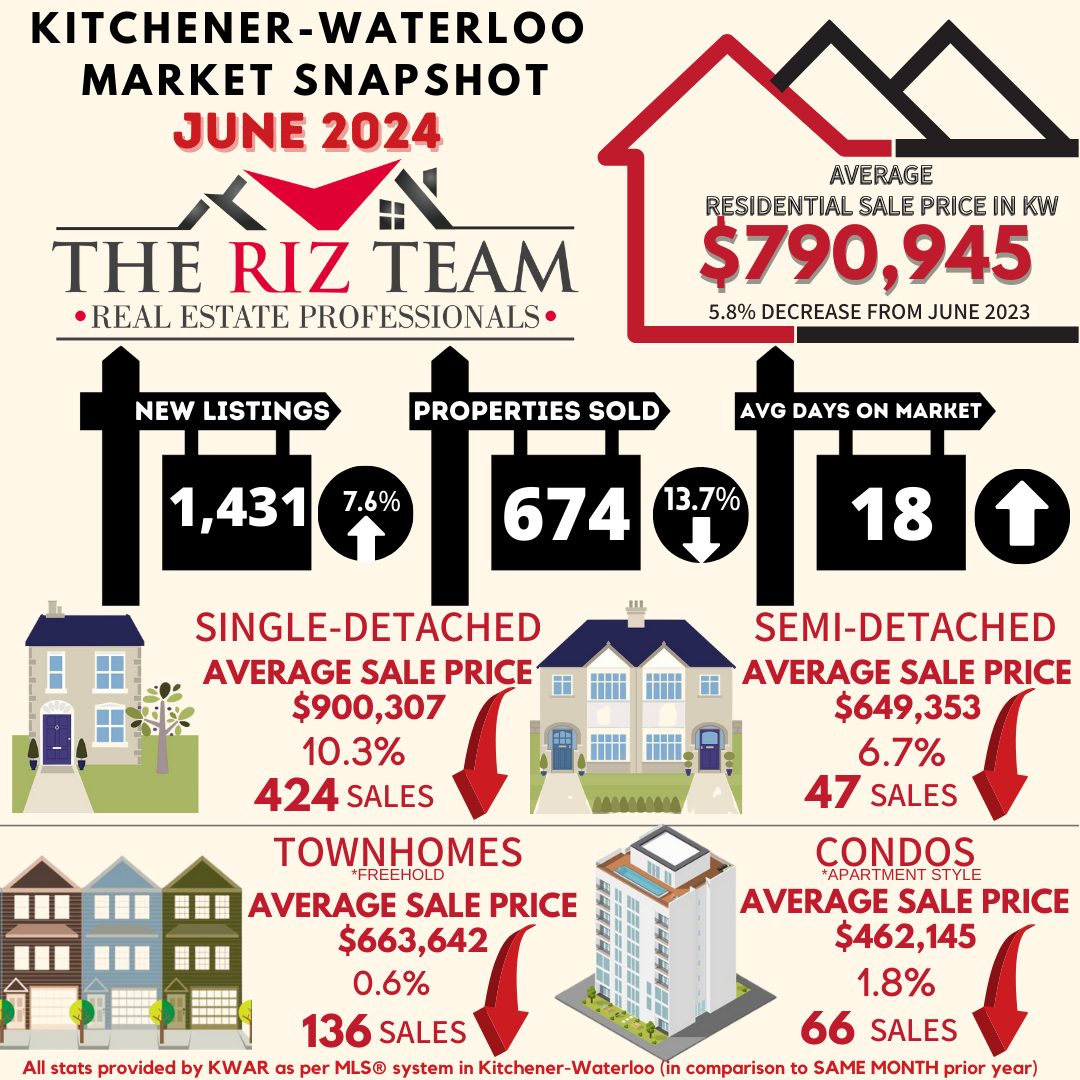
WATERLOO REGION, ON (July 4, 2024) —In June, a total of 674 homes were sold in the Waterloo Region via the Multiple Listing Service® (MLS®) System of the Cornerstone Association of REALTORS® (Cornerstone). This represents a decrease of 13.7 per cent compared to the same period last year and a decline of 24.8 per cent compared to the average number of homes sold in the previous ten years for the same month.
“The Waterloo Region housing market is cooling, with a year-over-year decrease in home sales in June, while the number of homes for sale is rising, offering more inventory to buyers,” says Christal Moura, Cornerstone spokesperson for the Waterloo Region market area.”
Total residential sales in June included 424 detached (down 9.6 per cent from June 2023), and 136 townhouses (down 8.7 per cent). Sales also included 66 condominium units (down 44.5 per cent) and 47 semi-detached homes (up 14.6 per cent).
In June, the average sale price for all residential properties in Waterloo Region was $790,945. This represents a 5.8 per cent decrease compared to June 2023 and a 3.3 per cent decrease compared to May 2024.
- The average price of a detached home was $900,307. This represents a 10.3 per cent decrease from June 2023 and a decrease of 4.6 per cent compared to May 2024.
- The average sale price for a townhouse was $663,642. This represents a 0.6 per cent decrease from June 2023 and an increase of 2.0 per cent compared to May 2024.
- The average sale price for an apartment-style condominium was $462,145. This represents a decrease of 1.8 per cent from June 2023 and an increase of 0.5 per cent compared to May 2024.
- The average sale price for a semi was $649,353. This represents a decrease of 6.7 per cent compared to June 2023 and a decrease of 7.2 per cent compared to May 2024.

MLS® Home Price Index Benchmark Price
|
|
Kitchener-Waterloo |
Cambridge |
| Benchmark Type: |
June 2024 |
Monthly % Change |
Yr./Yr. % Change |
June 2024 |
Monthly % Change |
Yr./Yr. % Change |
| Composite |
$741,500 |
-1.4 |
-5.6 |
$755,200 |
-0.7 |
-3.1 |
| Detached |
$852,900 |
-1.6 |
-5.1 |
$791,900 |
-0.6 |
-3.1 |
| Townhouse |
$626,400 |
-1.2 |
-3.9 |
$652,600 |
-0.7 |
-0.6 |
| Apartment |
$455,800 |
-0.5 |
-4.7 |
$490,600 |
-1.1 |
1.6 |

“The average selling price for residential properties has decreased by 5.8 per cent since June 2023, with detached homes showing the most significant drop at 10.3 percent. This indicates a broader softness in the market,” says Moura. “The silver lining is this presents a more favourable pricing environment for buyers, with more choices, greater flexibility, and the potential to negotiate better deals.”
There were 1,431 new listings added to the MLS® System in Waterloo Region last month, an increase of 7.6 per cent compared to June last year and a 10.6 per cent increase compared to the previous ten-year average for June.
The total number of homes available for sale in active status at the end of June was 1,790, an increase of 75.5 per cent compared to June of last year and 31.9 per cent above the previous ten-year average of 1,357 listings for June.
Market-wide inventory levels were up 73.7 per cent, with 3.3 months’ supply for all property types at the end of June. The property type that gained the most inventory was the condo apartment segment, which increased by 103.1 percent. That amounts to 6.5 months’ supply for condo apartments, 2.8 months for detached homes, and 3.2 months for townhouses. The number of months of inventory represents the amount of time it would take to sell off current inventories at the current sales rate.
The average number of days to sell in June was 18, compared to 15 days in June 2023. The previous 5-year average is 15 days.
Cornerstone emphasizes the importance of consulting a local REALTOR® when considering buying or selling property in the Waterloo Region. Their expertise can provide valuable insights into the current market conditions, enabling individuals to make well-informed decisions aligned with their goals and preferences.


ABOUT CORNERSTONE
Cornerstone Association of REALTORS® (Cornerstone) is a brand-new, novel association formed on July 1, 2024. Representing REALTORS® serving in the markets of Mississauga, Burlington, Hamilton, Waterloo Region, Niagara North, Haldimand County, Norfolk County and surrounding areas, it will become Ontario’s second-largest real estate board comprised of nearly 9,000 REALTORS®.
Established to better serve and represent REALTORS®, its vision is to establish a new, more influential, capable, and member-centric organization designed to meet the evolving needs of REALTORS® and help them thrive in the marketplace.
Cornerstone stands for transparency, honesty, and integrity. By taking a proactive stance toward the future and not being afraid to question some of the long-standing assumptions, Cornerstone offers a unique value proposition, paving the way for members’ brighter future.
We are Cornerstone. REALTORS® Together, Stronger Together.
More information at www.cornerstone.inc
Tags: buyers, for sale, home sales, housing, kitchener, Kitchener Buyers, kitchener-waterloo, kitchener-waterloo association of realtors, KW Market Update, Market Update, real estate, riz jadavji, rizsellskw, rizsellskw.com, Royal Lepage Wolle Realty, sales representative, the riz team, Waterloo Buyers, waterloo real estate, Waterloo Sellers, www.rizsellskw.com
Posted in Kitchener Buyers, Kitchener Sellers, Market Stats, Market Update, Real Estate News, Realtor Tips, Waterloo Buyers, Waterloo Sellers | Comments Off on Kitchener Waterloo Market Snapshot June 2024
Wednesday, June 5th, 2024
Waterloo Region Sees Dip in Home Sales Due to Sluggish Condo Market
“May saw a dip in the number of sales across all categories, with condo apartments experiencing the largest drop,” says Christal Moura, president of WRAR. “The Condo market also had the greatest supply level, posing a challenge for sellers, especially for units with one or fewer bedrooms, where the current inventory level exceeds buyer demand.”
If you are considering to Sell your home or Buy a home in the next short while it would be highly beneficial for you to connect with one of our Team Agents at
Do you want to know what your home is worth today? Click Below for our Online No Obligation Market Evaluation
WATERLOO REGION, ON (June 5, 2024) —In May, a total of 742 homes were sold via the Multiple Listing Service® (MLS®) System of the Waterloo Region Association of REALTORS® (WRAR). This represents a decrease of 8.1 per cent compared to the same period last year and a decline of 20.0 per cent compared to the average number of homes sold in the previous ten years for the same month.
“May saw a dip in the number of sales across all categories, with condo apartments experiencing the largest drop,” says Christal Moura, president of WRAR. “The Condo market also had the greatest supply level, posing a challenge for sellers, especially for units with one or fewer bedrooms, where the current inventory level exceeds buyer demand.”
Total residential sales in May included 467 detached (down 1.3 per cent from May 2023), and 134 townhouses (down 3.6 per cent). Sales also included 82 condominium units (down 34.4 per cent) and 59 semi-detached homes (down 13.2 per cent).
In May, the average sale price for all residential properties in Waterloo Region was $818,507. This represents a 0.3 per cent decrease compared to May 2023 and a 2.3 per cent increase compared to April 2024.
- The average price of a detached home was $943,859. This represents a 1.9 per cent decrease from May 2023 and an increase of 0.4 per cent compared to April 2024.
- The average sale price for a townhouse was $653,761. This represents a 6.1 per cent decrease from May 2023 and a decrease of 0.9 per cent compared to April 2024.
- The average sale price for an apartment-style condominium was $459,260. This represents a decrease of 5.6 per cent from May 2023 and a decrease of 5.6 per cent compared to April 2024.
- The average sale price for a semi was $699,780. This represents a decrease of 3.9 per cent compared to May 2023 and an increase of 5.1 per cent compared to April 2024.


“This spring, we are witnessing a significant increase in the availability of apartment-style condos, with a record high number of units on the market,” stated Moura. “At the same time, we are observing a shift in demand away from smaller-sized condo units, potentially influenced by the higher interest rates impacting investor market activity for this property type.”
There were 1,644 new listings added to the MLS® System in Waterloo Region last month, an increase of 28.9 per cent compared to May last year and a 15.8 per cent increase compared to the previous ten-year average for May.
The total number of homes available for sale in active status at the end of May was 1,741, an increase of 95.8 per cent compared to May of last year and 27.9 per cent above the previous ten-year average of 1,361 listings for May.
Market-wide inventory levels were up 93.8 per cent, with 3.1 months’ supply for all property types at the end of May. The property type that gained the most inventory was the condo apartment segment, which increased by 100 percent. That amounts to 6.0 months’ supply for condo apartments, 2.4 months for detached homes, and 3.6 months for Townhouses. The number of months of inventory represents the amount of time it would take to sell off current inventories at the current sales rate.
The average number of days to sell in May was 16, compared to 14 days in May 2023. The previous 5-year average is 15 days.
The President of WRAR emphasizes the importance of consulting a local REALTOR® when considering buying or selling property in the Waterloo Region. Their expertise can provide valuable insights into the current market conditions, enabling individuals to make well-informed decisions aligned with their goals and preferences.


WRAR cautions that average sale price information can help identify long-term trends but should not be to indicate that specific properties have increased or decreased in value. The average sale price is calculated based on the total dollar volume of all properties sold. Months Supply is the inventory of homes for sale at the end of a given month, divided by the average monthly closed sales from the last 12 months. Those requiring specific information on property values should contact a Waterloo Region REALTOR®. REALTORS® have their fingers on the pulse of the market. They know the questions to ask, the areas to probe and what to look for so that you get a complete picture of the property and community you’re considering.
Tags: buyers, for sale, home sales, Homes For Sale, kitchener real estate, KW Market Update, Market Update, real estate, real estate market, riz jadavji, rizsellskw.com, Royal Lepage Wolle Realty, sales representative, the riz team, Waterloo Buyers, waterloo real estate, Waterloo Sellers
Posted in Kitchener Buyers, Kitchener Sellers, Market Stats, Market Update, Real Estate News, Waterloo Buyers, Waterloo Sellers | Comments Off on Kitchener Waterloo Market Snapshot May 2024
Friday, May 3rd, 2024
Waterloo Region Sees Slight Sales Growth in April Alongside a Strong Increase in Homes for Sale
“The real estate market appeared to be well-balanced last month,” says Christal Moura, president of WRAR. “The market experienced a slight increase in home sales and moderate price fluctuations. Additionally, the number of homes for sale reached an eight-year high for the month of April, which translates to more available options for potential buyers.” read more below
If you are considering to Sell your home or Buy a home in the next short while it would be highly beneficial for you to connect with one of our Team Agents at
Do you want to know what your home is worth today? Click Below for our Online No Obligation Market Evaluation

WATERLOO REGION, ON (May 3, 2024) —In April, a total of 692 homes were sold via the Multiple Listing Service® (MLS®) System of the Waterloo Region Association of REALTORS® (WRAR). This represents an increase of 3.3% compared to the same period last year and a decline of 12.3% compared to the average number of homes sold in the previous 5 years for the same month.
“The real estate market appeared to be well-balanced last month,” says Christal Moura, president of WRAR. “The market experienced a slight increase in home sales and moderate price fluctuations. Additionally, the number of homes for sale reached an eight-year high for the month of April, which translates to more available options for potential buyers.”
Total residential sales in April included 406 detached (up 0.5 per cent from April 2023), and 137 townhouses (up 15.1 per cent). Sales also included 90 condominium units (down 5.3 per cent) and 57 semi-detached homes (up 11.8 per cent).
In April, the average sale price for all residential properties in Waterloo Region was $800,087. This represents a 0.3 per cent increase compared to April 2023 and a 0.7 per cent decrease compared to March 2024.
- The average price of a detached home was $938,478. This represents a 1.4 per cent increase from April 2023 and a decrease of 1.8 per cent compared to March 2024.
- The average sale price for a townhouse was $660,945. This represents a 0.5 per cent decrease from April 2023 and a decrease of 0.8 per cent compared to March 2024.
- The average sale price for an apartment-style condominium was $485,556. This represents a decrease of 1.1 per cent from April 2023 and an increase of 0.5 per cent compared to March 2024.
- The average sale price for a semi was $665,936. This represents a decrease of 3.0 per cent compared to April 2023 and a decrease of 2.1 per cent compared to March 2024.


WRAR cautions that average sale price information can help identify long-term trends but should not be to indicate that specific properties have increased or decreased in value. The average sale price is calculated based on the total dollar volume of all properties sold. Months Supply is the inventory of homes for sale at the end of a given month, divided by the average monthly closed sales from the last 12 months. Those requiring specific information on property values should contact a Waterloo Region REALTOR®. REALTORS® have their fingers on the pulse of the market. They know the questions to ask, the areas to probe and what to look for so that you get a complete picture of the property and community you’re considering.
Tags: buyers, for sale, home for sale, KW Market Update, Market Update, real estate, real estate market, riz jadavji, rizsellskw.com, Royal Lepage Wolle Realty, sales representative, the riz team, Waterloo Buyers, waterloo real estate, Waterloo Sellers
Posted in Kitchener Buyers, Kitchener Sellers, Market Stats, Market Update, Real Estate News, Waterloo Buyers, Waterloo Sellers | Comments Off on Kitchener Waterloo Market Snapshot April 2024
Tuesday, March 5th, 2024
Waterloo Region Home Sales Sluggish in February, Prices Steady
If you are considering to Sell your home or Buy a home in the next short while it would be highly beneficial for you to connect with one of our Team Agents at
Do you want to know what your home is worth today? Click Below for our Online No Obligation Market Evaluation
Tags: buyers, for sale, Homes For Sale, KW Market Update, Market Update, real estate, real estate market, realtor, riz jadavji, rizsellskw.com, Royal Lepage Wolle Realty, sales representative, the riz team, Waterloo Buyers, waterloo real estate, Waterloo Sellers
Posted in Kitchener Buyers, Kitchener Sellers, Market Stats, Market Update, Real Estate News, Realtor Tips, Waterloo Buyers, Waterloo Sellers | Comments Off on Kitchener Waterloo Market Snapshot February 2024
Friday, February 2nd, 2024
Waterloo Region’s Housing Market Shows Signs of Improvement in January
If you are considering to Sell your home or Buy a home in the next short while it would be highly beneficial for you to connect with one of our Team Agents at
Do you want to know what your home is worth today? Click Below for our Online No Obligation Market Evaluation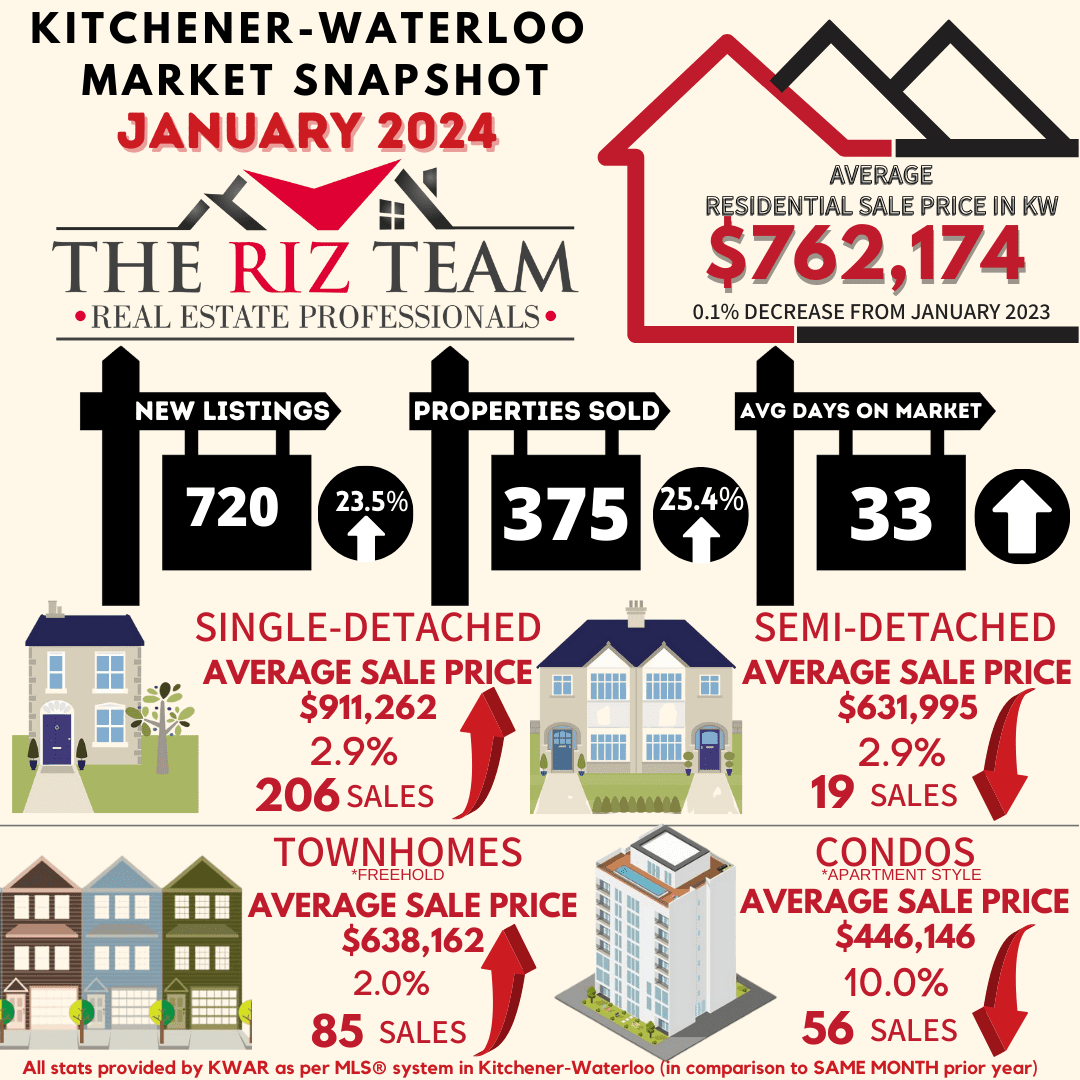
“We are optimistic that this year will have more stability than last,” says Moura. “With the Bank of Canada holding steady at a 5.0% benchmark interest rate, they recognize the overall economy has slowed down. However, housing is a key metric, and we expect the Bank to maintain a balanced response so long as housing continues with moderate growth in 2024 rather than any dramatic increases.”
President Moura points out that navigating shifting markets is a challenge and encourages consumers to work with a local REALTOR to ensure they receive the depth of local market knowledge required to protect their interests.
There was 720 new listings added to the MLS® System in Waterloo Region last month, an increase of 23.5 per cent compared to January last year and a 3.9 per cent decrease compared to the previous ten-year average for January.
The total number of homes available for sale in active status at the end of January was 855 an increase of 33.4 per cent compared to January of last year and 1.2 per cent below the previous ten-year average of 865 listings for January.
At the end of January, there were 1.5 months of inventory, a 50.0 percent increase compared to last year and 15.4 percent above the previous 10-year average. The number of months of inventory represents how long it would take to sell off current inventories at the current sales rate.
“With the exception of condo apartment property types, we saw mostly yearly and monthly price gains across the housing types,” says Moura. “This is because there is more supply in the condo segment (2.8 months) compared to the other property types.”
The average number of days to sell in January was 33, compared to 25 days in January 2023. The previous 5-year average is 20 days.
These statistics provide a snapshot of the real estate market in the Waterloo Region in January, showing both positive and challenging aspects for buyers and sellers. WRAR encourages buyers to reach out to local Realtors for valuable insights about the current state of the local market and to receive tailored advice based on their specific needs.
View our HPI tool here to learn more: https://wrar.ca/hpi/
WRAR cautions that average sale price information can help identify long-term trends but should not be to indicate that specific properties have increased or decreased in value. The average sale price is calculated based on the total dollar volume of all properties sold. Months Supply is the inventory of homes for sale at the end of a given month, divided by the average monthly closed sales from the last 12 months. Those requiring specific information on property values should contact a Waterloo Region REALTOR®. REALTORS® have their fingers on the pulse of the market. They know the questions to ask, the areas to probe and what to look for so that you get a complete picture of the property and community you’re considering.
Tags: buyers, for sale, kitchener for sale, kitchener real estate, kitchener-waterloo, kitchener-waterloo association of realtors, real estate market, riz jadavji, Royal Lepage Wolle Realty, sales representative, the riz team, Waterloo Buyers, Waterloo Homes, waterloo real estate, Waterloo Sellers
Posted in Kitchener Buyers, Kitchener Sellers, Market Stats, Market Update, Real Estate News, Realtor Tips, Waterloo Buyers, Waterloo Sellers | Comments Off on Kitchener Waterloo Market Snapshot January 2024
Friday, January 5th, 2024
Annual Home Sales Down Significantly in Waterloo Region in 2023
If you are considering to Sell your home or Buy a home in the next short while it would be highly beneficial for you to connect with one of our Team Agents at
Do you want to know what your home is worth today? Click Below for our Online No Obligation Market Evaluation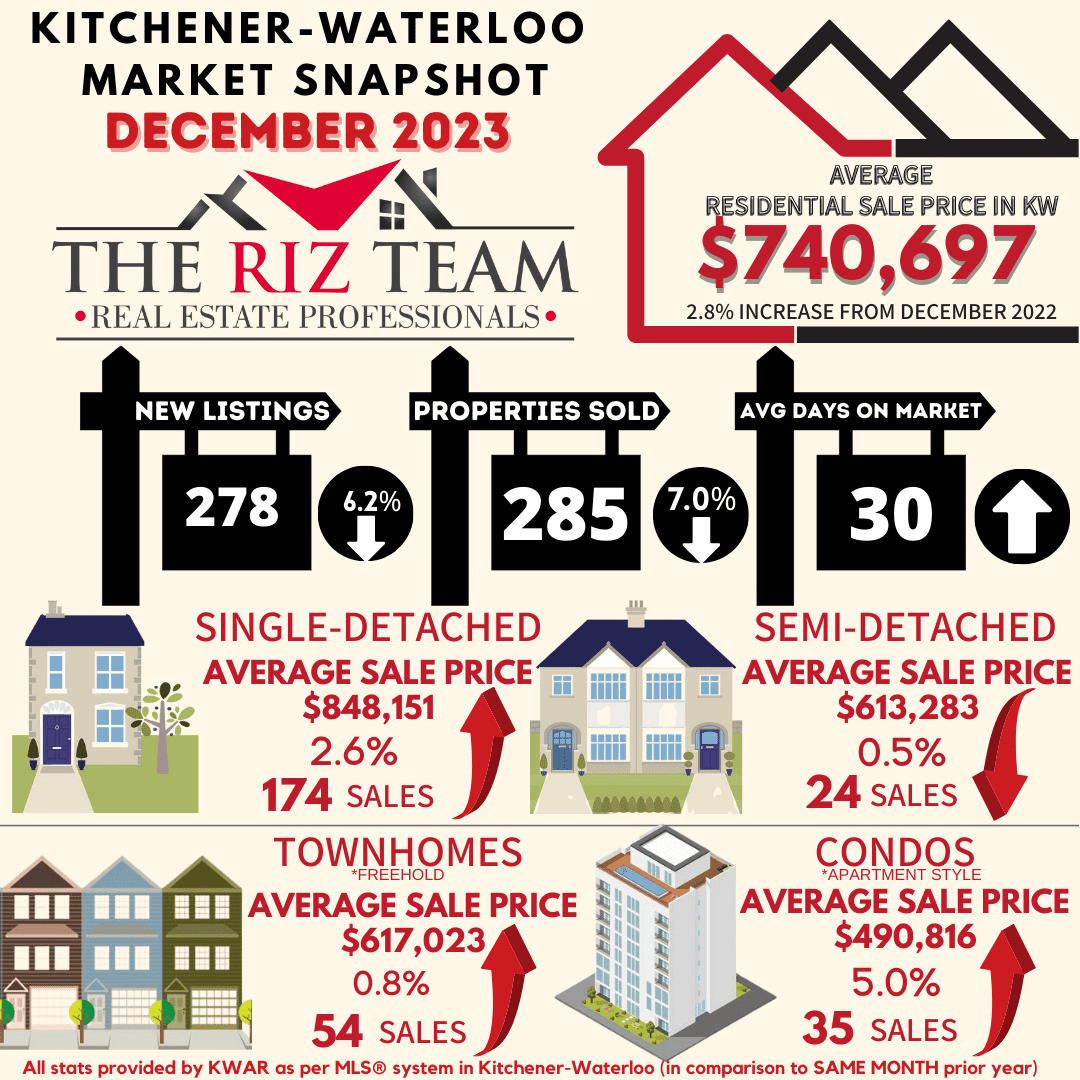
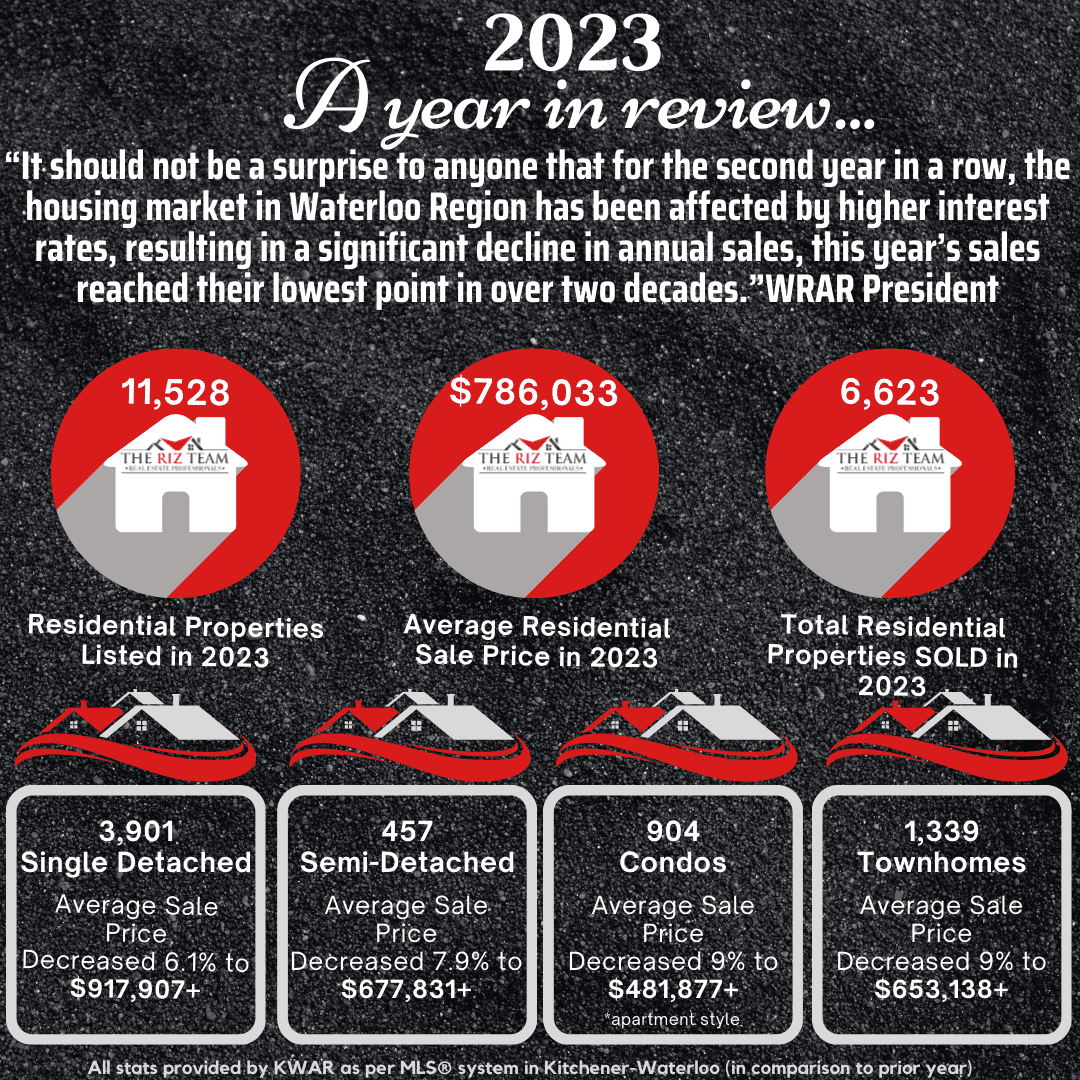
WATERLOO REGION, ON (January 5, 2024) — There were 6,623 homes sold through the Multiple Listing Service® (MLS®) System of the Waterloo Region Association of REALTORS® (WRAR) in 2023, a decrease of 14.8 per cent compared to 2022, and a decline of 23.2 per cent compared to the previous 5-year average for annual sales.
On a monthly basis, there were 285 homes sold in December, a decrease of 0.7 per cent compared to December 2022, and 25.6 per cent below the previous 5-year average for the month.
“It should not be a surprise to anyone that for the second year in a row, the housing market in Waterloo Region has been affected by higher interest rates, resulting in a significant decline in annual sales,” says Christal Moura, President of WRAR. “This year’s sales reached their lowest point in over two decades.”
According to Moura, the trend observed in December reflects the overall slowdown in home sales throughout the year, with sales falling behind historical levels. The last time annual sales in Waterloo Region recorded fewer than 7,000 units was the year 2000.
Total residential sales in December included 172 detached (up 3.6 per cent from December 2022), and 54 townhouses (down 6.9 per cent). Sales also included 35 condominium units (up 2.9 per cent) and 24 semi-detached homes (down 4.0 per cent).
For 2023, total residential sales included 3,901 detached (down 17.0 per cent), and 1,339 townhouses (down 6.5 per cent). Sales also included 904 condominium units (down 9.2 per cent) and 457 semi-detached homes (down 26.6 per cent).
In December, the average sale price for all residential properties in Waterloo Region was $740,697. This represents a 2.8 per cent increase compared to December 2022 and a 2.1 per cent decrease compared to November 2023.
- The average price of a detached home was $848,151. This represents a 2.6 per cent increase from December 2022 and a decrease of 4.7 per cent compared to November 2023.
- The average sale price for a townhouse was $617,023. This represents a 0.8 per cent increase from December 2022 and an increase of 1.2 per cent compared to November 2023.
- The average sale price for an apartment-style condominium was $490,816. This represents a 5.0 per cent increase from December 2022 and an increase of 9.0 per cent compared to November 2023.
- The average sale price for a semi was $613,283. This represents a decrease of 0.5 per cent compared to December 2022 and a decrease of 0.5 per cent compared to November 2023.
“Waterloo Region’s slowing housing market echoes the overall slowdown we are seeing in the broader economy,” says Moura.”
There were 287 new listings added to the MLS® System in the Waterloo Region last month, a decrease of 6.2 per cent compared to December of last year and a 17.9 per cent decrease compared to the previous ten-year average for December.
In 2023, 11,528 new listings were added to WRAR’s MLS® System, a decrease of 14.4 per cent compared to 2022, and a 4.4 per cent decrease compared to the previous ten-year annual average.
The total number of homes available for sale in active status at the end of December was 779, an increase of 36.0 per cent compared to December of last year and 5.8 per cent above the previous ten-year average of 736 listings for December.
The number of months of inventory is up 55.6 per cent compared to December of last year, but still historically low at 1.4 months. Between 2010 and 2015, December’s rolling 12-month average was 3.5 months. The number of months of inventory represents how long it would take to sell off current inventories at the current sales rate.
The average number of days to sell in December was 30, compared to 25 days in December 2022. The previous 5-year average is 23 days.
The average days to sell in 2023 was 19 days, compared to 14 days in 2022 and a previous 5-year average of 18 days.
“While the dream of homeownership is alive, it is not quite well,” says Moura. “Housing continues to be less accessible to too many people in our region. This speaks to the pressing need for not just more housing to be built, but housing that spans all forms and economic strata, to ensure everyone has a suitable place to call home.”
Those requiring specific information on property values should contact a local REALTOR®. Working with a Realtor is the best way to get a complete picture of the property and community you are considering.
View our HPI tool here to learn more: https://wrar.ca/hpi/
Tags: buyers, for sale, home sales, kitchener, Kitchener Buyers, kitchener real estate, kitchener-waterloo, kitchener-waterloo association of realtors, Market Update, royal lepage, the riz team, Waterloo Buyers, Waterloo Homes, waterloo real estate, waterloo realtor, Waterloo Sellers, www.rizsellskw.com
Posted in Kitchener Buyers, Kitchener Sellers, Market Stats, Market Update, Real Estate News, Realtor Tips, Waterloo Buyers, Waterloo Sellers | Comments Off on Kitchener Waterloo Market Snapshot & Yearly Summary December 2023


")
")


