Kitchener Waterloo Market Snapshot June 2025
Friday, July 4th, 2025June Housing Stats Point to More Balanced Market in Waterloo Region
“While home sales in June were relatively stable year-over-year, we’re seeing a more balanced market emerge in Waterloo Region. What’s particularly notable is the increase in condominium sales – up over 34% – suggesting a cohort of buyers looking for more affordable housing options,” says Christal Moura, spokesperson for the Waterloo Region market. “While more listings are coming to market, properties are taking a little longer to sell, giving buyers more time to make informed decisions during their home search.
If you are considering to SELL your home or BUY a home in the next short while,
it would be highly beneficial for you to connect with one of our Team Agents at
The Riz Team
Do you want to know what your home is worth today? Click Below for our Online No Obligation Market Evaluation:
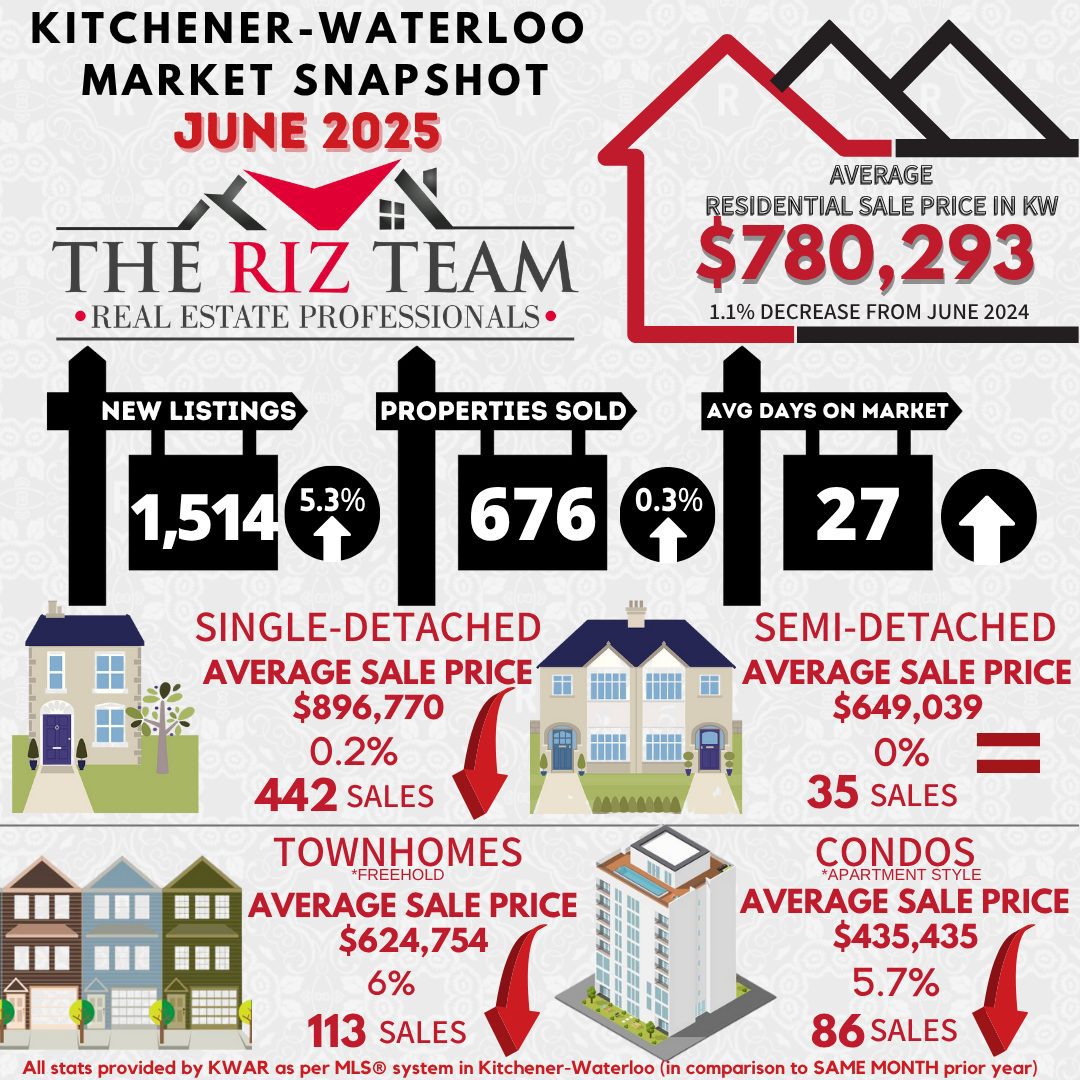
WATERLOO REGION, ON (July 4, 2025) —In June, a total of 676 homes were sold in the Waterloo Region via the Multiple Listing Service® (MLS®) System of the Cornerstone Association of REALTORS® (Cornerstone). This represents a 0.3 per cent increase compared to the same period last year and a decline of 21.7 per cent compared to the average number of homes sold in the previous ten years for the same month.
“While home sales in June were relatively stable year-over-year, we’re seeing a more balanced market emerge in Waterloo Region. What’s particularly notable is the increase in condominium sales – up over 34% – suggesting a cohort of buyers looking for more affordable housing options,” says Christal Moura, spokesperson for the Waterloo Region market. “While more listings are coming to market, properties are taking a little longer to sell, giving buyers more time to make informed decisions during their home search.
Total residential sales in June included 442 detached homes (up 5.6 per cent from June 2024), and 113 townhouses (down 17.4 per cent). Sales also included 86 condominium units (up 34.4 per cent) and 35 semi-detached homes (down 25.4 per cent).
In June, the average sale price for all residential properties in Waterloo Region was $780,293. This represents a 1.1 per cent decrease compared to June 2024 and a 1.2 per cent decrease compared to May 2025.
- The average price of a detached home was $896,770. This represents a 0.2 per cent decrease from June 2024 and a decrease of 1.4 per cent compared to May 2025.
- The average sale price for a townhouse was $624,754. This represents a 6.0 percent decrease from June 2024 and a 1.6 percent decrease compared to May 2025.
- The average sale price for an apartment-style condominium was $435,435. This represents a 5.7 per cent decrease from June 2024 and an increase of 0.7 per cent compared to May 2025.
- The average sale price for a semi was $649,039, on par with June 2024 and a 0.5 per cent decrease compared to May 2025.
CORNERSTONE cautions that average sale price information can help establish long-term trends but does not indicate specific properties have increased or decreased in value. The MLS® Home Price Index (HPI) provides the best way to gauge price trends because averages are strongly distorted by changes in the mix of sales activity from one month to the next.
| MLS® Home Price Index Benchmark Price (HPI) | ||||||
| Kitchener-Waterloo | Cambridge | |||||
| Benchmark Type: | June 2025 | Monthly % Change | Yr./Yr. % Change | June 2025 | Monthly % Change | Yr./Yr. % Change |
| Composite | $686,100 | -2.3 | -7.5 | $723,400 | -1.5 | -4.2 |
| Single Family | $805,600 | -2.7 | -5.5 | $767,300 | -1.5 | -3.1 |
| Townhouse | $568,200 | -2.7 | -9.3 | $623,400 | -1.5 | -4.5 |
| Apartment | $417,900 | 1.5 | -8.3 | $458,200 | -0.8 | -6.6 |

“Looking at the HPI benchmark prices, we’re seeing a market that’s adjusting to changing economic conditions. While we’re experiencing some year-over-year price decreases, Waterloo Region’s market fundamentals remain strong, supported by a diversified economy and the region’s appeal as a place of residence for both families and businesses,” says Moura. “These market shifts underscore the importance of working with a professional REALTOR® who can provide crucial guidance on pricing strategies, market timing, and negotiation. Their expertise helps both buyers and sellers adjust their expectations and make informed decisions in this evolving market environment.”
There were 1,514 new listings added to the MLS® System in Waterloo Region last month, an increase 5.3 per cent compared to June last year and a 15.1 per cent increase compared to the previous ten-year average for June.
The average time to sell a home in June was 27 days, compared to 24 days in the previous month. In June 2024, it took 18 days for a home to sell, and the five-year average was 15 days.
View our HPI tool here to learn more: https://www.cornerstone.inc/stats/