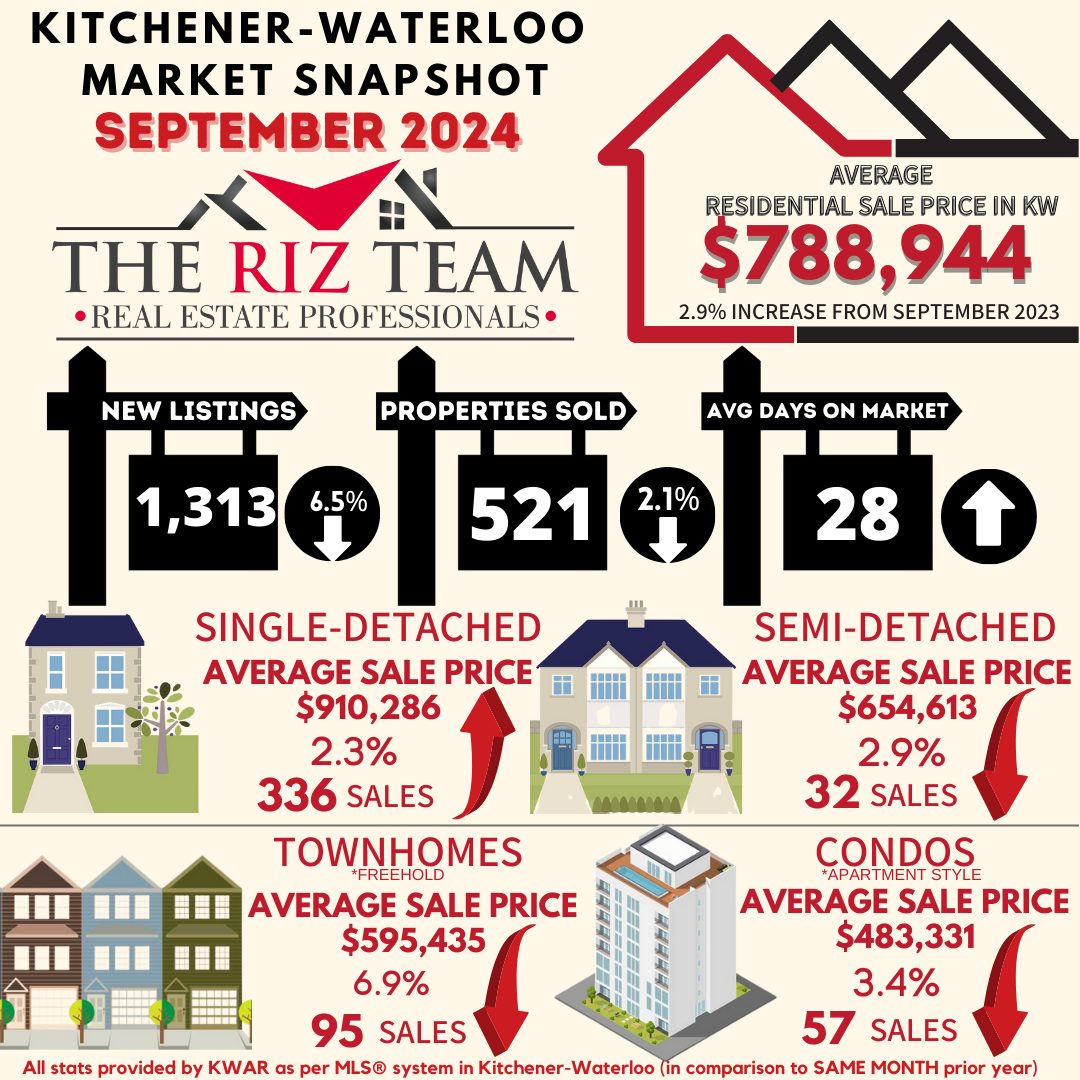
The Riz Team Blog

Posts Tagged ‘KW Market Update’

Kitchener Waterloo Market Snapshot January 2023

Friday, February 3rd, 2023

Number of Home Sales in January Exceptionally Low

If you are considering to Sell your home or Buy a home in the next short while it would be highly beneficial for you to connect with one of our Team Agents at

The Riz Team

Do you want to know what your home is worth today? Click Below for our Online No Obligation Market EvaluationClick Here

WATERLOO REGION, ON (February 3, 2023) —The number of homes sold last month through the Multiple Listing Service® (MLS®) System of the Waterloo Region Association of REALTORS® (WRAR) totalled 297 units, a decrease of 41.9 per cent compared to January 2022 and 31.0 per cent below the previous 5-year average for the month.

“Waterloo Region’s home sales in January were at their second lowest of any single month in well over a decade,” says Megan Bell, president of WRAR. “Home sales tend to be sluggish in January, and while we expected activity to ease to reflect economic challenges, this was a larger drop than originally anticipated.”

Total residential sales in January included 176 detached (down 38.5 per cent from January 2022), and 61 townhouses (down 44.5 per cent). Sales also included 43 condominium units (down 48.2 per cent) and 17 semi-detached homes (down 46.9 per cent).

In January, the average sale price for all residential properties in Waterloo Region was $764,063. This represents a 20.1 per cent decrease compared to January 2022 and a 5.9 per cent increase compared to December 2022.

  • The average price of a detached home was $888,487. This represents a 21.5 per cent decrease from January 2022 and an increase of 7.6 per cent compared to December 2022.
  • The average sale price for a townhouse was $625,831. This represents a 26.1 per cent decrease from January 2022 and an increase of 2.2 per cent compared to December 2022.
  • The average sale price for an apartment-style condominium was $495,753. This represents a decrease of 9.3 per cent from January 2022 and an increase of 6.1 per cent compared to December 2022.
  • The average sale price for a semi was $650,588. This represents a decrease of 21.5 per cent compared to January 2022 and an increase of 5.5 per cent compared to December 2022.
january average sales price by property type

WRAR cautions that average sale price information can be useful in establishing long-term trends but should not be used as an indicator that specific properties have increased or decreased in value. The MLS® Home Price Index (HPI) provides the best way to gauge price trends because averages are strongly distorted by changes in the mix of sales activity from one month to the next.

MLS® Home Price Index Benchmark Price

Kitchener-Waterloo Cambridge
Benchmark Type: January 2023 Monthly % Change Yr./Yr. % Change January 2023 Monthly % Change Yr./Yr. % Change
Composite $705,100 -1.2 -23.7

$731,000

2.4 -21.3
Detached $789,900 -1.4 -25.9 $757,200 2.9 -23.2
Townhouse $583,100 -1.8 -17.6 $638,300 -0.2 -8.0
Apartment $481,300 2.0 -5.1 $487,600 -1.9 -4.3

“On a monthly basis, we saw the average sale price increase across all property types in January,” says Bell. “I’m also noticing more multiple offers happening, especially on detached homes that are priced under eight hundred thousand dollars.”

Meanwhile, the Bank of Canada again increased interest rates at the end of January by 25 basis points to 4.5 per cent. “While not a huge increase, the continuance of interest rate hikes is an ongoing factor in the reduction of home sales within the market,” says Bell.

There were 579 new listings added to the MLS® System in Waterloo Region last month, a decrease of 13.3 per cent compared to January of last year and a 28.7 per cent decrease compared to the previous ten-year average for January.

The total number of homes available for sale in active status at the end of January was 651, an increase of 167.9 per cent compared to January of last year and 34.7 per cent below the previous ten-year average of 998 listings for January.

The number of months of inventory is up 233.3 per cent compared to January of last year, but still historically low at one month. Between 2011 and 2015, January’s average months of inventory was 3.0 months. The number of months of inventory represents how long it would take to sell off current inventories at the current sales rate.

The average number of days to sell in January was 25, compared to 9 days in January 2022. The previous 5-year average is 21 days.

WRAR’s president says, “The demographic of buyers is also shifting as we observe fewer buyers coming from the GTA into the region.  While there are still some, it is nowhere like it was last January. These and other shifting influences mean it has never been more important for buyers and sellers to work with a local REALTOR® to help provide expertise during the homebuying and selling process.”

Affordability, combined with ongoing supply constraints, makes it difficult for buyers to navigate the continuous market changes while sellers also need to adjust to the evolving circumstances. Those requiring specific information on property values should contact a local REALTOR®. Working with a Realtor is the best way to get a complete picture of the property and community you are considering.

View our HPI tool here to learn more: https://wrar.ca/hpi/

Click on any of the graphs below for an interactive view.

jan average sales prce
jan average sales townships
sales by property type
monthly supply of homes for sale
median sales price property type
average sales price by property type
average days on market

WRAR cautions that average sale price information can help identify long-term trends but should not be to indicate that specific properties have increased or decreased in value. The average sale price is calculated based on the total dollar volume of all properties sold. Months Supply is the inventory of homes for sale at the end of a given month, divided by the average monthly closed sales from the last 12 months. Those requiring specific information on property values should contact a Waterloo Region REALTOR®. REALTORS® have their fingers on the pulse of the market. They know the questions to ask, the areas to probe and what to look for so that you get a complete picture of the property and community you’re considering.


Kitchener-Waterloo Market Snapshot May 2022

Friday, June 3rd, 2022

LISTINGS INCREASE WHILE HOME SALES SLOW IN MAY

If you are considering to Sell your home or Buy a home in the next short while it would be highly beneficial for you to connect with one of our Team Agents at

The Riz Team

Do you want to know what your home is worth today? Click Below for our Online No Obligation Market Evaluation

There were 661 residential homes sold through the Multiple Listing Service® System (MLS® System) of the Kitchener-Waterloo Association of REALTORS® (KWAR) in May, a decrease of 22.7 per cent compared to the same month last year, and 5.5 per cent below the previous 5-year average.

“The increase by the Bank of Canada to the key interest rate in April had the predictable result of knocking some buyers down if not out of the market in May,” says Megan Bell, President of KWAR. “While the impact to prices is small, it has had a critical impact on some buyers and what they can now afford.”

Total residential sales in May included 404 detached (down 16.7 per cent from May 2021), and 115 townhouses (down 38.5 per cent). Sales also included 95 condominium units (down 12.0 per cent) and 47 semi-detached homes (down 36.5 per cent).

In May, the average sale price for all residential properties in the Kitchener-Waterloo area was $875,194. This represents a 18.3 per cent increase over May 2021 and a 3.5 per cent decrease compared to April 2022.

  • The average price of a detached home was $1,016,834. This represents a 17.0 per cent increase from May 2021 and a decrease 4.2 per cent compared to April 2022.
  • The average sale price for a townhouse was $708,722. This represents a 17.7 per cent increase from May 2021 and a decrease of 7.2 per cent compared to April 2022.
  • The average sale price for an apartment-style condominium was $545,825. This represents an increase of 19.7 per cent from May 2021 and a decrease of 9.1 per cent compared to April 2022.
  • The average sale price for a semi was $730,768. This represents an increase of 10.7 per cent compared to May 2021 and a decrease of 7.0 per cent compared to April 2022.

KWAR cautions that average sale price information can be useful in establishing long-term trends but should not be used as an indicator that specific properties have increased or decreased in value. The MLS® Home Price Index (HPI) provides the best way to gauge price trends because averages are strongly distorted by changes in the mix of sales activity from one month to the next.

The MLS® HPI composite benchmark price for all residential properties in Kitchener-Waterloo was $848,600 in May. This represents a 15.1 per cent increase over May 2021 and a 4.7 per cent decrease compared to April 2022.


  • The benchmark price for a detached home was $945,800. This represents a 14.6 per cent increase from May 2021 and 4.9 per cent decrease compared to April 2022.

“With the announcement from the Bank of Canada about another interest rate hike this week we may see a   resurgence of buyers who have locked in at a lesser rate, but as borrowing costs continue to increase, we should expect demand will continue to soften, particularly in the more entry-level segment of the market,” says Bell.

There were 1,422 new listings added to the MLS® System in KW and area last month, an increase of 33.9 per cent compared to May of last year, and a 40.4 per cent increase compared to the previous ten-year average for May.

The total number of homes available for sale in active status at the end of May was 902, an increase of 98.2 per cent compared to May of last year, and 28.8 per cent below the previous ten-year average of 1267 listings for May.

The number of months of inventory increased to 1.6 months in May from 1.2 months in April. While inventory is still at historic lows, this is the highest it’s been since September 2019. The number of months of inventory represents how long it would take to sell off current inventories at the current rate of sales.

The average number of days to sell in May was 11 days, compared to 9 days in May 2021. The previous 5-year average is 16 days.

Those requiring specific information on property values should contact a local REALTOR®.  Working with a Realtor is the best way to get a complete picture of the property and community you are considering.

View our HPI tool here to learn more: https://kwar.ca/hpi-dashboard

**click on any chart for an interactive view**

Historical Sales By Property Type

Months Supply of Homes for Sale

Historical Median Sales Price – By Property Type

Historical Average Sales Price – By Property Type

Average Days on Market Chart

KWAR cautions that average sale price information can be useful in establishing long-term trends but should not be used as an indicator that specific properties have increased or decreased in value. The average sale price is calculated based on the total dollar volume of all properties sold. Months Supply is the inventory of homes for sale at the end of a given month, divided by the average monthly closed sales from the last 12 months Those requiring specific information on property values should contact a local REALTOR®. REALTORS® have their fingers on the pulse of the market. They know the questions to ask, the areas to probe and what to look for so that you get a complete picture of the property and community you’re considering.

Kitchener-Waterloo Market Snapshot January 2022

Thursday, February 3rd, 2022

NUMBER OF HOME SALES IN JANUARY SET NEW RECORD

If you are considering to Sell your home or Buy a home in the next short while it would be highly beneficial for you to connect with one of our Team Agents at

The Riz Team 

Do you want to know what your home is worth today? Click Below for our Online No Obligation Market Evaluation

PRICES CONTINUE TO ESCALATE

KITCHENER-WATERLOO, ON (Feb 3, 2022) –– The 402 residential homes sold last month through the Multiple Listing Service® (MLS® System) of the Kitchener-Waterloo Association of REALTORS® (KWAR), set a new record high for January. On a year-over-year basis January’s sales were up 12.3 per cent; compared to last month they were up 16.5 per cent. The previous ten-year average number of residential sales for January is 291.

“While it’s a new year, the song remains the same with homebuying demand outstripping supply in January,” said Megan Bell, President of KWAR. “This has resulted in price jumps across all property types.”

Total residential sales in January included 217 detached (up 4.8 per cent from January 2021), and 74 condominium units (up 1.4 per cent). Sales also included 24 semi-detached homes (up 14.3 per cent) and 87 townhouses (up 52.6 per cent).

In January, the average sale price for all residential properties in the Kitchener-Waterloo area was $955,665. This represents a 37.3 per cent increase over January 2021 and a 13.6 per cent increase compared to December 2021.

  • The average price of a detached home was $1,152,707. This represents a 35.5 per cent increase from January 2021 and an increase of 12.9 per cent compared to December 2021.
  • The average sale price for an apartment-style condominium was $538,239. This represents an increase of 42.2 per cent from January 2021 and an increase of 7.7 per cent compared to December 2021.
  • The average sale price for a townhouse was $836,306. This represents a 47.9 per cent increase from January 2021 and an increase of 16.7 per cent compared to December 2021.
  • The average sale price for a semi was $849,845. This represents an increase of 35.6 per cent compared to January 2021 and an increase of 10.3 per cent compared to December 2021.

KWAR cautions that average sale price information can be useful in establishing long-term trends but should not be used as an indicator that specific properties have increased or decreased in value. The MLS® Home Price Index (HPI) provides the best way to gauge price trends because averages are strongly distorted by changes in the mix of sales activity from one month to the next.

The MLS® HPI composite benchmark price for all residential properties in Kitchener-Waterloo was $924,900 in January. This represents a 37.1 per cent increase over January 2021 and a 8.6 per cent increase compared to December 2021.

  • The benchmark price for a detached home was $1,038,200. This represents a 39.7 per cent increase from January 2021 and 9.8 per cent increase compared to December 2021.
  • The benchmark price for an apartment-style condominium was $437,700. This represents a 25.9 per cent increase from January 2021 and a 6.1 per cent increase compared to December 2021.
  • The benchmark price for a townhouse is $682,200. This represents a 40.7 per cent increase from January 2021 and a 6.1 per cent increase compared to December 2021.

Bell notes it is anticipated that the Bank of Canada will raise interest rates at their next scheduled announcement in mid-March. “I think we can expect over the course of the next few weeks, buyers who have yet to be priced out of the market will be looking to lock in a mortgage and scoop up any homes that come onto the market.”

There were 514 new listings added to the MLS® System in KW and area last month, an increase of 17.4 per cent compared to January of last year, and a 20.1 per cent decrease compared to the previous ten-year average for January.

The total number of homes available for sale in active status at the end of January was 174, a decrease of 22.0 per cent compared to January of last year, and 80.3 per cent below the previous ten-year average of 883 listings for January.

The number of months of inventory remained extremely low in January at 0.3. Inventory has been at half a month or less since July of 2021. The number of months of inventory represents how long it would take to sell off current inventories at the current rate of sales.

The average number of days to sell in January was 9 days, compared to 16 days in January 2021 and a previous 5-year average of 24 days.

Those requiring specific information on property values should contact a local REALTOR®.  Working with a Realtor is the best way to get a complete picture of the property and community you are considering.

View our HPI tool here to learn more: https://kwar.ca/hpi-dashboard

Historical Sales By Property Type

Months Supply of Homes for Sale

Historical Median Sales Price – By Property Type

Historical Average Sales Price – By Property Type

Average Days on Market

KWAR cautions that average sale price information can be useful in establishing long term trends but should not be used as an indicator that specific properties have increased or decreased in value. The average sale price is calculated based on the total dollar volume of all properties sold. Months Supply is the inventory of homes for sale at the end of a given month, divided by the average monthly closed sales from the last 12 months Those requiring specific information on property values should contact a local REALTOR®. REALTORS® have their fingers on the pulse of the market. They know the questions to ask, the areas to probe and what to look for so that you get a complete picture of the property and community you’re considering.

Kitchener-Waterloo Market Snapshot December 2021

Wednesday, January 5th, 2022

Average Price of a Detached Home Reaches Million-dollar Milestone in December

HOME SALES IN 2021 SMASHED LAST YEAR’S RECORD-BREAKING TOTAL BY OVER 1000 UNITS

The 7,581 residential homes sold through the Multiple Listing System (MLS® System) of the Kitchener-Waterloo Association of REALTORS® (KWAR) in 2021 represent an increase of 18.3 per cent compared to last year’s record-setting number of sales that ended the year 2020.

On a monthly basis, there were 344 residential homes sold last month, a decrease of 1.7 percent compared to the same month last year.

“Home sales in 2021 have absolutely smashed last year’s record by more than 1,000 units,” says KWAR’s president, Megan Bell. “While this is a good time to sell your home, it remains a tremendously difficult market for buyers. Affordability for all types of housing within our community continues to be a concern which we expect to continue throughout 2022.”

Total residential sales in December included 177 detached (down 12.4 per cent from December 2020), and 56 condominium units (down 11.1 per cent). Sales also included 23 semi-detached homes (up 9.5 per cent) and 88 townhouses (up 37.5 per cent).

For 2021, total residential sales included 4,272 detached (up 10.8 per cent), and 1,127 condominium units (up 43.4 per cent). Sales also included 578 semi-detached homes (up 31.1 per cent) and 1,602 townhouses (up 20.9 per cent).

In December, the average sale price for all residential properties in the Kitchener-Waterloo area was $842,014. This represents a 32.5 per cent increase over December 2020 and a 2.5 per cent increase compared to November 2021.

  • The average price of a detached home was $1,021,353. This represents a 34.7 per cent increase from December 2020 and an increase of 3.4 per cent compared to November 2021.
  • The average sale price for an apartment-style condominium was $500,352. This represents an increase of 30.6 per cent from December 2020 and an increase of 1.0 per cent compared to November 2021.
  • The average sale price for a townhouse was $717,475. This represents a 39.4 per cent increase from December 2020 and an increase of 2.1 per cent compared to November 2021.
  • The average sale price for a semi was $770,246. This represents an increase of 33.5 per cent compared to December 2020 and an increase 7.3 per cent compared to November 2021.

On a year-to-date basis, the average sale price for all residential properties in the Kitchener-Waterloo area increased 25.8 per cent to $770,596 compared to 2020.

  • The year-to-date average price of a detached home was $920,726. This represents a 28.0 per cent increase compared to 2020.
  • The year-to-date average sale price for an apartment-style condominium was $448,208. This represents an increase of 17.3 compared to 2020
  • The year-to-date average sale price for a townhouse was $632,875. This represents an increase of 34.9 per cent compared to 2020.
  • The year-to-date average sale price for a semi was $673,543. This represents an increase of 29.4 per cent compared to 2020.

KWAR cautions that average sale price information can be useful in establishing long-term trends but should not be used as an indicator that specific properties have increased or decreased in value. The MLS® Home Price Index (HPI) provides the best way to gauge price trends because averages are strongly distorted by changes in the mix of sales activity from one month to the next.

The MLS® HPI composite benchmark price for all residential properties in Kitchener-Waterloo was $851,700 in December. This represents a 32.1 per cent increase over December 2020 and a 3.2 per cent increase compared to November 2021.

  • The benchmark price for a detached home was $945,600. This represents a 33.5 per cent increase from December 2020 and 3.3 per cent increase compared to November 2021.
  • The benchmark price for an apartment-style condominium was $412,700. This represents a 21.1 per cent increase from December 2020 and a 3.7 per cent increase compared to November 2021.
  • The benchmark price for a townhouse is $647,000. This represents a 40.0 per cent increase from December 2020 and a 3.0 per cent increase compared to November 2021.

There were 291 new listings added to the MLS® System in KW and area last month, an increase of 1.7 per cent compared to December of last year, and a 14.6 per cent increase compared to the previous ten-year average for December.

On a year-to-date basis, there were 9,040 new listings added to the MLS® System in KW and area in 2021, an increase of 11.5 per cent compared to 2020, and a 3.8 per cent increase compared to the previous ten-year annual average.

The total number of homes available for sale in active status at the end of December was 104, a decrease of 45.3 per cent compared to December of last year, and 85.7 per cent below the previous ten-year average of 727 listings for December.

The number of months of inventory touched an all time low of 0.2 in December. Inventory has settled at under 1 month for fourteen consecutive months. The number of months of inventory represents how long it would take to sell off current inventories at the current rate of sales.

“Supply not keeping up with demand was a steady refrain in 2021, and unfortunately I expect that will continue to be the case in the year ahead,” says Bell. “We need all levels of government working together to bring more supply into the housing market.”

The average number of days to sell in December stayed at 10 days, compared to 16 days in December 2020 and a previous 5-year average of 28 days.

The average days to sell in 2021 was 10 days, compared to 16 days in 2020 and a previous 5-year average of 22 days.

Those requiring specific information on property values should contact a local REALTOR®.  Working with a Realtor is the best way to get a complete picture of the property and community you are considering.

View our HPI tool here to learn more: https://kwar.ca/hpi-dashboard

Historical Sales By Property Type


Months Supply of Homes for Sale


Historical Median Sales Price – By Property Type

Historical Average Sales Price – By Property Type

Average Days on Market

KWAR cautions that average sale price information can be useful in establishing long term trends but should not be used as an indicator that specific properties have increased or decreased in value. The average sale price is calculated based on the total dollar volume of all properties sold. Months Supply is the inventory of homes for sale at the end of a given month, divided by the average monthly closed sales from the last 12 months Those requiring specific information on property values should contact a local REALTOR®. REALTORS® have their fingers on the pulse of the market. They know the questions to ask, the areas to probe and what to look for so that you get a complete picture of the property and community you’re considering.

Kitchener-Waterloo Market Snapshot November 2021

Friday, December 3rd, 2021

A NEW RECORD HIGH FOR NUMBER OF HOME SALES IN NOVEMBER AND AN ALL-TIME RECORD LOW SUPPLY READING

KITCHENER-WATERLOO, ON (December 3, 2021) –– There were 597 residential homes sold last month through the Multiple Listing Service® (MLS® System) of the Kitchener-Waterloo Association of REALTORS® (KWAR) setting a new record high for November. Compared to the same month last year, November sales were up 4.4% and on par with last month. The previous ten-year average number of residential sales for November is 446.

“The elevated pace of home sales we’ve seen for the past year and a half showed no sign of slowing down in November,” says KWAR’s president, Megan Bell. “Despite some speculation of there being a housing market correction in store for Waterloo Region, sustained homebuying demand combined with a record low level of inventory in November produced continued price growth in the MLS® HPI benchmark price.”

Total residential sales in November included 324 detached (down 3.9 per cent from November 2020), and 106 condominium units (up 27.7 per cent). Sales also included 30 semi-detached homes (down 25 per cent) and 136 townhouses (up 21.4 per cent).

In November, the average sale price for all residential properties in the Kitchener-Waterloo area was $821,969. This represents a 28.9 per cent increase over November 2020 and a 2 per cent decrease compared to October 2021.

  • The average price of a detached home was $990,447. This represents a 31 per cent increase from November 2020 and a decrease of 0.6 per cent compared to October 2021.
  • The average sale price for an apartment-style condominium was $494,548. This represents an increase of 23.5 per cent from November 2020 and an increase of 7.1 per cent compared to October 2021.
  • The average sale price for a townhouse was $700,476. This represents a 44.8 per cent increase from November 2020 and an increase of 0.9 per cent compared to October 2021.
  • The average sale price for a semi was $717,143. This represents an increase of 27.3 per cent compared to November 2020 and a decrease of 1.3 per cent compared to October 2021.

KWAR cautions that average sale price information can be useful in establishing long-term trends but should not be used as an indicator that specific properties have increased or decreased in value. The MLS® Home Price Index (HPI) provides the best way to gauge price trends because averages are strongly distorted by changes in the mix of sales activity from one month to the next.

The MLS® HPI composite benchmark price for all residential properties in Kitchener-Waterloo was $825,000 in November. This represents a 34.1 per cent increase over November 2020 and a 2.6 per cent increase compared to October 2021.

  • The benchmark price for a detached home was $915,800. This represents a 35.8 per cent increase from November 2020 and 3.2 per cent increase compared to October 2021.
  • The benchmark price for an apartment-style condominium was $398,000. This represents a 16.7 per cent increase from November 2020 and a 2.1 per cent decrease compared to October 2021.
  • The benchmark price for a townhouse is $627,900. This represents a 45.5 per cent increase from November 2020 and a 4.0 per cent increase compared to October 2021.

“Lack of supply continues to be the refrain in November,” says Bell. “With inventory hitting an all time low it is a tough time to be house hunting right now.”

There were 605 new listings added to the MLS® System in KW and area last month, an increase of 3.2 per cent compared to November of last year, and a 14.6 per cent decrease compared to the previous ten-year average for November.

The total number of homes available for sale in active status at the end of November was 207, a decrease of 40.2 per cent compared to November of last year, and 80.7 per cent below the previous ten-year average of 1,071 listings for November.

The number of months of inventory reached an all time low of 0.3 in November. Inventory has settled at under 1 month for thirteen consecutive months. The number of months of inventory represents how long it would take to sell off current inventories at the current rate of sales.

The average number of days to sell in November stayed at 10 days, compared to 14 days in November 2020 and a previous 5-year average of 24 days.

Bell notes that while the housing market typically slows down around the holiday season, she still expects to see a busier than normal December. “There is growing anxiety out there among buyers caused by the fear of missing out against rumblings of interest rates eventually going up in the year ahead.”

Those requiring specific information on property values should contact a local REALTOR®.  Working with a Realtor is the best way to get a complete picture of the property and community you are considering.

View our HPI tool here to learn more: https://kwar.ca/hpi-dashboard

Historical Sales by Property Type 


Months Supply of Homes for Sale

Historical Median Sales Price – By Property Type

Historical Average Sales Price – By Property Type

Average Days on Market

KWAR cautions that average sale price information can be useful in establishing long term trends but should not be used as an indicator that specific properties have increased or decreased in value. The average sale price is calculated based on the total dollar volume of all properties sold. Months Supply is the inventory of homes for sale at the end of a given month, divided by the average monthly closed sales from the last 12 months Those requiring specific information on property values should contact a local REALTOR®. REALTORS® have their fingers on the pulse of the market. They know the questions to ask, the areas to probe and what to look for so that you get a complete picture of the property and community you’re considering.

Kitchener-Waterloo Market Snapshot October 2021

Wednesday, November 3rd, 2021

PRICES CONTINUE TO INCREASE WITH STRONG HOME SALES IN OCTOBER

KITCHENER-WATERLOO, ON (November 3, 2021) –– A total of 593 residential homes sold last month through the Multiple Listing Service® (MLS® System) of the Kitchener-Waterloo Association of REALTORS® (KWAR), a decrease of 11.1 per cent compared to last October and a decrease of 16.5 per cent compared to September.

“While not as red-hot as last year’s record-breaking October, it was still a higher-than-normal number of home sales for the month, and the second-highest October on record,” says KWAR’s president, Nicole Pohl. “The number of listings coming on the market can scarcely keep up with the demand for homes in Waterloo region, and the continued price growth we see in October reflects this.”

Total residential sales in October included 348 detached (down 13.2 per cent from October 2020), and 84 condominium units (down 8.7 per cent). Sales also included 40 semi-detached homes (down 9.1) and 121 townhouses (down 6.9 per cent).

In October, the average sale price for all residential properties in the Kitchener-Waterloo area was $841,764. This represents a 32.9 per cent increase over October 2020 and a 6.1 per cent increase compared to September 2021.

  • The average price of a detached home was $997,654. This represents a 34.2 per cent increase from October 2020 and an increase of 3.5 per cent compared to September 2021.
  • The average sale price for an apartment-style condominium was $464,738. This represents an increase of 18.1 per cent from October 2020 and a decrease of 7.1 per cent compared to September 2021.
  • The average sale price for a townhouse was $693,324. This represents a 39.4 per cent increase from October 2020 and an increase of 7.3 per cent compared to September 2021.
  • The average sale price for a semi was $726,313. This represents an increase of 34.6 per cent compared to October 2020 and an increase of 5.6 per cent compared to September 2021.

KWAR cautions that average sale price information can be useful in establishing long-term trends but should not be used as an indicator that specific properties have increased or decreased in value. The MLS® Home Price Index (HPI) provides the best way to gauge price trends because averages are strongly distorted by changes in the mix of sales activity from one month to the next.

The MLS® HPI composite benchmark price for all residential properties in Kitchener-Waterloo was $803,900 in October. This represents a 34.3 per cent increase over October 2020 and a 2.5 per cent increase compared to September 2021.

  • The benchmark price for a detached home was $887,500. This represents a 35.5 per cent increase from October 2020 and 2.1 per cent increase compared to September 2021.
  • The benchmark price for an apartment-style condominium was $406,400. This represents a 22.7 per cent increase from October 2020 and a 3.5 per cent increase compared to September 2021.
  •  The benchmark price for a townhouse is $603,900. This represents a 42.5 per cent increase from October 2020 and a 3.8 per cent increase compared to September 2021.

“With ongoing constraints on supply versus demand, home prices continued to accelerate in October,” says Pohl.

There were 621 new listings added to the MLS® System in KW and area last month, a decrease of 18.4 per cent compared to October of last year, and a 12.1 per cent decrease compared to the previous ten-year average for October.

The total number of homes available for sale in active status at the end of October was 288, a decrease of 36 per cent compared to October of last year, and 76.5 per cent below the previous ten-year average of 1,285 listings for October.

The number of months of inventory remained at 0.5 in October. Inventory has settled at under 1 month for twelve consecutive months. The number of months of inventory represents how long it would take to sell off current inventories at the current rate of sales.

The average number of days to sell in October was 10 days, compared to 13 days in October 2020 and a previous 5-year average of 22 days.

“Affordability throughout Waterloo Region continues to be challenged, creating significant barriers especially for many people who are just trying to get their foot in the door of the housing market,” says Pohl. “We are urging all levels of government to work together to tackle the supply issue facing housing markets across the country and right here in Waterloo region.”

Over the past two weeks representatives of KWAR, alongside REALTORS® from across Canada have been meeting with Members of Parliament to talk about Canada’s economic recovery plan and the need to prioritize housing. You can read about the ideas that REALTORS® are proposing here:  https://www.crea.ca/mp

Those requiring specific information on property values should contact a local REALTOR®.  Working with a Realtor is the best way to get a complete picture of the property and community you are considering.

View our HPI tool here to learn more: https://kwar.ca/hpi-dashboard

Historical Sales By Property Type

Months Supply of Homes for Sale

Historical Median Sales Price – By Property Type

Historical Average Sales Price – By Property Type

Average Days on Market Chart

KWAR cautions that average sale price information can be useful in establishing long term trends but should not be used as an indicator that specific properties have increased or decreased in value. The average sale price is calculated based on the total dollar volume of all properties sold. Months Supply is the inventory of homes for sale at the end of a given month, divided by the average monthly closed sales from the last 12 months Those requiring specific information on property values should contact a local REALTOR®. REALTORS® have their fingers on the pulse of the market. They know the questions to ask, the areas to probe and what to look for so that you get a complete picture of the property and community you’re considering.

Kitchener-Waterloo Market Snapshot September 2021

Monday, October 4th, 2021

HOME PRICES CONTINUE TO CLIMB IN SEPTEMBER

LISTINGS CONTINUE TO BE OUTSTRIPPED BY BUYING DEMAND

KITCHENER-WATERLOO, ON (October 4, 2021) –– A total of 506 residential homes sold last month through the Multiple Listing Service® (MLS® System) of the Kitchener-Waterloo Association of REALTORS® (KWAR), a decrease of 32.1 per cent compared to last September and a decrease of 5.9 per cent compared to August.

“While the total number of homes sold last month was down considerably compared to last September, it can still be considered an above average month of activity when we remember that last September smashed any previous September for number of sales,” says KWAR’s president, Nicole Pohl. “In fact, I would say we are on track for setting a record number of annual sales in 2021.”

Total residential sales in September included 267 detached (down 37.3 per cent from September 2020), and 83 condominium units (down 11.7 per cent). Sales also included 41 semi-detached homes (down 21.2) and 115 townhouses (down 33.5 per cent).

In September, the average sale price for all residential properties in the Kitchener-Waterloo area was $792,599. This represents a 24.2 per cent increase over September 2020 and a 5.7 per cent increase compared to August 2021.

  • The average price of a detached home was $963,646. This represents a 24.9 per cent increase from September 2020 and an increase of 7.9 per cent compared to August 2021.
  • The average sale price for an apartment-style condominium was $497,949. This represents an increase of 28.6 per cent from September 2020 and an increase of 12.4 per cent compared to August 2021.
  • The average sale price for a townhouse was $646,026. This represents a 35.7 per cent increase from September 2020 and an increase of 3.7 per cent compared to August 2021.
  • The average sale price for a semi was $686,316. This represents an increase of 26.1 per cent compared to September 2020 and an increase of 0.5 per cent compared to August 2021.


KWAR cautions that average sale price information can be useful in establishing long-term trends but should not be used as an indicator that specific properties have increased or decreased in value. The MLS® Home Price Index (HPI) provides the best way to gauge price trends because averages are strongly distorted by changes in the mix of sales activity from one month to the next.

The MLS® HPI composite benchmark price for all residential properties in Kitchener-Waterloo was $784,200 in September. This represents a 33.0 per cent increase over September 2020 and a 3.5 per cent increase compared to August 2021.

  • The benchmark price for a detached home was $869,220. This represents a 34.2 per cent increase from September 2020 and 3.8 per cent increase compared to August 2021.
  • The benchmark price for an apartment-style condominium was $392,600. This represents a 21.5 per cent increase from September 2020 and a 3.1 per cent increase compared to August 2021.
  • The benchmark price for a townhouse is $581,700. This represents a 40.0 per cent increase from September 2020 and a 2.4 per cent increase compared to August 2021.

There were 698 new listings added to the MLS® System in KW and area last month, a decrease of 23.4 per cent compared to September of last year, and a 13 per cent decrease compared to the previous ten-year average for September.

The total number of homes available for sale in active status at the end of September was 345, a decrease of 35.3 per cent compared to September of last year, and 73.2 per cent below the previous ten-year average of 1,285 listings for September.

“Home prices reached all new highs in September, “says Pohl. “And while there is a growing call to add more transparency to how real estate is traded in Ontario —the brutal reality of this market is that supply is simply not keeping up with demand and that is what is driving up prices.”

The President of KWAR says: “While there are many who have zeroed in on the blind bidding process, the greater concern is that homes are being purchased without all the normal conditions you would see in a balanced market. As a practicing REALTOR® I completely support and hope the government will add the ability for REALTORS® to provide greater transparency on offers,” says Pohl. “But as it is, we are legislatively restricted from disclosing anything more than simply the number of offers, which is not working for homebuyers.”

The number of months of inventory nudged up slightly from August’s 0.4 months to half a month in September. Inventory has settled at under 1 month for the past 11 consecutive months. The number of months of inventory represents how long it would take to sell off current inventories at the current rate of sales.

The average number of days to sell in September was 10 days, compared to 14 days in September 2020 and a previous 5-year average of 23 days.

Those requiring specific information on property values should contact a local REALTOR®.  Working with a Realtor is the best way to get a complete picture of the property and community you are considering.

View our HPI tool here to learn more: https://kwar.ca/hpi-dashboard

Historical Sales By Property Type

Months Supply of Homes for Sale


Historical Median Sales Price – By Property Type

Historical Average Sales Price – By Property Type

Average Days on Market

KWAR cautions that average sale price information can be useful in establishing long-term trends but should not be used as an indicator that specific properties have increased or decreased in value. The average sale price is calculated based on the total dollar volume of all properties sold. Months Supply is the inventory of homes for sale at the end of a given month, divided by the average monthly closed sales from the last 12 months Those requiring specific information on property values should contact a local REALTOR®. REALTORS® have their fingers on the pulse of the market. They know the questions to ask, the areas to probe, and what to look for so that you get a complete picture of the property and community you’re considering.

Kitchener-Waterloo Market Snapshot August 2021

Friday, September 3rd, 2021

August Stats 2021

HOMEBUYING DEMAND CONTINUES TO OVERWHELM HOUSING SUPPLY

KITCHENER-WATERLOO, ON (September 3, 2021) –– A total of 535 residential homes sold last month through the Multiple Listing Service® (MLS® System) of the Kitchener-Waterloo Association of REALTORS® (KWAR), a decrease of 22.1 per cent compared to last August’s record-smashing month, and a decrease of 12.3 per cent compared to July.

While sales were down relative to last month and last August, they remained well above average notes KWAR’s president, Nicole Pohl. “The main reason for the decrease is simply that last month was the first full month in Step 3 of the reopening, and people were tired of the lockdown,” says Pohl. “They got out and enjoyed their summer and shifted their real estate needs to the back burner for a much-needed change of focus.”

Total residential sales in August included 299 detached (down 30.6 per cent from August 2020), and 80 condominium units (down 1.2 per cent). Sales also included 38 semi-detached homes (down 2.6) and 118 townhouses (down 13.2 per cent).

In August, the average sale price for all residential properties in the Kitchener-Waterloo area was $753,296. This represents a 19.3 per cent increase over August 2020 and a 0.3 per cent decrease compared to July 2021

  • The average price of a detached home was $895,756. This represents a 22.5 per cent increase from August 2020 and a decrease of 1.3 per cent compared to July 2021.
  • The average sale price for an apartment-style condominium was $445,280. This represents an increase of 18.2 per cent from August 2020 and an increase of 3.7 per cent compared to July 2021.
  • The average sale price for a townhouse was $623,767. This represents a 26.1 per cent increase from August 2020 and an increase of 0.1 per cent compared to July 2021.
  • The average sale price for a semi was $683,048. This represents an increase of 26.5 per cent compared to August 2020 and an increase of 2.3 per cent compared to July 2021.


KWAR cautions that average sale price information can be useful in establishing long-term trends but should not be used as an indicator that specific properties have increased or decreased in value. The MLS® Home Price Index (HPI) provides the best way to gauge price trends because averages are strongly distorted by changes in the mix of sales activity from one month to the next.

The MLS® HPI composite benchmark price for all residential properties in Kitchener-Waterloo was $757,900 in August. This represents a 29.5 per cent increase over August 2020 and a 1.2 per cent increase compared to July 2021.

  • The benchmark price for a detached home was $837,100. This represents a 31.5 per cent increase from August 2020 and 1.8 per cent increase compared to July 2021.
  • The benchmark price for an apartment-style condominium was $380,700. This represents a 11.7 per cent increase from August 2020 and a 1.3 per cent decrease compared to July 2021.
  • The benchmark price for a townhouse is $568,000. This represents a 37.3 per cent increase from August 2020 and a 0.6 per cent increase compared to July 2021.


There were 590 new listings added to the MLS® System in KW and area last month, a decrease of 27.6 per cent compared to August of last year, and a 13 per cent decrease compared to the previous ten-year average for August.

The total number of homes available for sale in active status at the end of August was 255, a decrease of 53.6 per cent compared to August of last year, and 79.5 per cent below the previous ten-year average of 1,252 listings for August.

“The number of homes coming to market continues to be overwhelmed by the number of homebuyers we have wanting to purchase in Waterloo Region,” says Pohl.

The number of months of inventory persisted from the July level of 0.4 months in August. Inventory has numbered less than 1 month since October. The number of months of inventory represents how long it would take to sell off current inventories at the current rate of sales.

The average number of days to sell in August was 12 days, compared to 17 days in August 2020 and a previous 5-year average of 26 days.

Those requiring specific information on property values should contact a local REALTOR®.  Working with a Realtor is the best way to get a complete picture of the property and community you are considering.

View our HPI tool here to learn more: https://kwar.ca/hpi-dashboard

Historical Sales By Property Type

Months Supply of Homes for Sale


Historical Median Sales Price – By Property Type


Historical Average Sales Price – By Property Type


Average Days on Market 

Kitchener-Waterloo Market Snapshot April 2021

Wednesday, May 5th, 2021

KW Market Stats April 2021

NUMBER OF HOME SALES IN APRIL SECOND HIGHEST ON RECORD

KITCHENER-WATERLOO, ON (May 5, 2021) –– Following last month’s record-smashing number of home sales, the Kitchener-Waterloo Association of REALTORS® (KWAR) posted the second-highest number of monthly home sales in April. There were 843 residential homes sold through the Multiple Listing Service® (MLS® System) of KWAR last month, an increase of 263.4 per cent compared to April 2020, and a decrease of 15.5 per cent compared to March 2021.

“Even if we do not take into account April 2020, when Ontario was in the early days of its state of emergency, it was still an exceptional number of homes sold last month,” says Nicole Pohl, President of KWAR. “The previous 10-year average number of residential sales for April was 618.”

Total residential sales in April included 484 detached (up 233.8 per cent from April 2020), and 111 condominium units (up 382.6 per cent). Sales also included 67 semi-detached homes (up 294.1 per cent) and 181 townhouses (up 285.1 per cent).

In April, the average sale price for all residential properties in the Kitchener-Waterloo area was $757,906. This represents a 34.3 per cent increase over April 2020 and a 0.9 per cent decrease compared to March 2021.

      • The average price of a detached home was $899,315. This represents a 36.9 per cent increase from April 2020 and an increase of 0.04 per cent compared to March 2021.
      • The average sale price for an apartment-style condominium was $441,887. This represents an increase of 21.2 per cent from April 2020 and an increase of 4.2 per cent compared to March 2021.
      • The average sale price for a townhouse was $612,550. This represents a 52.1 per cent increase from April 2020 and a decrease of 2.03 per cent compared to March 2021.
      • The average sale price for a semi was $652,609. This represents an increase of 33.0 per cent compared to April 2020 and an increase of 0.18 per cent compared to March 2021.

“We are starting to see home prices calm down in March and April compared to what was happening in January and February,” says Pohl.

KWAR cautions that average sale price information can be useful in establishing long-term trends but should not be used as an indicator that specific properties have increased or decreased in value. The MLS® Home Price Index (HPI) provides the best way to gauge price trends because averages are strongly distorted by changes in the mix of sales activity from one month to the next.

The MLS® HPI composite benchmark price for all residential properties in Kitchener-Waterloo was $742,800 in April. This represents a 40.4 per cent increase over April 2020 and a 0.6 per cent increase compared to March 2021.

      • The benchmark price for a detached home was $809,000. This represents a 39.9 per cent increase from April 2020 and 1.0 per cent decrease compared to March 2021.
      • The benchmark price for an apartment-style condominium was $374,100. This represents a 31.1 per cent increase from April 2020 and a 4.3 per cent increase compared to March 2021.
      • The benchmark price for a townhouse is $591,300. This represents a 47.2 per cent increase from April 2020 and a 6.6 per cent increase compared to March 2021.

There were 1,098 new listings added to the MLS® System in KW and area last month, an increase of 162.7 per cent compared to April of last year, and a 17.15 per cent increase compared to the previous ten-year average for April* (*calculated from 2019 to 2010 to adjust for the impact of the state of emergency on activity in April 2020).

The total number of homes available for sale in active status at the end of April was 458, a decrease of 21.8 per cent compared to April of last year, and 66.9 per cent below the previous ten-year average of 1,384 listings for April* (*calculated from 2010 to 2019 to adjust for the impact of the state of emergency on activity in April 2020).

The number of months of inventory was 0.7 in April, which is unchanged from March. Inventory has numbered less than 1 month since October. The number of months of inventory represents how long it would take to sell off current inventories at the current rate of sales.

The average number of days to sell in April was 9 days, compared to 19 days in April 2020 and a previous 5-year average of 21 days.

Those requiring specific information on property values should contact a local REALTOR®.  Working with a Realtor is the best way to get a complete picture of the property and community you are considering.

View our HPI tool here to learn more: https://kwar.ca/hpi-dashboard

Historical Sales By Property Type

Months Supply of Homes for Sale

Historical Median Sales Price – By Property Type

Historical Average Sales Price – By Property Type

Average Days on Market Chart

Kitchener Market Snapshot March 2021

Tuesday, April 6th, 2021

RECORD SMASHING NUMBER OF HOME SALES IN MARCH

KITCHENER-WATERLOO, ON (April 6, 2021) –– In March, the Kitchener-Waterloo Association of REALTORS® (KWAR) posted the highest number of monthly home sales in the board’s history. There were 993 residential homes sold through the Multiple Listing Service® (MLS® System) of KWAR in March, an increase of 72.7 per cent compared to March 2020, and an increase of 66 per cent compared to the previous month. The previous 10-year average number of residential sales for March is 552.

“This is the first time we’ve sold more than 900 homes in a single month,” says Nicole Pohl, President of KWAR. “The second highest number of sales occurred in May 2017 when there were 816 sales through our MLS® System.”

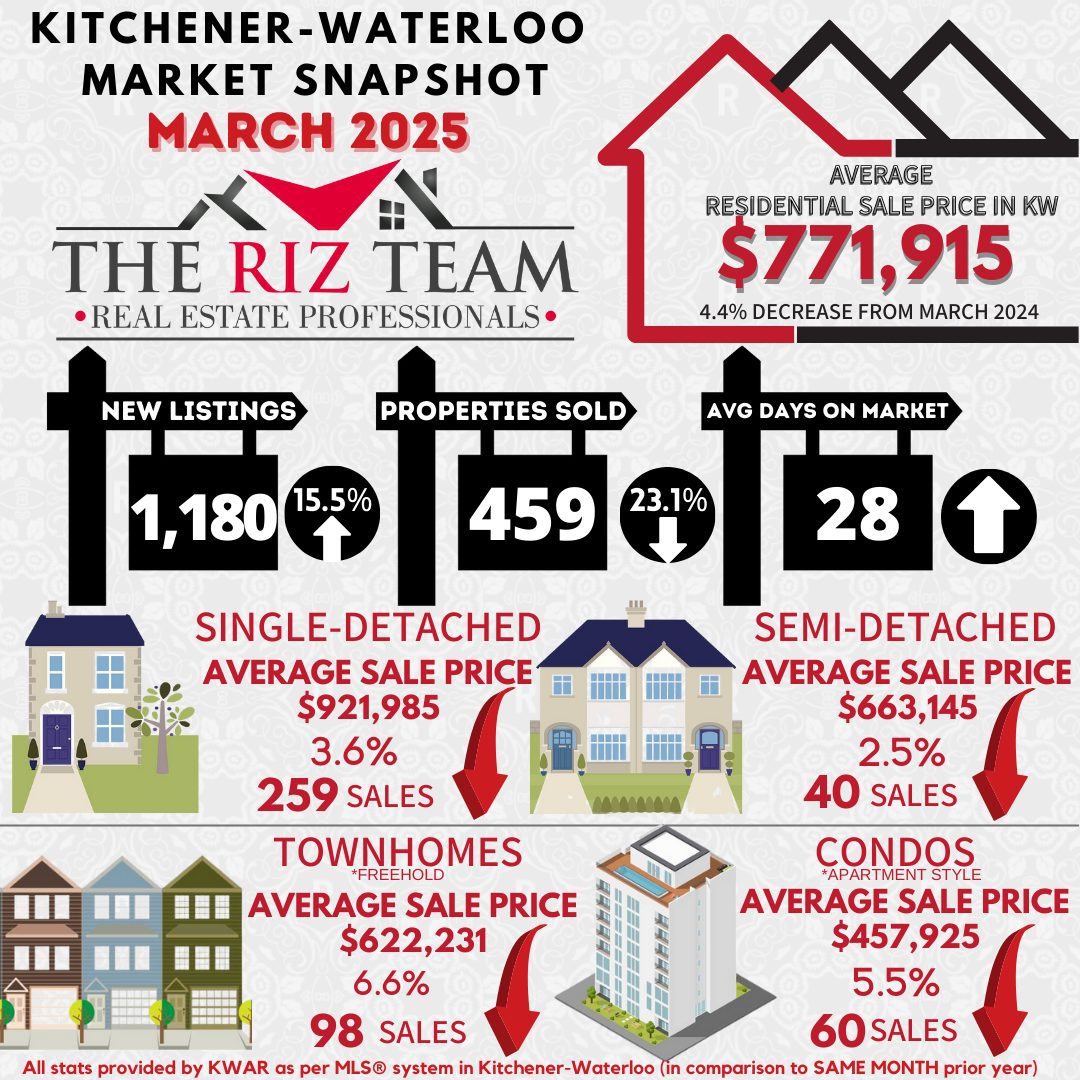
Total residential sales in March included 593 detached (up 69.4 per cent from March 2020), and 124 condominium units (up 82.4 per cent). Sales also included 79 semi-detached homes (up 216 per cent) and 197 townhouses (up 49.2 per cent).

In March, the average sale price for all residential properties in the Kitchener-Waterloo area was $765,393. This represents a 30.8 per cent increase over March 2020, and a 1.5 per cent increase compared to February 2021.

      • The average price of a detached home was $899,460. This represents a 32.3 per cent increase from March 2020, and a decrease of 1.4 per cent compared to February 2021.
      • The average sale price for an apartment-style condominium was $423,470. This represents an increase of 12 per cent from March 2020, and an increase of 1.6 per cent compared to February 2021.
      • The average sale price for a townhouse was $622,258. This represents a 35.9 per cent increase from March 2020, and an increase of 2 per cent compared to February 2021.
      • The average sale price for a semi was $652,669. This represents an increase of 32.5 per cent compared to March 2020, and a decrease of 4.8 per cent compared to February 2021.

“On a year-over-year basis we continued to see huge price increases in the average price in March, however compared to February we are seeing some signs that perhaps prices may be starting to stabilize a bit,” says Pohl.

KWAR cautions that average sale price information can be useful in establishing long term trends but should not be used as an indicator that specific properties have increased or decreased in value. The MLS® Home Price Index (HPI) provides the best way to gauge price trends because averages are strongly distorted by changes in the mix of sales activity from one month to the next.

The MLS® HPI composite benchmark price for all residential properties in Kitchener-Waterloo was $738,200 in March. This represents a 33.4 per cent increase over March 2020 and a 4 per cent increase compared to February 2021.

      • The benchmark price for a detached home was $817,000. This represents a 34.4 per cent increase from March 2020 and 3.6 per cent increase compared to February 2021.
      • The benchmark price for an apartment-style condominium was $358,700. This represents a 14.9 per cent increase from March 2020 and a 5.1 per cent increase compared to February 2021.
      • The benchmark price for a townhouse is $554,900. This represents a 38.3 per cent increase from March 2020 and a 5.4 per cent increase compared to February 2021.

“In addition to the record number of sales in March, we also had a record number of newly listed properties come on the market,” says Pohl. “The number of new listings last month was the most of any month, and the highest number since May of 2017 when there were 1,271 new listings.”

There were 1,359 new listings added to the MLS® System in KW and area last month, an increase of 56.2 per cent compared to March of last year, and a 63.9 per cent increase compared to the previous ten-year average for March.

Pohl notes while the additional inventory is welcome, home buying demand continues to substantially outpace supply.

The total number of homes available for sale in active status at the end of March was 434, a decrease of 23.5 per cent compared to March of last year, and 63.5 per cent below the previous ten-year average of 1,188 listings for March.

The number of months of inventory was 0.7 in March and has numbered less than 1 month since October. The number of months of inventory represents how long it would take to sell off current inventories at the current rate of sales.

The average number of days to sell in March was 8 days, compared to 16 days in March 2020 and a previous 5-year average of 21 days.

Those requiring specific information on property values should contact a local REALTOR®.  Working with a Realtor is the best way to get a complete picture of the property and community you are considering.

View our HPI tool here to learn more: https://kwar.ca/hpi-dashboard

Historical Sales By Property Type


Months Supply of Homes for Sale


Historical Median Sales Price – By Property Type


Historical Average Sales Price – By Property Type


Average Days on Market Chart

KWAR cautions that average sale price information can be useful in establishing long term trends but should not be used as an indicator that specific properties have increased or decreased in value. The average sale price is calculated based on the total dollar volume of all properties sold. Months Supply is the inventory of homes for sale at the end of a given month, divided by the average monthly closed sales from the last 12 months Those requiring specific information on property values should contact a local REALTOR®. REALTORS® have their fingers on the pulse of the market. They know the questions to ask, the areas to probe and what to look for so that you get a complete picture of the property and community you’re considering.


© Copyright 2017, Real Estate Websites by Redman Technologies Inc. | Privacy Policy | Disclaimer | Sitemap

MLS®, REALTOR®, and the associated logos are trademarks of The Canadian Real Estate Association.

The data included on this website is deemed to be reliable, but is not guaranteed to be accurate by the Kitchener-Waterloo Real Estate Board. The trademarks REALTOR®, REALTORS® and the REALTOR® logo are controlled by The Canadian Real Estate Association (CREA) and identify real estate professionals who are members of CREA. Used under license.