The Riz Team Blog

Archive for the ‘Uncategorized’ Category

Kitchener-Waterloo Market Snapshot March 2022

Monday, April 4th, 2022

KITCHENER-WATERLOO HOME SALES UP IN MARCH, AVERAGE PRICE DIPS FROM FEBRUARY

“The skyrocketing prices of the last two months took a bit of a breather in March, with the overall average price dipping five per cent compared to what we saw in February,” said Megan Bell, President of KWAR. “While it is too soon to draw conclusions from just one month of home sales, I know many will be comforted to see a leveling off on the average price, no matter how incremental.”

If you are considering to Sell your home or Buy a home in the next short while it would be highly beneficial for you to connect with one of our Team Agents at

The Riz Team

Do you want to know what your home is worth today? Click Below for our Online No Obligation Market Evaluation
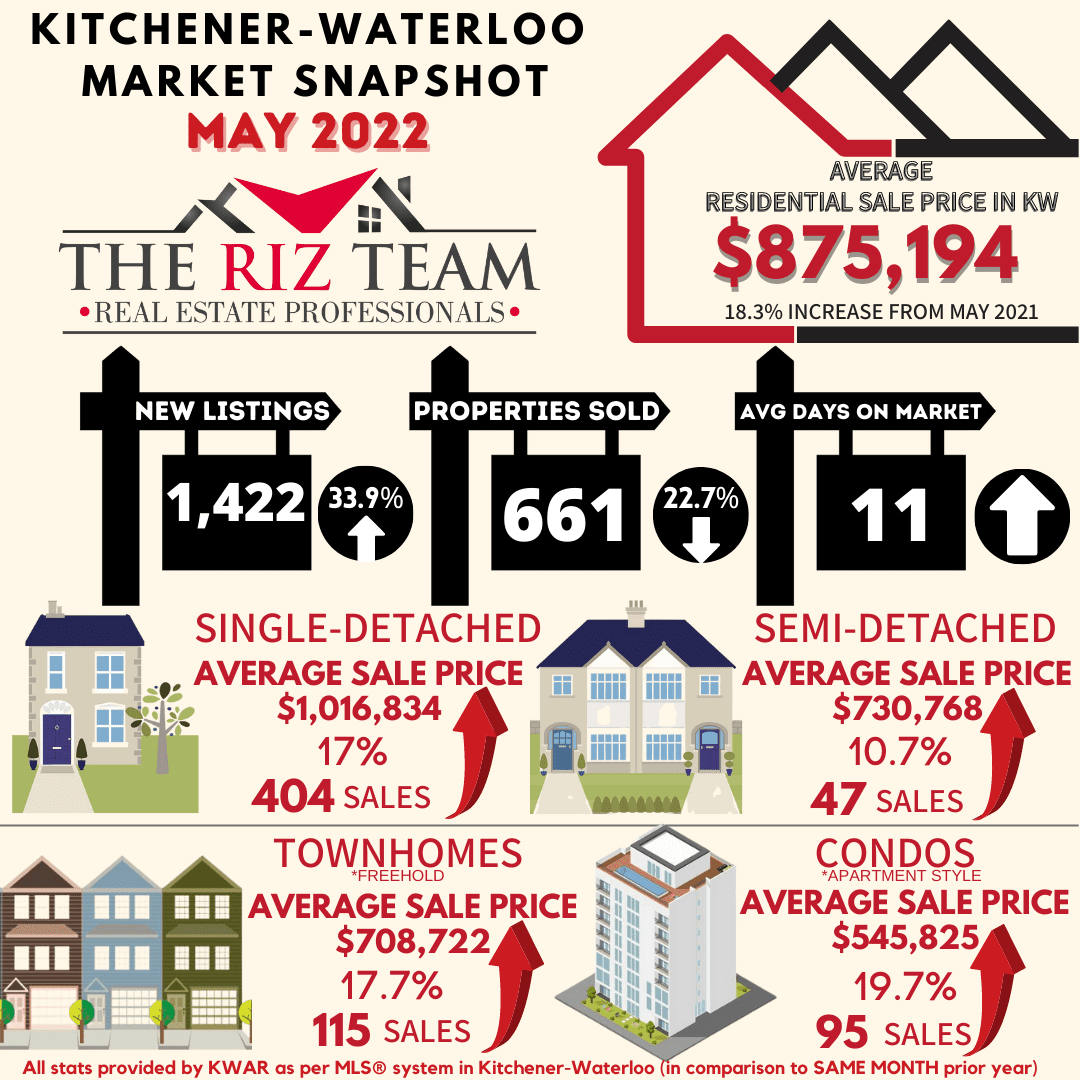
 

Total residential sales in March included 416 detached (down 29.7 per cent from March 2021), and 114 condominium units (down 9.5 per cent). Sales also included 64 semi-detached homes (down 17.9 per cent) and 131 townhouses (down 33.8 per cent).

In March, the average sale price for all residential properties in the Kitchener-Waterloo area was $960,181. This represents a 25.5 per cent increase over March 2021 and a 4.6 per cent decrease compared to February 2022.

  • The average price of a detached home was $1,132,637. This represents a 25.9 per cent increase from March 2021 and a decrease 6.4 per cent compared to February 2022.
  • The average sale price for an apartment-style condominium was $565,782. This represents an increase of 33.4 per cent from March 2021 and a decrease of 1.2 per cent compared to February 2022.
  • The average sale price for a townhouse was $796,696. This represents a 27.4 per cent increase from March 2021 and a decrease of 7.6 per cent compared to February 2022.
  • The average sale price for a semi was $876,371. This represents an increase of 34.5 per cent compared to March 2021 and a decrease of 5.0 per cent compared to February 2022.

KWAR cautions that average sale price information can be useful in establishing long-term trends but should not be used as an indicator that specific properties have increased or decreased in value. The MLS®® Home Price Index (HPI) provides the best way to gauge price trends because averages are strongly distorted by changes in the mix of sales activity from one month to the next.

The MLS® HPI composite benchmark price for all residential properties in Kitchener-Waterloo was $960,100 in March. This represents a 29.6 per cent increase over March 2021 and a 1.5 per cent decrease compared to February 2022.

  • The benchmark price for a detached home was $1,046,200. This represents a 28.1 per cent increase from March 2021 and 4.0 per cent decrease compared to February 2022.
  • The benchmark price for an apartment-style condominium was $484,000. This represents a 32.9 per cent increase from March 2021 and a 4.2 per cent increase compared to February 2022.
  • The benchmark price for a townhouse is $765,500. This represents a 41.3 per cent increase from March 2021 and a 4.9 per cent increase compared to February 2022.

“Even though the average price decreased across all property types on a month-to-month basis, the MLS® HPI showed continued monthly gains for both townhouse and apartment property types,” notes Bell.  “As the province feels its way out of the pandemic, we are beginning to see some very preliminary signs of a potential cooling. We are not seeing quite as many multiple offers and some offers are coming in with conditions. Of course, when we say cooling, we’re talking about a market that has been scorching hot which is why we are pleased to see this happening.”

There were 1,131 new listings added to the MLS® System in KW and area last month, a decrease 16.8 per cent compared to the record topping number of listings added in March of last year, and a 28.0 per cent increase compared to the previous ten-year average for March.

The total number of homes available for sale in active status at the end of March was 441, an increase of 1.1 per cent compared to March of last year, and 59.0 per cent below the previous ten-year average of 1,072 listings for March.

The number of months of inventory nudged up to 0.7 months in March from 0.5 months in February. Inventory has been under the one-month mark since October 2020. The number of months of inventory represents how long it would take to sell off current inventories at the current rate of sales.

The average number of days to sell in March was 8 days, the same as it was in March 2021. The previous 5-year average is 16 days.

The More Homes for Everyone Act

Statement from KWAR President Megan Bell

Last week the Government of Ontario introduced a new bill, the More Homes for Everyone Act to address the province’s housing affordability crisis.

While we welcome several aspects of the proposed More Homes for Everyone bill, such as measures to support more timely municipal decision making and developing policies and tools to support multi-generational homes in existing neighbourhoods—bolder actions to increase supply were notably missing.

Ontario’s Housing Affordability Task Force had recommended limiting exclusionary zoning and allowing “as of right” residential housing up to four units and up to four storeys on a single residential lot. Instead, the government has committed to the Task Force’s recommendations as part of a “long term roadmap”.

KWAR is optimistic Waterloo Region will be bold about housing in their official plan update

Ending exclusionary zoning to allow for gentle density in our neighbourhoods is critical to filling the lack of “missing middle” supply for family-sized households.

While Minister Clark states that some municipalities (such as Toronto and Mississauga) were not ready, KWAR is optimistic that the Region of Waterloo (ROW) will take a more progressive view toward increasing density.  On the development side, the Waterloo region has been exceeding density targets set by the province. At KWAR’s recently held Where Do We Grow From Here Symposium we learned from the ROW’s Commissioner, Rod Regier the Region is proposing policies for the ROW official plan that would see a tiered approach to missing middle housing by allowing 4 units and up to 4 storeys, as-of-right, on all land currently zoned residential and on any new greenfield land (residential); and allow a range of 8 to 12 storeys, along specific corridors, such as the ION corridor.

KWAR encourages the Region of Waterloo to stay the course on its bold proposals for its Regional Official Plan and create ways to bring a broad range of housing options to our community.

Those requiring specific information on property values should contact a local REALTOR®.  Working with a Realtor is the best way to get a complete picture of the property and community you are considering.

View our HPI tool here to learn more: https://kwar.ca/hpi-dashboard

Historical Sales By Property Type

Months Supply of Homes for Sale

Historical Median Sales Price – By Property Type

Historical Average Sales Price – By Property Type

Average Days on Market Chart

KWAR cautions that average sale price information can be useful in establishing long term trends but should not be used as an indicator that specific properties have increased or decreased in value. The average sale price is calculated based on the total dollar volume of all properties sold. Months Supply is the inventory of homes for sale at the end of a given month, divided by the average monthly closed sales from the last 12 months Those requiring specific information on property values should contact a local REALTOR®. REALTORS® have their fingers on the pulse of the market. They know the questions to ask, the areas to probe and what to look for so that you get a complete picture of the property and community you’re considering.

Kitchener-Waterloo Market Snapshot July 2021

Thursday, August 5th, 2021


VERY LOW INVENTORY COMBINED WITH STRONG DEMAND KEEPS HOME PRICES HUMMING IN JULY

“Although home sales slowed down to some degree in July compared to June, overall demand remains very strong,” says Nicole Pohl, President of KWAR. “The current inventory of homes available for sale in the Kitchener-Waterloo and area is extremely low, making Waterloo Region one of the most competitive markets in Ontario.”

Total residential sales in July included 339 detached (down 27.1 per cent from July 2020), and 91 condominium units (up 30 per cent). Sales also included 46 semi-detached homes (down 4.2) and 135 townhouses (down 11.8 per cent).

In July, the average sale price for all residential properties in the Kitchener-Waterloo area was $755,681. This represents a 18.2 per cent increase over July 2020 and a 0.6 per cent decrease compared to June 2021.

      • The average price of a detached home was $907,192. This represents a 21.9 per cent increase from July 2020 and a decrease of 1.4 per cent compared to June 2021.
      • The average sale price for an apartment-style condominium was $429,630. This represents an increase of 6.7 per cent from July 2020 and a decrease of 3.6 per cent compared to June 2021.
      • The average sale price for a townhouse was $623,732. This represents a 33.8 per cent increase from July 2020 and an increase of 5.4 per cent compared to June 2021.
      • The average sale price for a semi was $667,570. This represents an increase of 28.6 per cent compared to July 2020 and an increase of 2.9 per cent compared to June 2021.

KWAR cautions that average sale price information can be useful in establishing long-term trends but should not be used as an indicator that specific properties have increased or decreased in value. The MLS® Home Price Index (HPI) provides the best way to gauge price trends because averages are strongly distorted by changes in the mix of sales activity from one month to the next.

The MLS® HPI composite benchmark price for all residential properties in Kitchener-Waterloo was $748,700 in July. This represents a 30.5 per cent increase over July 2020 and a 0.4 per cent increase compared to June 2021.

  • The benchmark price for a detached home was $822,300. This represents a 31.1 per cent increase from July 2020 and 0.2 per cent increase compared to June 2021.
  • The benchmark price for an apartment-style condominium was $385,900. This represents a 19.5 per cent increase from July 2020 and a 3.3 per cent increase compared to June 2021.
  • The benchmark price for a townhouse is $564,500. This represents a 40 per cent increase from July 2020 and a 0.4 per cent decrease compared to June 2021.

“The housing market took a bit of a breather last month,” notes Pohl. “July is typically a quieter month with families taking vacation, and with the region coming out of lockdown there were certainly more staycations happening.  But we do anticipate the market will pick up steam again and it will be another busy fall.”

There were 675 new listings added to the MLS® System in KW and area last month, a decrease of 24 per cent compared to July of last year, and a 14.4 per cent decrease compared to the previous ten-year average for July.

The total number of homes available for sale in active status at the end of July was 281, a decrease of 52.7 per cent compared to July of last year, and 79.1 per cent below the previous ten-year average of 1,346 listings for July.

The number of months of inventory was 0.4 in July, a decline from 0.5 months in June. Inventory has numbered less than 1 month since October. The number of months of inventory represents how long it would take to sell off current inventories at the current rate of sales.

The average number of days to sell in July was 11 days, compared to 17 days in July 2020 and a previous 5-year average of 22 days.

Those requiring specific information on property values should contact a local REALTOR®.  Working with a Realtor is the best way to get a complete picture of the property and community you are considering.

View our HPI tool here to learn more: https://kwar.ca/hpi-dashboard

Historical Sales By Property Type

Months Supply of Homes for Sale

Historical Median Sales Price – By Property Type

Historical Average Sales Price – By Property Type

Average Days on Market

KWAR cautions that average sale price information can be useful in establishing long-term trends but should not be used as an indicator that specific properties have increased or decreased in value. The average sale price is calculated based on the total dollar volume of all properties sold. Months Supply is the inventory of homes for sale at the end of a given month, divided by the average monthly closed sales from the last 12 months Those requiring specific information on property values should contact a local REALTOR®. REALTORS® have their fingers on the pulse of the market. They know the questions to ask, the areas to probe and what to look for so that you get a complete picture of the property and community you’re considering.

Kitchener-Waterloo Market Snapshot May 2021

Thursday, June 3rd, 2021

HOMES SALES CONTINUE TO SMASH RECORDS

KITCHENER-WATERLOO, ON (June 3, 2021) –– Strong home sales continued in May as the Kitchener-Waterloo Association of REALTORS® (KWAR) once again posted a record-setting number of monthly home sales.  There were 854 residential homes sold through the Multiple Listing Service® (MLS® System) of KWAR last month, an increase of 100.9 per cent compared to May 2020, and a 0.9 per cent increase compared to April 2021.

“While last May home sales were restrained due to the pandemic, May 2021 was another extraordinary month of home buying and selling activity,” says Nicole Pohl, President of KWAR. “Prior to 2020, the previous 10-year average number of residential sales for May was 656.”

Total residential sales in May included 485 detached (up 85.8 per cent from May 2020), and 106 condominium units (up 152.4 per cent). Sales also included 74 semi-detached homes (up 72.1 per cent) and 188 townhouses (up 138 per cent).

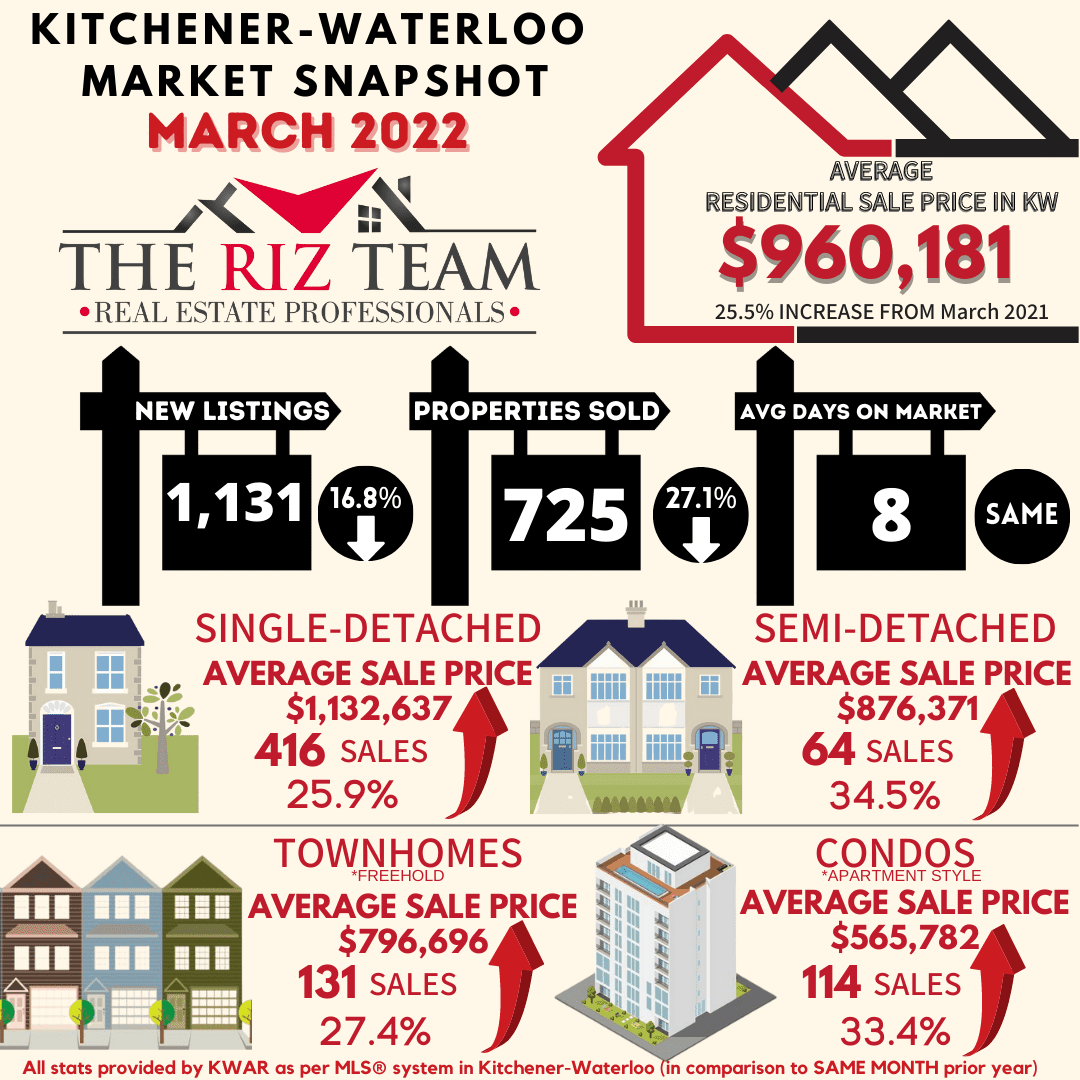
In May, the average sale price for all residential properties in the Kitchener-Waterloo area was $740,103. This represents a 30.4 per cent increase over May 2020 and a 2.4 per cent decrease compared to April 2021.

      • The average price of a detached home was $868,990. This represents a 32.6 per cent increase from May 2020 and a decrease of 3.4 per cent compared to April 2021.
      • The average sale price for an apartment-style condominium was $457,935. This represents an increase of 38.6 per cent from May 2020 and an increase of 3.1 per cent compared to April 2021.
      • The average sale price for a townhouse was $601,987. This represents a 33.7 per cent increase from May 2020 and a decrease of 1.8 per cent compared to April 2021.
      • The average sale price for a semi was $659,975. This represents an increase of 36.8 per cent compared to May 2020 and an increase of 1.2 per cent compared to April 2021.

“Last month the market took a breath and calmed a bit, but there is still very strong demand throughout our region,” says Pohl. “This started prior to the new mortgage stress test that came into effect on June 1. While these changes will impact the affordability for some, I do not expect it to be very impactful due to the sheer number of buyers in our market.”

Average Sales Price – By Property Type

KWAR cautions that average sale price information can be useful in establishing long-term trends but should not be used as an indicator that specific properties have increased or decreased in value. The MLS® Home Price Index (HPI) provides the best way to gauge price trends because averages are strongly distorted by changes in the mix of sales activity from one month to the next.

The MLS® HPI composite benchmark price for all residential properties in Kitchener-Waterloo was $749,100 in May. This represents a 35.8 per cent increase over May 2020 and a 0.4 per cent increase compared to April 2021.

      • The benchmark price for a detached home was $815,800. This represents a 35.8 per cent increase from May 2020 and 0.8 per cent decrease compared to April 2021.
      • The benchmark price for an apartment-style condominium was $373,700. This represents a 16.9 per cent increase from May 2020 and a 2.1 per cent decrease compared to April 2021.
      • The benchmark price for a townhouse is $574,900. This represents a 49 per cent increase from May 2020 and a 0.5 per cent decrease compared to April 2021.


There were 1,061 new listings added to the MLS® System in KW and area last month, an increase of 83.2 per cent compared to May of last year, and a 2.6 per cent increase compared to the previous ten-year average for May* (*calculated from 2010 to 2019 to adjust for the impact of the state of emergency on activity in May 2020).

The total number of homes available for sale in active status at the end of May was 448, a decrease of 20. per cent compared to May of last year, and 70.5 per cent below the previous ten-year average of 1,520 listings for May* (*calculated from 2010 to 2019 to adjust for the impact of the state of emergency on activity in May 2020).

The number of months of inventory was 0.7 in May, which is unchanged from April. Inventory has numbered less than 1 month since October. The number of months of inventory represents how long it would take to sell off current inventories at the current rate of sales.

The average number of days to sell in May was 9 days, compared to 21 days in May 2020 and a previous 5-year average of 20 days.

Those requiring specific information on property values should contact a local REALTOR®.  Working with a Realtor is the best way to get a complete picture of the property and community you are considering.

View our HPI tool here to learn more: https://kwar.ca/hpi-dashboard


Historical Sales By Property Type

Months Supply of Homes for Sale

Historical Median Sales Price – By Property Type

Historical Average Sales Price – By Property Type

Average Days on Market Chart

KWAR cautions that average sale price information can be useful in establishing long term trends but should not be used as an indicator that specific properties have increased or decreased in value. The average sale price is calculated based on the total dollar volume of all properties sold. Months Supply is the inventory of homes for sale at the end of a given month, divided by the average monthly closed sales from the last 12 months Those requiring specific information on property values should contact a local REALTOR®. REALTORS® have their fingers on the pulse of the market. They know the questions to ask, the areas to probe and what to look for so that you get a complete picture of the property and community you’re considering.

Christmas Shortbread Cookies

Tuesday, December 10th, 2019

Shortbread Christmas Cookies are easy to make and loaded with festive sprinkles, making the perfect addition to your holiday cookie platter!

INGREDIENTS 

1 cup salted butter, cold and cut into pieces

½ cup granulated sugar

1 teaspoon vanilla extract or almond extract

2 ¼ cups all-purpose flour

Optional: red and green sprinkles

Read More Here!

DIY CHRISTMAS WREATH

Wednesday, November 27th, 2019

Need a great holiday craft project? Here is list on how to make different Christmas wreaths that perfectly fit your taste, looks great on your door, and is fun to make! Whether your taste in holiday decor is clean and minimalist or bold and glitzy, you’ll find a DIY Christmas wreath to make this holiday season in the list below!

READ MORE: http://bit.ly/2XPcKNy

DIY Pumpkin Spice Latte

Thursday, November 21st, 2019

Enjoy this coffeehouse-style Pick-Me-Up Pumpkin Spice Latte drink anytime. Pumpkin melts right into the coffee and adds body and natural flavor. This is a great satisfying specialty beverage for all year round.

INGREDIENTS

1 cup strong coffee

2/3 cup Evaporated Milk

1/3 cup 100% Pure Pumpkin

2 teaspoons granulated sugar or more to taste

1/4 teaspoon pumpkin pie spice or ground cinnamon

1 teaspoon pure vanilla extract

Whipped cream (optional)

READ INSTRUCTIONS HERE

D.I.Y. LIGHT BULB DECOR

Friday, November 15th, 2019

D.I.Y. Beaded Showpiece! Wait before you throw out your old bulbs. Reuse the bulbs to make your room extraordinary! Here are ways to make your home look beautiful and brighter with these d.i.y. bulbs!
READ MORE: http://bit.ly/2Oeek7f

Easter Colouring Contest 2019

Monday, April 1st, 2019


🎉🖍Enter Our Kids Colouring Contest to WIN a SKY ZONE PARTY FOR 10!!! 🖍🎉

🍫Easter is one of our favourite holidays because a) chocolate and b) it signals the beginning of spring! To help celebrate, we thought we’d get the kids involved with a colouring contest. Let your kids get creative with their crayons, and they could win a “Sky Zone Party for 10 guests” at Sky Zone Kitchener (150 Gateway Park Dr, Kitchener, ON N2P 2J4)!

🏅To Participate🏅
 Print Coloring Page Here: https://goo.gl/7LtmCj
 Fill in Name and Age of Artist
 Color it in!
 Take photo of finished page
 Post on Facebook or Instagram & Tag —> The Riz Team

Note: Make sure post is public so that we can see it!

🛑Contest will run from March 22nd at 9am until April 15th at 5pm!

📌Contest open to anyone from ages 3-16

🏆The winner will be announced April 16th and the prize will be available for pickup at our office!🏆

FIVE MONEY-SAVING GREEN UPGRADES

Friday, February 1st, 2019

Going green is great for the environment, but that’s not the only benefit. When you make green upgrades in your home, it can also lead to some major savings.

  1. Solar panels: The upfront cost is big, but the long-term savings are huge. Solar panels will cost several thousand dollars to install, but ongoing maintenance costs are very low, and a typical system could save you hundreds of dollars per year. You can even sell your surplus electricity.
  2. Wood furnace: Wood-burning furnaces are relatively inexpensive, and though the yearly savings aren’t as dramatic (about 10% on heating bills), it adds up over the long run.
  3. Insulation: There’s a good chance your insulation isn’t very efficient, especially in older homes. Look into installing floor, cavity, wall, and loft insulation to reduce your heating bills.
  4. Rain barrels: Rain barrels are extremely inexpensive, and provide gallons of free water to use when you wash your car or water your garden.
  5. Geothermal system: OK, so the price tag is scary at first. A geothermal system uses the earth’s temperature to heat and cool your home, but can cost $30,000 to install. But tax credits allow you to get a lot of that money back, and the energy savings average about $1,900 per year. If you plan to be in your home for a decade or two, it’s a great investment.

TOP TIPS FOR STAGING YOUR HOME

Friday, January 11th, 2019


A recent survey from the National Association of Realtors® revealed that 77 percent of buyers’ agents said staging a home makes it easier for potential buyers to visual it as their own. That’s why here at Breakthrough Broker, we believe staging is not to be overlooked! Here are our top tips.

  1. Dress up your yard. First impressions count, and the first one your home gives comes from the exterior. Mow the lawn, clean up shrubbery, rake any leaves, clean the walkway and driveway, plant in-season flowers, and pull up any unsightly weeds.
  2. Reduce personal items. Make it easier for buyers to imagine themselves making your house their home by removing personal photos and knick-knacks from shelves, walls, and counters. Instead replace them with clean, simple décor, such as abstract paintings, nature images, vases, plants, and more.
  3. Organize your storage areas. Storage is a huge selling point. Tidy up and clear out the accessible closets and cupboards in the home and make sure to point them out during an open house or showing.
  4. Appeal to the senses. Consider ways you can appeal to potential homebuyers’ other senses. During a viewing or open house, bake some fresh cookies or burn delicious smelling candles and play light, relaxing music in the background.
  5. Consider turning to an expert. With their knowledge of current trends and great eye for design, professionally certified stagers can transform a home in a variety of ways and have a keen sense of what homebuyers want and expect in a home. Investing in hiring a pro may pay off in dividends.

© Copyright 2017, Real Estate Websites by Redman Technologies Inc. | Privacy Policy | Disclaimer | Sitemap

MLS®, REALTOR®, and the associated logos are trademarks of The Canadian Real Estate Association.

The data included on this website is deemed to be reliable, but is not guaranteed to be accurate by the Kitchener-Waterloo Real Estate Board. The trademarks REALTOR®, REALTORS® and the REALTOR® logo are controlled by The Canadian Real Estate Association (CREA) and identify real estate professionals who are members of CREA. Used under license.