The Riz Team Blog

Archive for the ‘Realtor Tips’ Category

Kitchener-Waterloo Market Snapshot November 2021

Friday, December 3rd, 2021

A NEW RECORD HIGH FOR NUMBER OF HOME SALES IN NOVEMBER AND AN ALL-TIME RECORD LOW SUPPLY READING

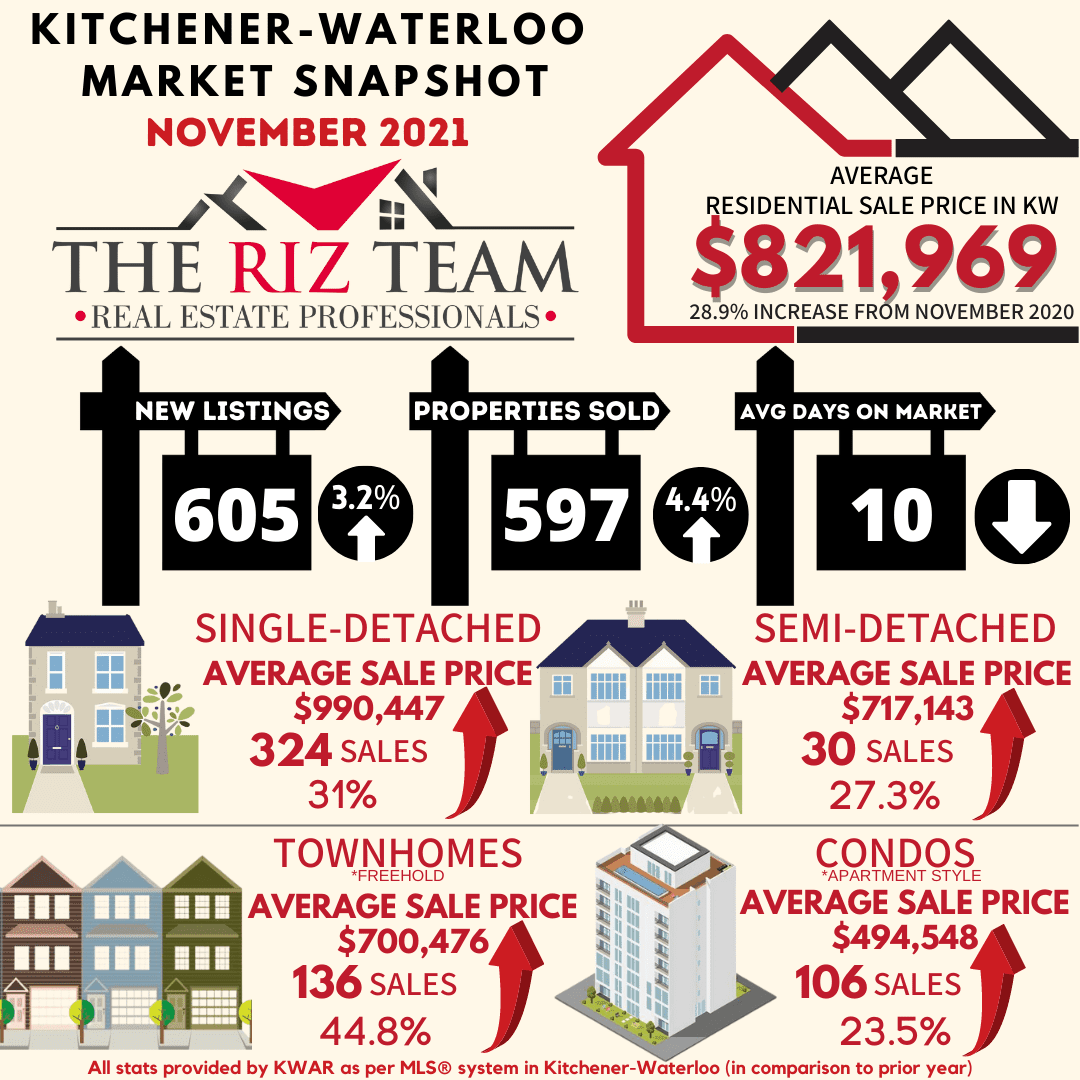
KITCHENER-WATERLOO, ON (December 3, 2021) –– There were 597 residential homes sold last month through the Multiple Listing Service® (MLS® System) of the Kitchener-Waterloo Association of REALTORS® (KWAR) setting a new record high for November. Compared to the same month last year, November sales were up 4.4% and on par with last month. The previous ten-year average number of residential sales for November is 446.

“The elevated pace of home sales we’ve seen for the past year and a half showed no sign of slowing down in November,” says KWAR’s president, Megan Bell. “Despite some speculation of there being a housing market correction in store for Waterloo Region, sustained homebuying demand combined with a record low level of inventory in November produced continued price growth in the MLS® HPI benchmark price.”

Total residential sales in November included 324 detached (down 3.9 per cent from November 2020), and 106 condominium units (up 27.7 per cent). Sales also included 30 semi-detached homes (down 25 per cent) and 136 townhouses (up 21.4 per cent).

In November, the average sale price for all residential properties in the Kitchener-Waterloo area was $821,969. This represents a 28.9 per cent increase over November 2020 and a 2 per cent decrease compared to October 2021.

  • The average price of a detached home was $990,447. This represents a 31 per cent increase from November 2020 and a decrease of 0.6 per cent compared to October 2021.
  • The average sale price for an apartment-style condominium was $494,548. This represents an increase of 23.5 per cent from November 2020 and an increase of 7.1 per cent compared to October 2021.
  • The average sale price for a townhouse was $700,476. This represents a 44.8 per cent increase from November 2020 and an increase of 0.9 per cent compared to October 2021.
  • The average sale price for a semi was $717,143. This represents an increase of 27.3 per cent compared to November 2020 and a decrease of 1.3 per cent compared to October 2021.

KWAR cautions that average sale price information can be useful in establishing long-term trends but should not be used as an indicator that specific properties have increased or decreased in value. The MLS® Home Price Index (HPI) provides the best way to gauge price trends because averages are strongly distorted by changes in the mix of sales activity from one month to the next.

The MLS® HPI composite benchmark price for all residential properties in Kitchener-Waterloo was $825,000 in November. This represents a 34.1 per cent increase over November 2020 and a 2.6 per cent increase compared to October 2021.

  • The benchmark price for a detached home was $915,800. This represents a 35.8 per cent increase from November 2020 and 3.2 per cent increase compared to October 2021.
  • The benchmark price for an apartment-style condominium was $398,000. This represents a 16.7 per cent increase from November 2020 and a 2.1 per cent decrease compared to October 2021.
  • The benchmark price for a townhouse is $627,900. This represents a 45.5 per cent increase from November 2020 and a 4.0 per cent increase compared to October 2021.

“Lack of supply continues to be the refrain in November,” says Bell. “With inventory hitting an all time low it is a tough time to be house hunting right now.”

There were 605 new listings added to the MLS® System in KW and area last month, an increase of 3.2 per cent compared to November of last year, and a 14.6 per cent decrease compared to the previous ten-year average for November.

The total number of homes available for sale in active status at the end of November was 207, a decrease of 40.2 per cent compared to November of last year, and 80.7 per cent below the previous ten-year average of 1,071 listings for November.

The number of months of inventory reached an all time low of 0.3 in November. Inventory has settled at under 1 month for thirteen consecutive months. The number of months of inventory represents how long it would take to sell off current inventories at the current rate of sales.

The average number of days to sell in November stayed at 10 days, compared to 14 days in November 2020 and a previous 5-year average of 24 days.

Bell notes that while the housing market typically slows down around the holiday season, she still expects to see a busier than normal December. “There is growing anxiety out there among buyers caused by the fear of missing out against rumblings of interest rates eventually going up in the year ahead.”

Those requiring specific information on property values should contact a local REALTOR®.  Working with a Realtor is the best way to get a complete picture of the property and community you are considering.

View our HPI tool here to learn more: https://kwar.ca/hpi-dashboard

Historical Sales by Property Type 


Months Supply of Homes for Sale

Historical Median Sales Price – By Property Type

Historical Average Sales Price – By Property Type

Average Days on Market

KWAR cautions that average sale price information can be useful in establishing long term trends but should not be used as an indicator that specific properties have increased or decreased in value. The average sale price is calculated based on the total dollar volume of all properties sold. Months Supply is the inventory of homes for sale at the end of a given month, divided by the average monthly closed sales from the last 12 months Those requiring specific information on property values should contact a local REALTOR®. REALTORS® have their fingers on the pulse of the market. They know the questions to ask, the areas to probe and what to look for so that you get a complete picture of the property and community you’re considering.

Kitchener-Waterloo Market Snapshot October 2021

Wednesday, November 3rd, 2021

PRICES CONTINUE TO INCREASE WITH STRONG HOME SALES IN OCTOBER

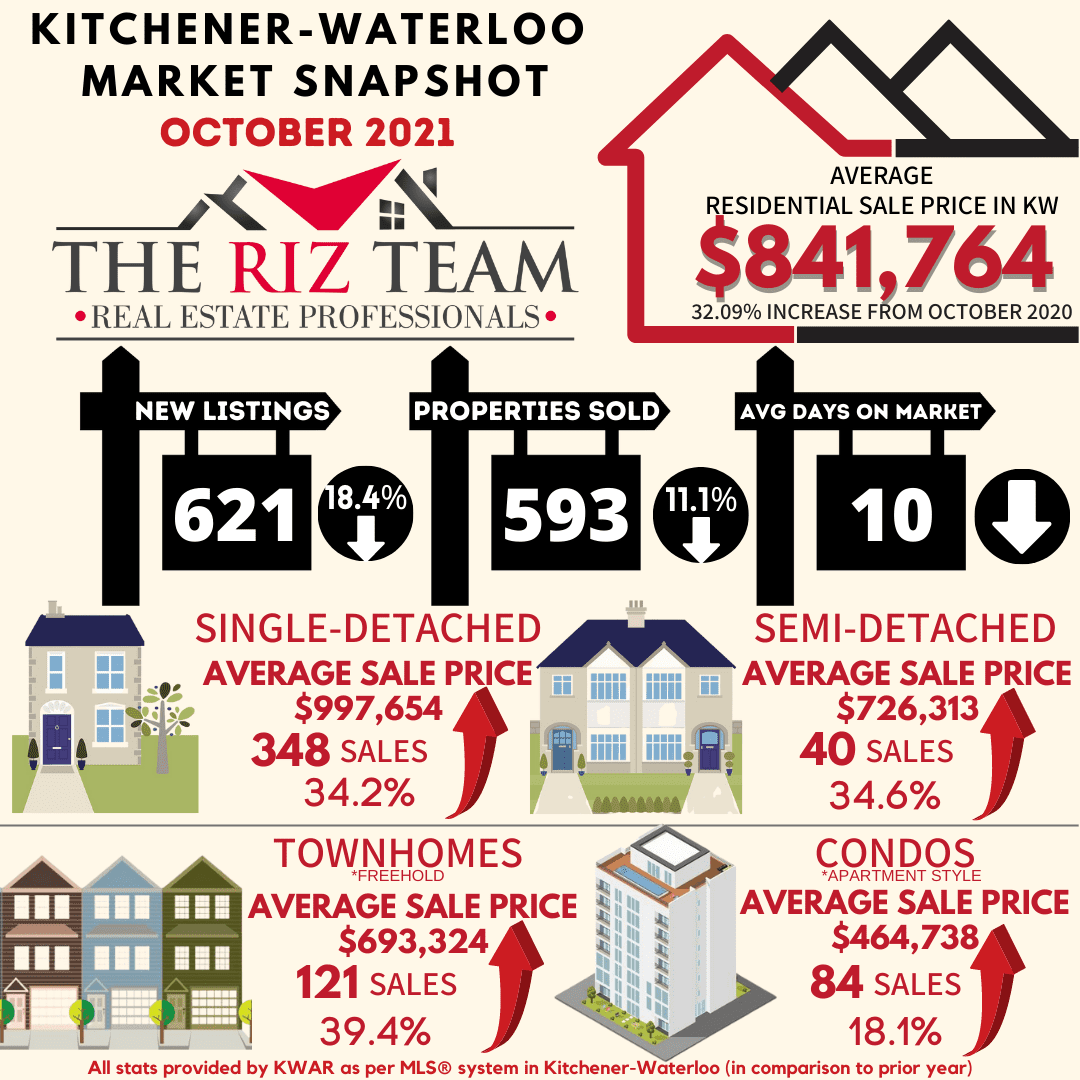
KITCHENER-WATERLOO, ON (November 3, 2021) –– A total of 593 residential homes sold last month through the Multiple Listing Service® (MLS® System) of the Kitchener-Waterloo Association of REALTORS® (KWAR), a decrease of 11.1 per cent compared to last October and a decrease of 16.5 per cent compared to September.

“While not as red-hot as last year’s record-breaking October, it was still a higher-than-normal number of home sales for the month, and the second-highest October on record,” says KWAR’s president, Nicole Pohl. “The number of listings coming on the market can scarcely keep up with the demand for homes in Waterloo region, and the continued price growth we see in October reflects this.”

Total residential sales in October included 348 detached (down 13.2 per cent from October 2020), and 84 condominium units (down 8.7 per cent). Sales also included 40 semi-detached homes (down 9.1) and 121 townhouses (down 6.9 per cent).

In October, the average sale price for all residential properties in the Kitchener-Waterloo area was $841,764. This represents a 32.9 per cent increase over October 2020 and a 6.1 per cent increase compared to September 2021.

  • The average price of a detached home was $997,654. This represents a 34.2 per cent increase from October 2020 and an increase of 3.5 per cent compared to September 2021.
  • The average sale price for an apartment-style condominium was $464,738. This represents an increase of 18.1 per cent from October 2020 and a decrease of 7.1 per cent compared to September 2021.
  • The average sale price for a townhouse was $693,324. This represents a 39.4 per cent increase from October 2020 and an increase of 7.3 per cent compared to September 2021.
  • The average sale price for a semi was $726,313. This represents an increase of 34.6 per cent compared to October 2020 and an increase of 5.6 per cent compared to September 2021.

KWAR cautions that average sale price information can be useful in establishing long-term trends but should not be used as an indicator that specific properties have increased or decreased in value. The MLS® Home Price Index (HPI) provides the best way to gauge price trends because averages are strongly distorted by changes in the mix of sales activity from one month to the next.

The MLS® HPI composite benchmark price for all residential properties in Kitchener-Waterloo was $803,900 in October. This represents a 34.3 per cent increase over October 2020 and a 2.5 per cent increase compared to September 2021.

  • The benchmark price for a detached home was $887,500. This represents a 35.5 per cent increase from October 2020 and 2.1 per cent increase compared to September 2021.
  • The benchmark price for an apartment-style condominium was $406,400. This represents a 22.7 per cent increase from October 2020 and a 3.5 per cent increase compared to September 2021.
  •  The benchmark price for a townhouse is $603,900. This represents a 42.5 per cent increase from October 2020 and a 3.8 per cent increase compared to September 2021.

“With ongoing constraints on supply versus demand, home prices continued to accelerate in October,” says Pohl.

There were 621 new listings added to the MLS® System in KW and area last month, a decrease of 18.4 per cent compared to October of last year, and a 12.1 per cent decrease compared to the previous ten-year average for October.

The total number of homes available for sale in active status at the end of October was 288, a decrease of 36 per cent compared to October of last year, and 76.5 per cent below the previous ten-year average of 1,285 listings for October.

The number of months of inventory remained at 0.5 in October. Inventory has settled at under 1 month for twelve consecutive months. The number of months of inventory represents how long it would take to sell off current inventories at the current rate of sales.

The average number of days to sell in October was 10 days, compared to 13 days in October 2020 and a previous 5-year average of 22 days.

“Affordability throughout Waterloo Region continues to be challenged, creating significant barriers especially for many people who are just trying to get their foot in the door of the housing market,” says Pohl. “We are urging all levels of government to work together to tackle the supply issue facing housing markets across the country and right here in Waterloo region.”

Over the past two weeks representatives of KWAR, alongside REALTORS® from across Canada have been meeting with Members of Parliament to talk about Canada’s economic recovery plan and the need to prioritize housing. You can read about the ideas that REALTORS® are proposing here:  https://www.crea.ca/mp

Those requiring specific information on property values should contact a local REALTOR®.  Working with a Realtor is the best way to get a complete picture of the property and community you are considering.

View our HPI tool here to learn more: https://kwar.ca/hpi-dashboard

Historical Sales By Property Type

Months Supply of Homes for Sale

Historical Median Sales Price – By Property Type

Historical Average Sales Price – By Property Type

Average Days on Market Chart

KWAR cautions that average sale price information can be useful in establishing long term trends but should not be used as an indicator that specific properties have increased or decreased in value. The average sale price is calculated based on the total dollar volume of all properties sold. Months Supply is the inventory of homes for sale at the end of a given month, divided by the average monthly closed sales from the last 12 months Those requiring specific information on property values should contact a local REALTOR®. REALTORS® have their fingers on the pulse of the market. They know the questions to ask, the areas to probe and what to look for so that you get a complete picture of the property and community you’re considering.

Kitchener-Waterloo Market Snapshot September 2021

Monday, October 4th, 2021

HOME PRICES CONTINUE TO CLIMB IN SEPTEMBER

LISTINGS CONTINUE TO BE OUTSTRIPPED BY BUYING DEMAND

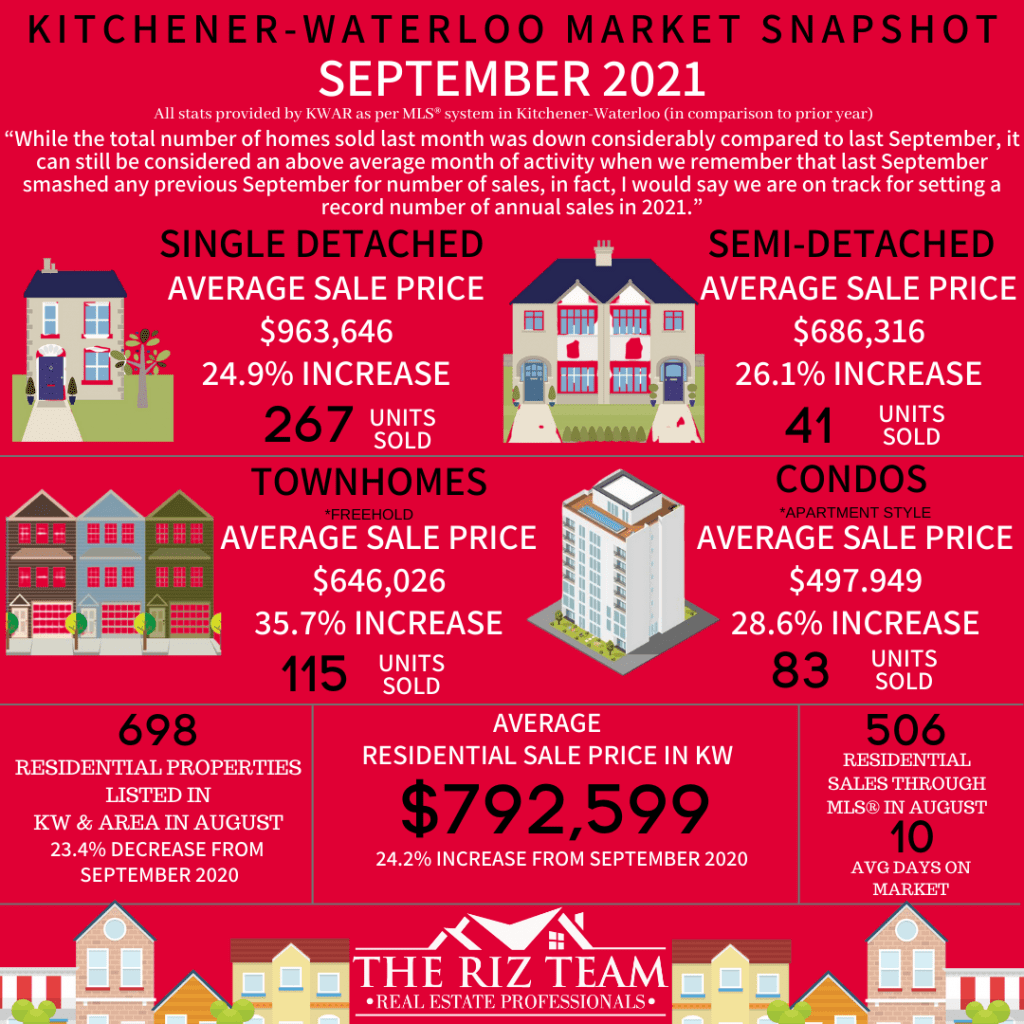
KITCHENER-WATERLOO, ON (October 4, 2021) –– A total of 506 residential homes sold last month through the Multiple Listing Service® (MLS® System) of the Kitchener-Waterloo Association of REALTORS® (KWAR), a decrease of 32.1 per cent compared to last September and a decrease of 5.9 per cent compared to August.

“While the total number of homes sold last month was down considerably compared to last September, it can still be considered an above average month of activity when we remember that last September smashed any previous September for number of sales,” says KWAR’s president, Nicole Pohl. “In fact, I would say we are on track for setting a record number of annual sales in 2021.”

Total residential sales in September included 267 detached (down 37.3 per cent from September 2020), and 83 condominium units (down 11.7 per cent). Sales also included 41 semi-detached homes (down 21.2) and 115 townhouses (down 33.5 per cent).

In September, the average sale price for all residential properties in the Kitchener-Waterloo area was $792,599. This represents a 24.2 per cent increase over September 2020 and a 5.7 per cent increase compared to August 2021.

  • The average price of a detached home was $963,646. This represents a 24.9 per cent increase from September 2020 and an increase of 7.9 per cent compared to August 2021.
  • The average sale price for an apartment-style condominium was $497,949. This represents an increase of 28.6 per cent from September 2020 and an increase of 12.4 per cent compared to August 2021.
  • The average sale price for a townhouse was $646,026. This represents a 35.7 per cent increase from September 2020 and an increase of 3.7 per cent compared to August 2021.
  • The average sale price for a semi was $686,316. This represents an increase of 26.1 per cent compared to September 2020 and an increase of 0.5 per cent compared to August 2021.


KWAR cautions that average sale price information can be useful in establishing long-term trends but should not be used as an indicator that specific properties have increased or decreased in value. The MLS® Home Price Index (HPI) provides the best way to gauge price trends because averages are strongly distorted by changes in the mix of sales activity from one month to the next.

The MLS® HPI composite benchmark price for all residential properties in Kitchener-Waterloo was $784,200 in September. This represents a 33.0 per cent increase over September 2020 and a 3.5 per cent increase compared to August 2021.

  • The benchmark price for a detached home was $869,220. This represents a 34.2 per cent increase from September 2020 and 3.8 per cent increase compared to August 2021.
  • The benchmark price for an apartment-style condominium was $392,600. This represents a 21.5 per cent increase from September 2020 and a 3.1 per cent increase compared to August 2021.
  • The benchmark price for a townhouse is $581,700. This represents a 40.0 per cent increase from September 2020 and a 2.4 per cent increase compared to August 2021.

There were 698 new listings added to the MLS® System in KW and area last month, a decrease of 23.4 per cent compared to September of last year, and a 13 per cent decrease compared to the previous ten-year average for September.

The total number of homes available for sale in active status at the end of September was 345, a decrease of 35.3 per cent compared to September of last year, and 73.2 per cent below the previous ten-year average of 1,285 listings for September.

“Home prices reached all new highs in September, “says Pohl. “And while there is a growing call to add more transparency to how real estate is traded in Ontario —the brutal reality of this market is that supply is simply not keeping up with demand and that is what is driving up prices.”

The President of KWAR says: “While there are many who have zeroed in on the blind bidding process, the greater concern is that homes are being purchased without all the normal conditions you would see in a balanced market. As a practicing REALTOR® I completely support and hope the government will add the ability for REALTORS® to provide greater transparency on offers,” says Pohl. “But as it is, we are legislatively restricted from disclosing anything more than simply the number of offers, which is not working for homebuyers.”

The number of months of inventory nudged up slightly from August’s 0.4 months to half a month in September. Inventory has settled at under 1 month for the past 11 consecutive months. The number of months of inventory represents how long it would take to sell off current inventories at the current rate of sales.

The average number of days to sell in September was 10 days, compared to 14 days in September 2020 and a previous 5-year average of 23 days.

Those requiring specific information on property values should contact a local REALTOR®.  Working with a Realtor is the best way to get a complete picture of the property and community you are considering.

View our HPI tool here to learn more: https://kwar.ca/hpi-dashboard

Historical Sales By Property Type

Months Supply of Homes for Sale


Historical Median Sales Price – By Property Type

Historical Average Sales Price – By Property Type

Average Days on Market

KWAR cautions that average sale price information can be useful in establishing long-term trends but should not be used as an indicator that specific properties have increased or decreased in value. The average sale price is calculated based on the total dollar volume of all properties sold. Months Supply is the inventory of homes for sale at the end of a given month, divided by the average monthly closed sales from the last 12 months Those requiring specific information on property values should contact a local REALTOR®. REALTORS® have their fingers on the pulse of the market. They know the questions to ask, the areas to probe, and what to look for so that you get a complete picture of the property and community you’re considering.

Kitchener-Waterloo Market Snapshot July 2021

Thursday, August 5th, 2021


VERY LOW INVENTORY COMBINED WITH STRONG DEMAND KEEPS HOME PRICES HUMMING IN JULY

“Although home sales slowed down to some degree in July compared to June, overall demand remains very strong,” says Nicole Pohl, President of KWAR. “The current inventory of homes available for sale in the Kitchener-Waterloo and area is extremely low, making Waterloo Region one of the most competitive markets in Ontario.”

Total residential sales in July included 339 detached (down 27.1 per cent from July 2020), and 91 condominium units (up 30 per cent). Sales also included 46 semi-detached homes (down 4.2) and 135 townhouses (down 11.8 per cent).

In July, the average sale price for all residential properties in the Kitchener-Waterloo area was $755,681. This represents a 18.2 per cent increase over July 2020 and a 0.6 per cent decrease compared to June 2021.

      • The average price of a detached home was $907,192. This represents a 21.9 per cent increase from July 2020 and a decrease of 1.4 per cent compared to June 2021.
      • The average sale price for an apartment-style condominium was $429,630. This represents an increase of 6.7 per cent from July 2020 and a decrease of 3.6 per cent compared to June 2021.
      • The average sale price for a townhouse was $623,732. This represents a 33.8 per cent increase from July 2020 and an increase of 5.4 per cent compared to June 2021.
      • The average sale price for a semi was $667,570. This represents an increase of 28.6 per cent compared to July 2020 and an increase of 2.9 per cent compared to June 2021.

KWAR cautions that average sale price information can be useful in establishing long-term trends but should not be used as an indicator that specific properties have increased or decreased in value. The MLS® Home Price Index (HPI) provides the best way to gauge price trends because averages are strongly distorted by changes in the mix of sales activity from one month to the next.

The MLS® HPI composite benchmark price for all residential properties in Kitchener-Waterloo was $748,700 in July. This represents a 30.5 per cent increase over July 2020 and a 0.4 per cent increase compared to June 2021.

  • The benchmark price for a detached home was $822,300. This represents a 31.1 per cent increase from July 2020 and 0.2 per cent increase compared to June 2021.
  • The benchmark price for an apartment-style condominium was $385,900. This represents a 19.5 per cent increase from July 2020 and a 3.3 per cent increase compared to June 2021.
  • The benchmark price for a townhouse is $564,500. This represents a 40 per cent increase from July 2020 and a 0.4 per cent decrease compared to June 2021.

“The housing market took a bit of a breather last month,” notes Pohl. “July is typically a quieter month with families taking vacation, and with the region coming out of lockdown there were certainly more staycations happening.  But we do anticipate the market will pick up steam again and it will be another busy fall.”

There were 675 new listings added to the MLS® System in KW and area last month, a decrease of 24 per cent compared to July of last year, and a 14.4 per cent decrease compared to the previous ten-year average for July.

The total number of homes available for sale in active status at the end of July was 281, a decrease of 52.7 per cent compared to July of last year, and 79.1 per cent below the previous ten-year average of 1,346 listings for July.

The number of months of inventory was 0.4 in July, a decline from 0.5 months in June. Inventory has numbered less than 1 month since October. The number of months of inventory represents how long it would take to sell off current inventories at the current rate of sales.

The average number of days to sell in July was 11 days, compared to 17 days in July 2020 and a previous 5-year average of 22 days.

Those requiring specific information on property values should contact a local REALTOR®.  Working with a Realtor is the best way to get a complete picture of the property and community you are considering.

View our HPI tool here to learn more: https://kwar.ca/hpi-dashboard

Historical Sales By Property Type

Months Supply of Homes for Sale

Historical Median Sales Price – By Property Type

Historical Average Sales Price – By Property Type

Average Days on Market

KWAR cautions that average sale price information can be useful in establishing long-term trends but should not be used as an indicator that specific properties have increased or decreased in value. The average sale price is calculated based on the total dollar volume of all properties sold. Months Supply is the inventory of homes for sale at the end of a given month, divided by the average monthly closed sales from the last 12 months Those requiring specific information on property values should contact a local REALTOR®. REALTORS® have their fingers on the pulse of the market. They know the questions to ask, the areas to probe and what to look for so that you get a complete picture of the property and community you’re considering.

Kitchener Market Snapshot for January 2021

Thursday, February 4th, 2021


KITCHENER-WATERLOO, ON (Feb 4, 2021) ––There were 351 residential homes sold through the Multiple Listing Service (MLS® System) of the Kitchener-Waterloo Association of REALTORS® in January, an increase of 24.9 per cent compared to January 2020, and an increase of 1.4 per cent compared to the previous month. The previous 10-year average number of residential sales for January is 286.

“January’s home sales were more active than what we typically see this time of year,” says Nicole Pohl, President of KWAR. “But nothing has been typical about our housing market.”

Total residential sales in January included 201 detached (up 31.3 per cent from January 2020), and 71 condominium units (up 97 per cent). Sales also included 21 semi-detached homes (unchanged) and 56 freehold townhouses (down 17.6 per cent).

In January, the average sale price of all residential properties sold in 2021 increased by 23.9 per cent to $695,582 compared to the same month last year. Meanwhile, the average price of a detached home hit a new milestone by exceeding 800-thousand-dollars for the first time, coming in at $853,945 an increase of 27.3 per cent. During this same period, the average sale price for an apartment-style condominium was $383,196 for a decrease of 1.4 per cent. Townhomes and semis sold for an average of $566,345 (up 29 per cent) and $626,512 (up 29.3 per cent) respectively.

The median price of all residential properties sold in January increased 25.9 per cent to $680,000 and the median price of a detached home during the same period increased 23.3 per cent to $801,500.

“With demand for homes unabated and consumer preferences leaning predominantly toward single detached homes, in January we saw buyers paying a premium for this property type,” says Pohl. “Conversely, even as condo sales were increasing in January, we saw prices for this style of housing soften by comparison.”

KWAR’s president points to supply not being able to keep up with continuing demand, much of it coming from the GTA, for the strong increases in home prices in Waterloo Region and in many other parts across the province. The number of months of inventory in Waterloo region has numbered less than 1 month since October. The number of months of inventory represents how long it would take to sell off current inventories at the current rate of sales.

There were 432 new listings added to the MLS® System in KW and area last month, a decrease of 7.4 per cent compared to January of last year, and 37.6 per cent decrease compared to the previous ten-year average for January.

The average number of days to sell in January was 16 days, compared to 22 days in January 2020 and a previous 5-year average of 30 days

KWAR cautions that average sale price information can be useful in establishing long term trends but should not be used as an indicator that specific properties have increased or decreased in value. The average sale price is calculated based on the total dollar volume of all properties sold. Months Supply is the inventory of homes for sale at the end of a given month, divided by the average monthly closed sales from the last 12 months Those requiring specific information on property values should contact a local REALTOR®. REALTORS® have their fingers on the pulse of the market. They know the questions to ask, the areas to probe and what to look for so that you get a complete picture of the property and community you’re considering.


5 CRITERIA FOR PRICING A HOME

Monday, October 21st, 2019

When you put your home up for sale, one of the best ways to determine the asking price is to look at comparable sales. There’s rarely a perfect apples-to-apples comparison, so a pricing decision often relies on comparisons to several recent sales in the area. Here are five criteria to look for in a sales comparison.

  1. Location: Homes in the same neighborhood typically follow the same market trends. Comparing your home to another in the same neighborhood is a good start, but comparing it to homes on the same street or block is even better.
  2. Date of sale: It varies by location, but housing markets can see a ton of fluctuation in a short time period. It‘s best to use the most recent sales data available.
  3. Home build: Look for homes with similar architectural styles, numbers of bathrooms and bedrooms, square footage, and other basics.
  4. Features and upgrades: Remodeled bathrooms and kitchens can raise a home’s price, and so can less flashy upgrades like a new roof or HVAC system. Be sure to look for similar bells and whistles.
  5. Sale types: Homes that are sold as short sales or foreclosures are often in distress or sold at a lower price than they’d receive from a more typical sale. These homes are not as useful for comparisons.

The Scoop on Home Inspections

Monday, November 27th, 2017

A home inspection, while not required in all areas, should be an indispensable part of your home buying or selling process. It is worth the cost up front to save you money and headaches down the road.

What a Home Inspection Entails

A home inspector will provide a thorough inspection of the home’s interior and exterior to alert you to any damage that may cause potential problems in the future. He or she will look at the house as a whole and evaluate how the different components work together and affect each other. The inspector will identify any areas that need repairs or are unsafe and advise you on what your next steps should be.

Benefits for a Home Buyer

When you are purchasing a home, you want to know that it is going to be safe for you and your family for many years to come. Obviously, you don’t want to buy a home that is rotting from the inside out. A home inspector can alert you to issues that are minor right now but could potentially become much more serious in the future. Purchasing a home is a major decision. The results of the inspection may lead you to reconsider buying a particular house if it is likely to have a lot of problems in the future. It can protect you from huge unexpected expenses.

Benefits for a Home Seller

If you are the one selling the home, it is a good idea to request a home inspection prior to listing your home on the market. Potential buyers of your home are likely to have an inspection done, and you don’t want there to be any surprises. If there are issues with the house, buyers may rescind their offers or make offers only on the condition that you repair the problems before they finalize the purchase. It is better if you know about any problems in advance. An inspection gives you the opportunity to make sure the house is in its best possible condition when buyers start coming to look at it. This will streamline the purchasing process and make potential buyers feel much more confident that your home is the right choice for them.

When you are ready to buy or sell a home, or have any questions regarding home inspections, get in touch!

Why Use a REALTOR®?

Monday, November 6th, 2017

REALTORS® Streamline the Process of Selling Your Home

So, it is time to move onwards and upwards in life and move house! Moving is a dynamic process that involves much more than a simple transaction. From marketing to proper evaluations and inspections, it is advisable to use the services of an experienced professional realtor to make sure everything goes smoothly.

The following challenges are what a professional can help you avoid when selling your home:

Time Spent on Potential Buyers

Selling a home by yourself will be a significant time commitment that should not be underestimated. Perhaps the greatest commitment to your time will be in scheduling and hosting viewings of your property. Are you ready and able to pick up the phone every time you have an inquiry? Are you able to sift out the simply curious from real potential buyers to avoid unnecessary viewings? Realtors are experienced in asking the kind of qualifying questions that sort out the wheat from the chaff. And how many evenings, weekends, and weekday hours are you able to give up to show interested parties your home? You’ll then have to pro-actively follow up on interest after viewings.

Marketing and Valuation

As well as the time involved in doing your own marketing, there are also practical considerations around how successfully you will get the information out there. Yes, you can list your property on various websites and specialist portals that realtors use. However, realtors also have extended networks of active potential buyers that they will reach out to with information on your property, a channel you will almost certainly not have access to.

You would have to be confident that you could realistically value your property correctly if you chose to put your home on the market yourself. Things you may be oblivious to can be widely considered as flaws by potential buyers. A professional realtor has the experience to point those out and suggest small changes which will make your property more attractive.

Negotiating

Realtors are both objective and experienced, having negotiated hundreds or thousands of real estate transactions. They know how to spot the signs a potential buyer has formed an emotional attachment towards your property and how to leverage that to your benefit. They also know how to spot signs of nervousness that might pose a threat to the eventual sale and how best to allay such fears. They won’t make compromises because they have been charmed by a prospective buyer, or behave irrationally because they don’t like them on a personal level.

Avoiding Getting Sued

This is a genuine concern that owners operating without a realtor must be acutely aware of. There is a lot of paperwork involved in the sale of a property. Getting it wrong can at best delay the sale and at worst lead to putting yourself in danger of legal proceedings. Seller’s disclosure is a particular concern. What can be considered a defect, hazard, or nuisance varies depending on where you live. Realtors know exactly what is required of the seller. If a mistake is made, then they have insurance, ensuring that a seller does not personally suffer.

Selling your home in the Kitchener/Waterloo, Alberta area? Local real estate agent Riz Jadavji can ensure that you have a successful experience selling your home!

How to Get Top Value for Your Home

Thursday, June 1st, 2017

This article appeared in the Saturday, May 20, 2017 issue of Waterloo Region Homes.

Knock Knock? Who’s there? Someone who wants to buy your house? Consumer Beware! For most readers this is no newsflash: Waterloo region’s residential real estate market is red hot!

Like many markets across the Greater Golden Horseshoe (GGH), we in Waterloo region have been experiencing record breaking sales combined with low inventory levels for months now. In other words, it is a sellers’ market.

During the first quarter of 2017, there were 1,532 home sales through the Multiple Listing System (MLS® System) of the Kitchener-Waterloo Association of REALTORS® (KWAR). The average price of a residential home during this same period increased a whopping 28.3 per cent on a year-over-year basis to $468,653.

While statistics like this can paint some of the picture, what it cannot tell you is what your home will sell for. The fact is no one really knows what price their home will fetch until it is put to the test of being listed with your Realtor on the MLS® System.

These days we are seeing some sticker shock. For example, when a house priced in the $300,000 range subsequently sells for a hundred-thousand dollars over asking! Does this mean that every home listed for $300,000 will bring substantially more? Absolutely not! In fact, it might sell for exactly $300,000 or even less. Only the market can determine sale price, but the experience of a knowledgeable local Realtor can certainly help predict it.

With a shortage of listings (we have been sitting at less than two month’s inventory or less for the past 12 months) inventory levels are at an unprecedented low and buyer creativity at an all-time high. One strategy some buyers and their Realtors have turned to in these times is good old fashioned door-knocking to find homeowners who could be tempted to sell while the market is hot.

Now, knowing what you do know about today’s market, what would you do if someone came knocking on your door tomorrow, offering you X amount for your house? Would you know if what they were offering was fair market value?

There is certainly nothing wrong with this practice and when it works out it can be a win-win for both buyer and seller. On the other hand, my caution to homeowners is: the person doing the knocking may be offering you a price that sounds attractive, but how can you be sure?

Sometimes in this scenario, sellers are attracted by the idea of a quick hassle-free transaction. They’ve been offered a price that is way more than what they originally paid for their home, and maybe even way more than what they ever dreamed they could ever get.

I have heard a few anecdotes recently where the buyer knocking on the door has actually encouraged the homeowner NOT to use a Realtor (It would be unethical and illegal for a Realtor to do this by the way).

In one case, the gentleman did sell his house without the aid of a Realtor, and the price he sold it for – while far more than what he paid when he purchased it over 30 years ago, was substantially less than what he would have got had he put it on the open market.

I think the Canadian Real Estate Association’s latest advertising campaign says it best: “Live with No Regrets.” Using a Realtor is the most important decision you can make when buying or selling.

On whatever side of the transaction you are on, if you have a Realtor in your corner (i.e. you’ve entered into either a listing agreement or a buyer representation agreement) they have a legal duty to only act in your best interests. Furthermore, they are bound by the Real Estate Council of Ontario, the Canadian Real Estate Association and their local real estate board’s Code of Ethics, rules and regulations.

When your home is listed by a Realtor you get the counsel of someone who understands the market and can guide you on the best pricing and selling strategy. If you’re purchasing, your Realtor will provide you with insight and advice on the home, the neighbourhood, and when it comes to submitting an offer, how many other buyers you are competing against and advice on the price you offer. So what should you do when someone comes knocking on your door? Please take my advice: take their information and then talk to a Realtor. He or she will be able to assist you in reviewing the doorknockers’ offer and help you understand all of your options to ensure you end up with the offer that is best for you.


Screen Door Decor

Monday, July 27th, 2015

Screen DoorsScreen doors let the breeze in and keep the bugs out. They open your home to the sounds and scents of summer, and help cool your house without wasting energy on air conditioning. Want to let in a little more summer this year? Here’s what you need to know about picking the perfect door.

Screen doors have come a long way from the hard-to-open metal models and flapping wood doors of your childhood. Available in metal, vinyl or wood, many feature smooth hydraulic or pneumatic closers and springs or chain stops that keep them from slamming shut or swinging open. Designed for both practicality and curb appeal, doors are available in a wide variety of colours, styles and finishes. Your choices include:

1. Basic vinyl or aluminum. Durable and affordable, these doors come in a surprising variety of attractive styles; you’ll find everything from traditional designs to art deco-inspired geometrics.
2. Storm/screen door combo. Traditionally, people replace the screen door with a storm door in the winter. A combination door makes the “swap” easier; simply remove or slide the glass down in summer and replace it with a screen.
3. Wood. From rustic doors featuring carved animals to pretty “granny doors,” wood can really add to the look of your home. However, winter cold and damp can be hard on them, so manufacturers suggest that you take them down when it gets cold to prevent warping.
4. Sliding. Inexpensive and easy to maintain, sliding screen doors that go with patio doors make it easy to open up your home to a fresh breeze.
5. Retractable screens. If you don’t like the look of a screen door, these are a great option, and are available at your local home improvement store. Screens pull out from the sides and lock shut with a magnetic catch. Handy homeowners will be able to install them with little effort.
With the right screen door for your home, comfort and curb appeal are a breeze!

Tips for installation
Thinking about installing your screen door yourself? Manufacturers include installation instructions that only require hand tools, but most DIY resources suggest an intermediate level of “handiness.” If that doesn’t sound like you, consider using an experienced carpenter or the store’s installation service.

Condo Cool
You don’t have to live in a house to kick back and enjoy the breeze. Welcome summer into your space by installing a screen door to your balcony. It’s a great way to make your indoor and outdoor spaces feel unified and to make your condo feel more spacious.


© Copyright 2017, Real Estate Websites by Redman Technologies Inc. | Privacy Policy | Disclaimer | Sitemap

MLS®, REALTOR®, and the associated logos are trademarks of The Canadian Real Estate Association.

The data included on this website is deemed to be reliable, but is not guaranteed to be accurate by the Kitchener-Waterloo Real Estate Board. The trademarks REALTOR®, REALTORS® and the REALTOR® logo are controlled by The Canadian Real Estate Association (CREA) and identify real estate professionals who are members of CREA. Used under license.