The Riz Team Blog

Archive for the ‘Enhance Your Home’ Category

Kitchener Waterloo Market Snapshot March 2024

Thursday, April 4th, 2024

Waterloo Region Home Sales Sluggish in March, Prices Steady

Despite the challenging market conditions, the first quarter of 2024 saw an increase in home sales, marking an 8.0 per cent rise compared to the previous year. However, these figures still fall short of the first-quarter sales of the past decade.  

“While home sales in Waterloo Region hit a record low for March in over two decades, we’re also witnessing a positive trend,” says Christal Moura, president of WRAR.  Over the past three months, prices and activity have started to pick up, and I expect this momentum will continue into the spring.”  

If you are considering to Sell your home or Buy a home in the next short while it would be highly beneficial for you to connect with one of our Team Agents at

The Riz Team

Do you want to know what your home is worth today? Click Below for our Online No Obligation Market EvaluationClick Here

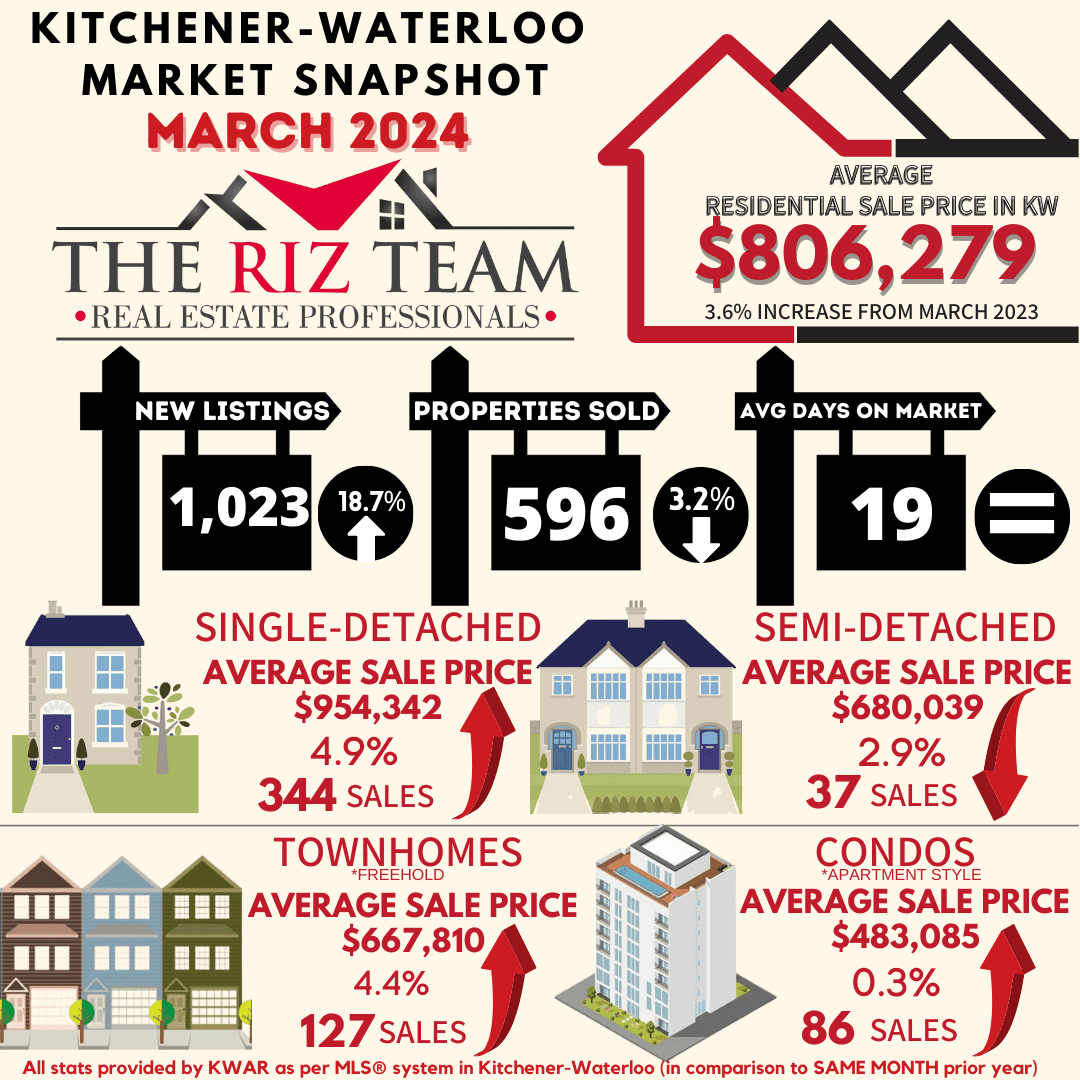
WATERLOO REGION, ON (April 4, 2024) —In March, a total of 596 homes were sold via the Multiple Listing Service® (MLS®) System of the Waterloo Region Association of REALTORS® (WRAR). This represents a decrease of 3.2% compared to the same period last year and a decline of 33.4% compared to the average number of homes sold in the previous 5 years for the same month. 

Despite the challenging market conditions, the first quarter of 2024 saw an increase in home sales, marking an 8.0 per cent rise compared to the previous year. However, these figures still fall short of the first-quarter sales of the past decade. 

“While home sales in Waterloo Region hit a record low for March in over two decades, we’re also witnessing a positive trend,” says Christal Moura, president of WRAR.  Over the past three months, prices and activity have started to pick up, and I expect this momentum will continue into the spring.”    

Total residential sales in March included 344 detached (down 3.9 per cent from March 2023), and 127 townhouses (down 0.8 per cent). Sales also included 86 condominium units (down 1.1 per cent) and 37 semi-detached homes (down 11.9 per cent).  

In March, the average sale price for all residential properties in Waterloo Region was $806,279. This represents a 3.6 per cent increase compared to March 2023 and a 6.6 per cent increase compared to February 2024.  

  • The average price of a detached home was $954,342. This represents a 4.9 per cent increase from March 2023 and an increase of 7.3 per cent compared to February 2024.  
  • The average sale price for a townhouse was $667,810. This represents a 4.4 per cent increase from March 2023 and an increase of 6.0 per cent compared to February 2024.  
  • The average sale price for an apartment-style condominium was $483,085. This represents an increase of 0.3 per cent from March 2023 and an increase of 5.3 per cent compared to February 2024.  
  • The average sale price for a semi was $680,039. This represents a decrease of 2.9 per cent compared to March 2023 and an increase of 1.0 per cent compared to February 2024. 

March_Average_Sales_Price-By_Property_Type

MLS® Home Price Index Benchmark Price 

  Kitchener-Waterloo  Cambridge 
Benchmark Type:  March 2024  Monthly % Change  Yr./Yr. % Change  March 2024  Monthly % Change  Yr./Yr. % Change 
Composite  $740,900  1.6  0.0  $747,500  0.7  0.9 
Detached  $853,800  1.5  1.3  $780,100  0.8  1.1 
Townhouse  $614,900  2.3  1.3  $652,400  0.6  2.4 
Apartment  $461,900  2.1  -0.7  $490,500  2.8  3.4 

March 2024 HPI Image for STats Release

“Home prices have been gradually increasing since December, which is a typical trend,” explains Moura. “The rate and extent of further increases will depend on the willingness and patience of potential home buyers who have been waiting for lower interest rates before making their purchase. With the Bank of Canada not anticipated to make any rate changes before its June meeting, some potential home buyers may feel stuck in limbo.” 

The president of WRAR recommends that anyone interested in buying or selling a property in Waterloo Region seek advice from a local REALTOR® regarding the current market conditions. This will enable them to make an informed decision that aligns with their goals and priorities.  

There were 1,023 new listings added to the MLS® System in Waterloo Region last month, an increase of 18.7 per cent compared to March last year and a 15.9 per cent decrease compared to the previous ten-year average for March.  

The total number of homes available for sale in active status at the end of March was 1,081 an increase of 54.0 per cent compared to March of last year and 1.1 per cent below the previous ten-year average of 1,093 listings for March. 

At the end of March, there were 1.9 months of inventory, a 58.3 percent increase compared to last year and 18.8 percent above the previous 10-year average. The number of months of inventory represents how long it would take to sell off current inventories at the current sales rate.   

The average number of days to sell in March was 19, the same number as March 2023. The previous 5-year average is 18 days.   

These statistics provide a snapshot of the real estate market in the Waterloo Region in March, showing both positive and challenging aspects for buyers and sellers. WRAR encourages buyers to reach out to local Realtors for valuable insights about the current state of the local market and to receive tailored advice based on their specific needs. 

View our HPI tool here to learn more: https://wrar.ca/hpi/ 

Average Sales Price – Municipality

March_Average_Sales_Price-By_Property_Type

Average Sales Price – Township

March2024-Average_Sales_Price-By_Township

Monthly Sales By Property Type

March2024-Sales_by_Property_type

Monthly Supply of Homes for Sale

March2024-Supply_of_homes_for_sale

Monthly Supply of Homes for Sale – By Property Type

March2024-Supply_of_homes_for_sale-By_property-type

Monthly Median Sales Price – By Property Type

March2024-Median_Sales_Price-By_Property_Type

Monthly Average Sales Price – By Property Type

March2024-Average_Sales_Price-By_property_type

Monthly Average Days on Market

02.2024-Average_Days_on_Market

WRAR cautions that average sale price information can help identify long-term trends but should not be to indicate that specific properties have increased or decreased in value. The average sale price is calculated based on the total dollar volume of all properties sold. Months Supply is the inventory of homes for sale at the end of a given month, divided by the average monthly closed sales from the last 12 months. Those requiring specific information on property values should contact a Waterloo Region REALTOR®. REALTORS® have their fingers on the pulse of the market. They know the questions to ask, the areas to probe and what to look for so that you get a complete picture of the property and community you’re considering.

Kitchener Waterloo Market Snapshot July 2023

Thursday, August 3rd, 2023

Strong Listing Activity in July

If you are considering to Sell your home or Buy a home in the next short while it would be highly beneficial for you to connect with one of our Team Agents at

The Riz Team

Do you want to know what your home is worth today? Click Below for our Online No Obligation Market EvaluationClick Here

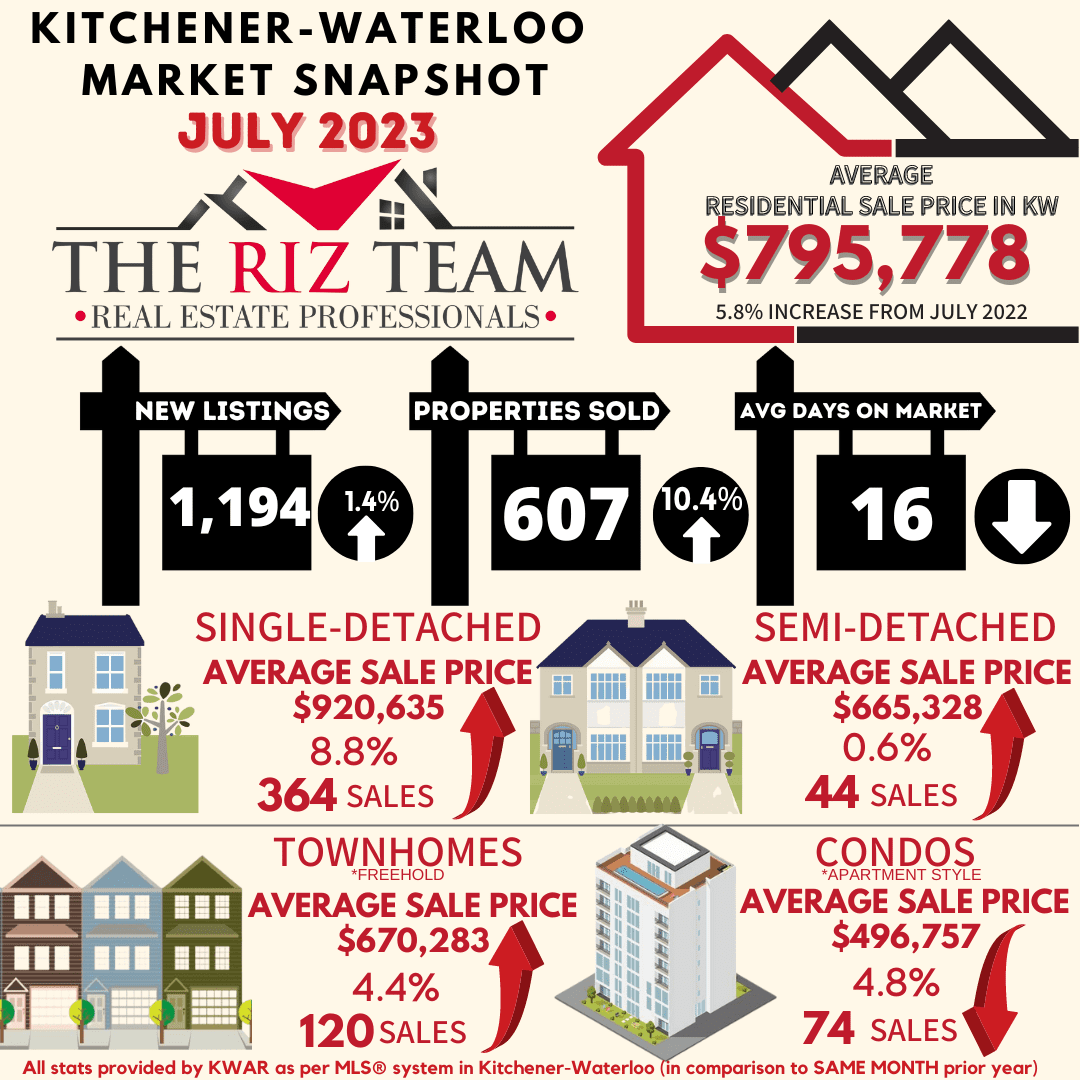
WATERLOO REGION, ON (August 3, 2023) — In July, there were 607 homes sold through the Multiple Listing Service® (MLS®) System of the Waterloo Region Association of REALTORS® (WRAR), representing an increase of 10.4 per cent compared to the previous year and a decline of 21.6 per cent compared to the previous 5-year average for the month.

“The Waterloo Region residential real estate market experienced some growth in terms of unit sales and supply in July, with home prices showing moderate fluctuations,” says Bell. “Despite the Bank of Canada’s most recent interest rate hike, we saw more sellers coming off the sidelines with new listing activity reaching its second highest level for the month of July in over a decade.”

Total residential sales in July included 364 detached (up 8.3 per cent from July 2022), and 120 townhouses (up 7.1 per cent). Sales also included 74 condominium units (up 15.6 per cent) and 44 semi-detached homes (up 22.2 per cent).

In July, the average sale price for all residential properties in Waterloo Region was $795,778. This represents a 5.8 per cent increase compared to July 2022 and a 5.2 per cent decrease compared to June 2023.

  • The average price of a detached home was $920,635. This represents an 8.8 per cent increase from July 2022 and a decrease of 8.4 per cent compared to June 2023.
  • The average sale price for a townhouse was $670,283. This represents a 4.4 per cent increase from July 2022 and an increase of 0.5 per cent compared to June 2023.
  • The average sale price for an apartment-style condominium was $496,757. This represents a decrease of 4.8 per cent from July 2022 and an increase of 5.6 per cent compared to June 2023.
  • The average sale price for a semi was $665,328. This represents an increase of 0.6 per cent compared to July 2022 and a decrease of 3.8 per cent compared to June 2023.

WRAR cautions that average sale price information can be useful in establishing long-term trends but should not be used as an indicator that specific properties have increased or decreased in value. The MLS® Home Price Index (HPI) provides the best way to gauge price trends because averages are strongly distorted by changes in the mix of sales activity from one month to the next.

July Average Sales Price by Property Type

MLS® Home Price Index Benchmark Price

Kitchener-Waterloo Cambridge
Benchmark Type: July 2023 Monthly % Change Yr./Yr. % Change July 2023 Monthly % Change Yr./Yr. % Change
Composite $765,000 -1.7 1.8 $764,600 -1.8 -1.2
Detached $869,000 -2.3 4.4 $797,100 -2.2 1.2
Townhouse $648,700 0.6 -0.3 $663,200 0.5 -11.9
Apartment $484,900 1.2 -5.5 $492,600 2.2 -14.8


July 2023 HPI Image for Stats Release

“In this ever-evolving market, demand persists despite the changing landscape. Increased listing activity is certainly welcomed to help offset the lack of supply and pent-up demand,” says Bell. “Working with a local REALTOR® is vital in navigating these shifting influences during the homebuying and selling process. Waterloo Region properties remain highly sought-after due to our diverse economy and desirable community, solidifying us in a competitive market.”

There were 1,194 new listings added to the MLS® System in Waterloo Region last month, an increase of 1.4 per cent compared to July of last year and a 10.8 per cent increase compared to the previous ten-year average for July.

The total number of homes available for sale in active status at the end of July was 1,107, a decrease of 14.8 per cent compared to July of last year and 22.6 per cent below the previous ten-year average of 1431 listings for July.

There were 2.0 months of inventory at the end of July, up slightly from the end of June and in line with the previous 10-year average. The number of months of inventory represents how long it would take to sell off current inventories at the current sales rate.

The average number of days to sell in July was 16, compared to 18 days in July 2022. The previous 5-year average is 18 days.

View our HPI tool here to learn more: https://wrar.ca/hpi/

Click on any of the graphs below for an interactive view.

average sales price by municipality
average sales price by township
monthly sales by property type
monthly supply of homes for sale
monthly median sales price by property type
monthly average sales price by property type
monthly average days on market

WRAR cautions that average sale price information can help identify long-term trends but should not be to indicate that specific properties have increased or decreased in value. The average sale price is calculated based on the total dollar volume of all properties sold. Months Supply is the inventory of homes for sale at the end of a given month, divided by the average monthly closed sales from the last 12 months. Those requiring specific information on property values should contact a Waterloo Region REALTOR®. REALTORS® have their fingers on the pulse of the market. They know the questions to ask, the areas to probe and what to look for so that you get a complete picture of the property and community you’re considering.


Nicole’s 5 Buyer Tips for Buying a Home in Today’s Market!!!

Wednesday, March 29th, 2023

Looking to buy a home can be an exciting but overwhelming experience, especially if you’re a first-time homebuyer. With so many options available and factors to consider, it can be difficult to know where to start. That’s why I’ve put together a list of 5 essential tips for anyone looking to buy real estate in the current market. Whether you’re a seasoned buyer or just starting out, these tips will help you make informed decisions and find the perfect home for you. And to make things even easier, I’ve created a video to accompany this post, so you can follow along. So, without further ado, let’s dive into the top 5 buyer tips for real estate!


#1. Get pre-approved for a mortgage. 

This seems obvious, but you would be surprised how many people I meet for the first time who ask me to show them 5 homes that day, and when we get to the first home, I ask, so how much were you pre-approved for? and they say oh we haven’t gone to the bank yet 😲. In today’s competitive market, it’s essential to have a pre-approval in place before you start your property search. This will give you a clear idea of your budget and help you avoid wasting time (yours and mine) looking at properties outside your price range. It also gives you that competitive advantage of being ready to pull the trigger as soon as you find the property you love.

#2. Put your budget into a mortgage calculator. 

Just because you are pre-approved for a certain number, doesn’t mean you want to pay that much. There are tons of apps that you can find that will calculate your costs. You basically put in the purchase price, and your down payment amount, and it will calculate at today’s interest rate, how much your mortgage payments would be. You should also factor in property taxes, insurance and some utilities to get a good idea of how much your costs will be every month. You might find that you don’t want to spend as much as the bank is giving you. 

#3. Work with an experienced real estate agent.

A good real estate agent can be an invaluable asset in a competitive market. They can help you find properties that meet your criteria, so that you are not running around looking at homes that don’t have that walk-in closet or ensuite bathroom you want. They will negotiate on your behalf. And provide valuable insights on local market trends, like how to win an offer in today’s competitive market. 

#4. Be prepared to act quickly.

With low inventory and high demand, homes can sell quickly in today’s market. Be ready to make an offer as soon as you find a property that meets your needs. This may mean being flexible on closing dates, offering a higher deposit, or being willing to waive contingencies.

#5. Stay focused on your goals.

It’s easy to get caught up in the excitement of a hot real estate market, but it’s important to stay focused on your goals and priorities. Don’t let the fear of missing out (FOMO) drive your decision making. Stick to your budget, timeline, and must haves to ensure you make a sound investment that meets your needs in the long term. 

For more information feel free to connect with me at 519-591-7413 or nicole@therizteam.com

Nicole Shantz – Sales Representative | The Riz Team – Real Estate Professionals | Royal LePage Wolle Realty, Brokerage

Remember….Don’t put it on HOLD…call The Riz Team to get it SOLD!!!™

Kitchener Waterloo Market Snapshot October 2022

Wednesday, October 5th, 2022

Fewer Home Sales in October


“Unsurprisingly, the pace of home sales continued to slow in October after the Bank of Canada’s sixth straight interest rate hike in September,” says Megan Bell, President of WRAR. “Faced with higher borrowing costs, some buyers have had to re-assess what they can afford. As these buyers get moved to the sidelines, sellers question if now is the best possible time to sell.”


If you are considering to Sell your home or Buy a home in the next short while it would be highly beneficial for you to connect with one of our Team Agents at

The Riz Team

Do you want to know what your home is worth today? Click Below for our Online No Obligation Market EvaluationClick Here


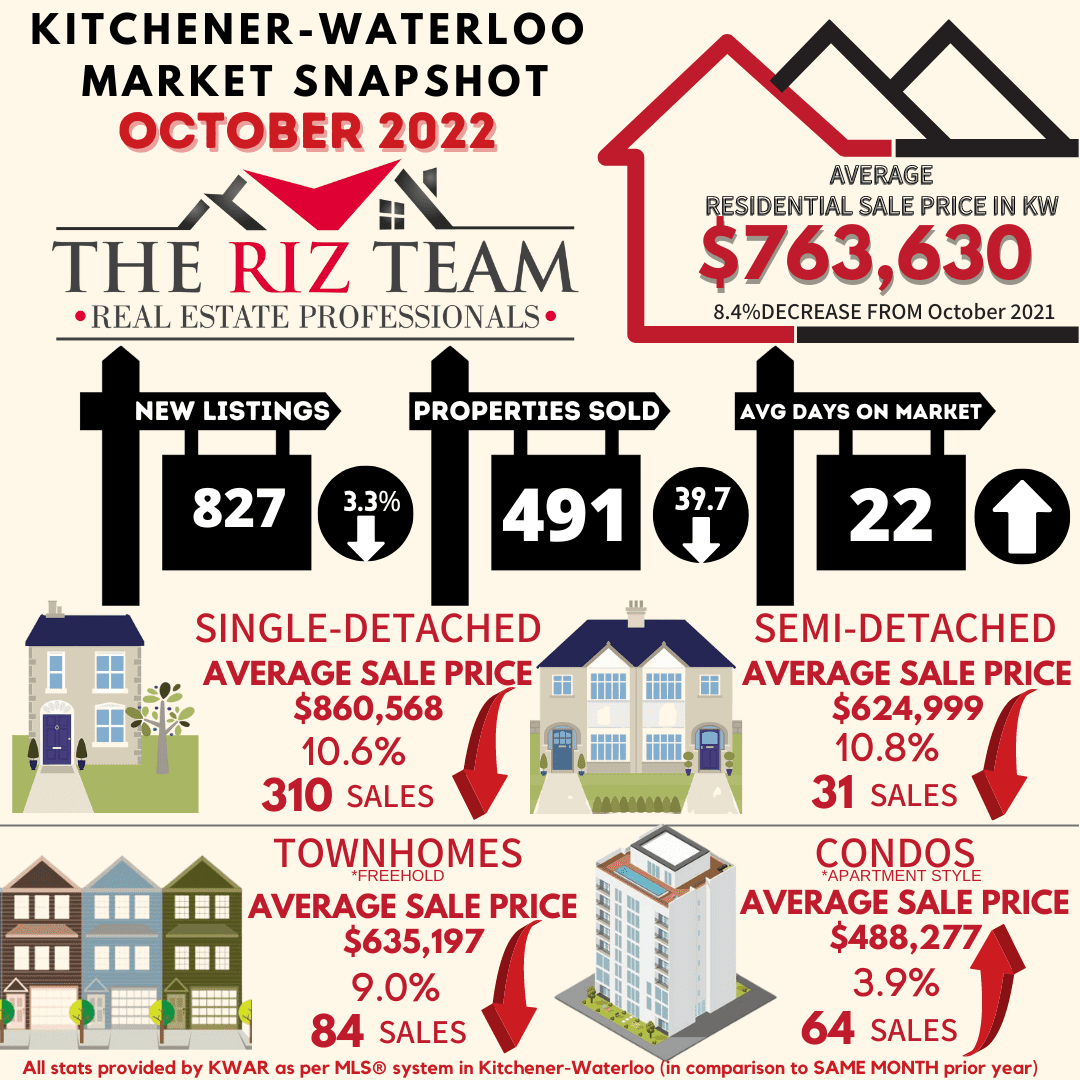
WATERLOO REGION, ON (November 2, 2022) —491 residential homes were sold last month through the Multiple Listing Service® (MLS®) System of the Waterloo Region Association of REALTORS® (WRAR), a decrease of 39.7 per cent compared to October 2021 and 36.2 per cent below the previous 5-year average for the month.

Total residential sales in October included 310 detached (down 38.2 per cent from October 2021), and 84 townhouses (down 45.1 per cent). Sales also included 64 condominium units (down 36.0 per cent) and 31 semi-detached homes (down 47.5 per cent).

“Unsurprisingly, the pace of home sales continued to slow in October after the Bank of Canada’s sixth straight interest rate hike in September,” says Megan Bell, President of WRAR. “Faced with higher borrowing costs, some buyers have had to re-assess what they can afford. As these buyers get moved to the sidelines, sellers question if now is the best possible time to sell.”

In October, the average sale price for all residential properties in Waterloo Region was $763,630. This represents an 8.4 per cent decrease compared to October 2021 and a 1.6 per cent increase compared to September 2022.

  • The average price of a detached home was $860,568. This represents a 10.6 per cent decrease from October 2021 and a decrease of 0.3 per cent compared to September 2022.
  • The average sale price for a townhouse was $635,197. This represents a 9.0 per cent decrease from October 2021 and a decrease of 0.4 per cent compared to September 2022.
  • The average sale price for an apartment-style condominium was $488,277. This represents an increase of 3.9 per cent from October 2021 and an increase of 7.3 per cent compared to September 2022.
  • The average sale price for a semi was $624,999. This represents a decrease of 10.8 per cent compared to October 2021 and a decrease of 1.9 per cent compared to September 2022.
october 2022 average sales price by property type 2

WRAR cautions that average sale price information can be useful in establishing long-term trends but should not be used as an indicator that specific properties have increased or decreased in value. The MLS® Home Price Index (HPI) provides the best way to gauge price trends because averages are strongly distorted by changes in the mix of sales activity from one month to the next.

MLS® Home Price Index Benchmark Price

Kitchener-Waterloo Cambridge
Benchmark Type: October 2022 Monthly % Change Yr./Yr. % Change October 2022 Monthly % Change Yr./Yr. % Change
Composite $723,200 -0.2 -8.8 $730,700 -2.3 -9.8
Detached $807,900 -0.0 -10.1 $751,800 -2.1 -11.6
Townhouse $603,700 -1.3 -3.2 $663,100 -2.4 1.8
Apartment $494,400 -0.1 6.5 $520,100 -6.6 7.3


October 2022 HPI Stats Chart for Kitchener Waterloo Cambridge

“While there is uncertainty in the minds of consumers about current market conditions, one thing is for certain, Waterloo region’s housing supply remains one of the tightest in the country,” says Bell.  “Buyers may be on the sidelines for now due to affordability, but the underlying demand for housing remains strong.”

There were 827 new listings added to the MLS® System in the Waterloo Region last month, a decrease of 3.3 per cent compared to October of last year and a 14.3 per cent decrease compared to the previous ten-year average for October.

The total number of homes available for sale in active status at the end of October was 928, an increase of 134.9 per cent compared to October of last year and 34.9 per cent below the previous ten-year average of 1425 listings for October.

The number of months of inventory is up 160.0 per cent compared to October of last year, but still historically low at 1.3 months. Between 2009 and 2015, October’s average months of inventory was 3.6 months. The number of months of inventory represents how long it would take to sell off current inventories at the current sales rate.

The average number of days to sell in October was 22, compared to 10 days in October 2021. The previous 5-year average is 19 days.

Those requiring specific information on property values should contact a local REALTOR®.  Working with a Realtor is the best way to get a complete picture of the housing market, your particular property and the community you are considering.

View our HPI tool here to learn more: https://wrar.ca/hpi/

Click on any of the graphs below for an interactive view.

October-2022-average-sale-price-by-municipality
October 2022 average sale price by township
October 2022 sales by property type
October 2022 Months Supply
October 2022 median sales price by property type
October 2022 average sale price by property type
October 2022 average days on market

Kitchener Waterloo Market Snapshot August 2022

Wednesday, September 7th, 2022

Rising Borrowing Costs Continue to Tame Home Sales in August


“The decline was most pronounced in the apartment-style condo and townhouse categories which could indicate that rising borrowing costs are having a greater impact on first-time buyers and those looking for more affordable options.”   

If you are considering to Sell your home or Buy a home in the next short while it would be highly beneficial for you to connect with one of our Team Agents at

The Riz Team

Do you want to know what your home is worth today? Click Below for our Online No Obligation Market EvaluationClick Here

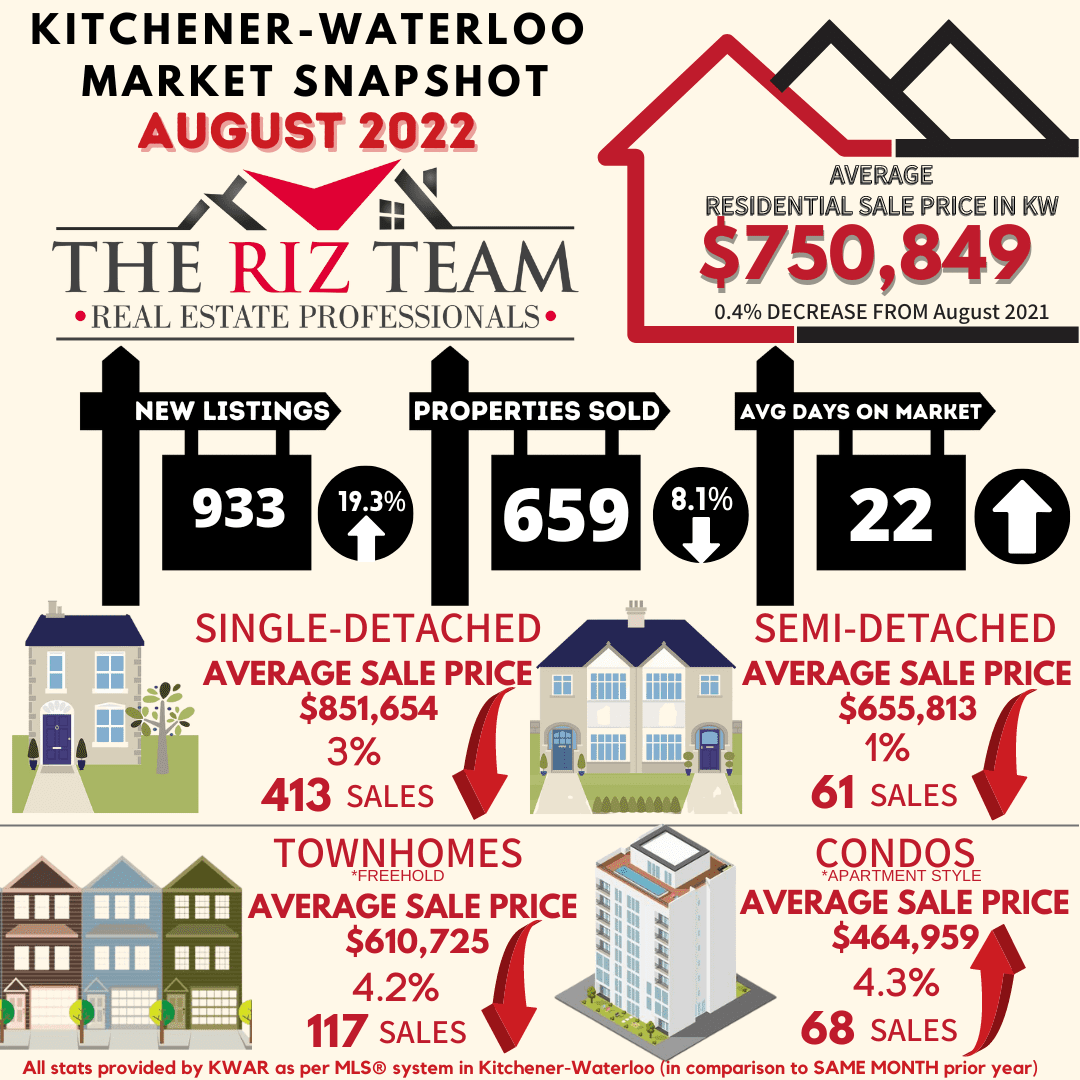
WATERLOO REGION, ON (September 7, 2022) — 659 residential homes were sold last month through the Multiple Listing Service® (MLS®) System of the Waterloo Region Association of REALTORS® (WRAR) in August, a decrease of 8.1 per cent compared to August 2021 and 11.2 per cent below the previous 5-year average for the month.

Total residential sales in August included 413 detached (down 0.7 per cent from August 2021), and 117 townhouses (down 24.0 per cent). Sales also included 68 condominium units (down 26.1 per cent) and 61 semi-detached homes (up 10.9 per cent).

“While the number of homes sold in August was down on a year-over-year basis they were up almost 19 per cent compared to July,” says Megan Bell, president of WRAR. “The decline was most pronounced in the apartment-style condo and townhouse categories which could indicate that rising borrowing costs are having a greater impact on first-time buyers and those looking for more affordable options.”

In August, the average sale price for all residential properties in Waterloo Region was $750,849. This represents a 0.4 per cent decrease compared to August 2021 and a 0.2 per cent decrease compared to July 2022.

  • The average price of a detached home was $851,654. This represents a 3.0 per cent decrease from August 2021 and an increase of 1.1 per cent compared to July 2022.
  • The average sale price for a townhouse was $610,725. This represents a 4.2 per cent decrease from August 2021 and a decrease of 5.2 per cent compared to July 2022.
  • The average sale price for an apartment-style condominium was $464,959. This represents an increase of 4.3 per cent from August 2021 and a decrease of 10.9 per cent compared to July 2022.
  • The average sale price for a semi was $655,813. This represents a decrease of 1.0 per cent compared to August 2021 and a decrease of 0.8 per cent compared to July 2022.

WRAR cautions that average sale price information can be useful in establishing long-term trends but should not be used as an indicator that specific properties have increased or decreased in value. The MLS® Home Price Index (HPI) provides the best way to gauge price trends because averages are strongly distorted by changes in the mix of sales activity from one month to the next.

MLS® Home Price Index Benchmark Price 
  Kitchener-Waterloo  Cambridge 
Benchmark Type:  August 2022  Monthly % Change  Yr./Yr. % Change  August 2022  Monthly % Change  Yr./Yr. % Change 
Composite  $734,500  -1.9  -2.2  $750,700  -3.4  0.6 
Detached  $815,000  -1.5  -3.9  $764,700  -3.1  -1.3 
Townhouse  $618,400  -3.8  5.4  $715,200  -5.9  11.7 
Apartment  $513,600  -2.1  16.1  $578,500  -1.1  19.0 


“Today’s announcement by the Bank of Canada to increase its policy rate by 75 basis points to 3.25 per cent is discouraging news for borrowers as it affects their purchasing power,” says Bell. “However, we see signs that the market is moving towards more buyer-friendly conditions. REALTORS® are reporting fewer multiple offers resulting in final sale prices being closer to the asking price or with more conditions accompanying offers. Even so, with inventory still very tight, Waterloo region remains a seller’s market.”

There were 933 new listings added to the MLS® System in the Waterloo Region last month, an increase of 19.3 per cent compared to August of last year, and a 1.2 per cent increase compared to the previous ten-year average for August.

The total number of homes available for sale in active status at the end of August was 1,003, an increase of 188.2 per cent compared to August of last year, and 31.8 per cent below the previous ten-year average of 1593 listings for August.

The number of months of inventory is up 250 per cent compared to August of last year, but still historically low. There were 1.4 months of inventory in August 2022, down from 1.8 months in July 2022. The number of months of inventory represents how long it would take to sell off current inventories at the current sales rate.

The average number of days to sell in August was 22, compared to 12 days in August 2021. The previous 5-year average is 22 days.

Those requiring specific information on property values should contact a local REALTOR®.  Working with a Realtor is the best way to get a complete picture of the property and community you are considering.

View our HPI tool here to learn more: https://wrar.ca/hpi/

Click on any of the graphs below for an interactive view.

Kitchener Waterloo Market Snapshot June 2022

Wednesday, July 6th, 2022

HOME PRICES CONTINUE TO DIP AS MONTHS SUPPLY RETURNS TO PRE-PANDEMIC LEVEL

If you are considering to Sell your home or Buy a home in the next short while it would be highly beneficial for you to connect with one of our Team Agents at

The Riz Team

Do you want to know what your home is worth today? Click Below for our Online No Obligation Market Evaluation

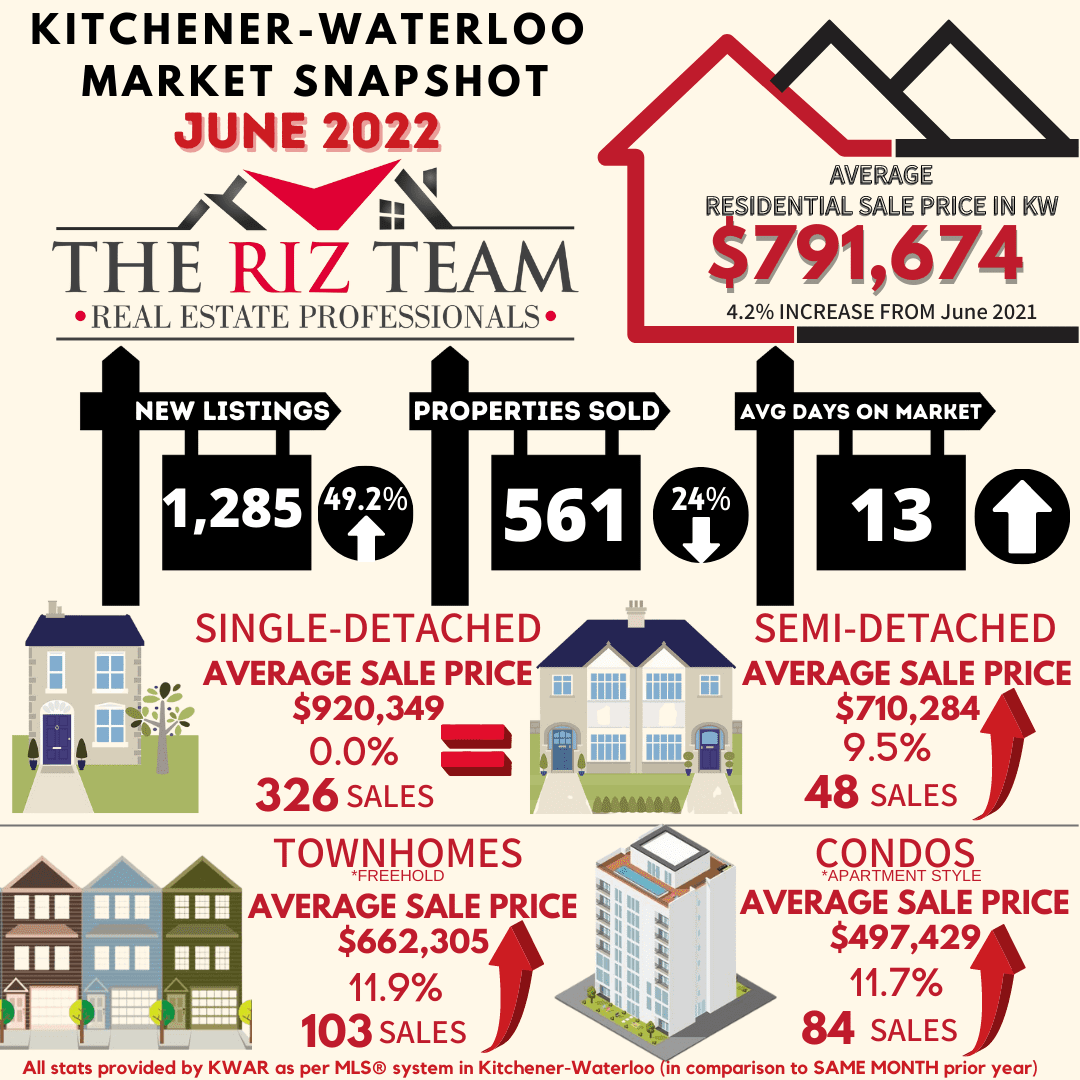
The Riz Team monthly market stats June 2022. Kitchener Waterloo, ON.


There were 561 residential homes sold through the Multiple Listing Service® System (MLS® System) of the Kitchener-Waterloo Association of REALTORS® (KWAR) in June, a decrease of 24.0 per cent compared to the same month last year, and 17.3 per cent below the previous 5-year average. “For the fourth consecutive month we’re seeing home prices moderate as the number of properties available for sale has steadily increased” says Megan Bell, President of KWAR. “In June the average price of a detached home has levelled off to where it was this time last year.”

Total residential sales in June included 326 detached (down 20.7 per cent from June 2021), and 103 townhouses (down 32.2 per cent). Sales also included 84 condominium units (down 18.4 per cent) and 48 semi-detached homes (down 33.3 per cent).

In June, the average sale price for all residential properties in the Kitchener-Waterloo area was $791,674. This represents a 4.2 per cent increase over June 2021 and a 9.6 per cent decrease compared to May 2022.


  • The average price of a detached home was $920,349. This represents a 0.0 per cent change from June 2021 and a decrease 9.5 per cent compared to May 2022.
  • The average sale price for a townhouse was $662,305. This represents a 11.9 per cent increase from June 2021 and a decrease of 6.5 per cent compared to May 2022.
  • The average sale price for an apartment-style condominium was $497,429. This represents an increase of 11.7 per cent from June 2021 and a decrease of 8.9 per cent compared to May 2022.
  • The average sale price for a semi was $710,284. This represents an increase of 9.5 per cent compared to June 2021 and a decrease of 2.8 per cent compared to May 2022.

KWAR cautions that average sale price information can be useful in establishing long-term trends but should not be used as an indicator that specific properties have increased or decreased in value. The MLS® Home Price Index (HPI) provides the best way to gauge price trends because averages are strongly distorted by changes in the mix of sales activity from one month to the next.

The MLS® HPI composite benchmark price for all residential properties in Kitchener-Waterloo was $790,600 in June. This represents a 6.8 per cent increase over June 2021 and a 6.8 per cent decrease compared to May 2022.

  • The benchmark price for a detached home was $876,600. This represents a 5.3 per cent increase from June 2021 and 7.3 per cent decrease compared to May 2022.
  • The benchmark price for a townhouse is $676,900. This represents a 15.8 per cent increase from June 2021 and a 7.1 per cent decrease compared to May 2022.
  • The benchmark price for an apartment-style condominium was $537,100. This represents a 24.2 per cent increase from June 2021 and a 2.4 per cent decrease compared to May 2022.

“This time last year, sales were going through the roof,” says Bell. “The home buying scene is a little different this year with folks finally taking their postponed trips, attending weddings, and generally catching up on the many missed occasions of the past two years.” Of course, recent hikes in mortgage rates are also contributing to sales cooling, notes KWAR’s president.

“While any shift in the market will result in some individuals predicting the worse, the simple reality is that the market we had been in was unsustainable,” says Bell. “What this means for buyers is more inventory, more choices, and perhaps most importantly, potentially less stress when purchasing. For sellers, they need to ensure their properties stand out from the competition and be aware it may take more time to sell their home and for potentially less money than they were expecting.”

There were 1,285 new listings added to the MLS® System in KW and area last month, an increase of 49.2 per cent compared to June of last year, and a 41.7 per cent increase compared to the previous ten-year average for June.

The total number of homes available for sale in active status at the end of June was 991, an increase of 165.0 per cent compared to June of last year, and 20.6 per cent below the previous ten-year average of 1249 listings for June.

The number of months of inventory increased to 1.8 months in June from 1.6 months in May. While inventory is still at historic lows, this is the highest it’s been since September 2019 and a return to where inventory was in the pre-pandemic June of 2019. The number of months of inventory represents how long it would take to sell off current inventories at the current rate of sales.

The average number of days to sell in June was 13 days, compared to 11 days in June 2021. The previous 5-year average is 17 days.

Those requiring specific information on property values should contact a local REALTOR®.  Working with a Realtor is the best way to get a complete picture of the property and community you are considering.

View our HPI tool here to learn more: https://kwar.ca/hpi-dashboard


Historical Sales By Property Type

Months Supply of Homes for Sale


Historical Median Sales Price – By Property Type


Historical Average Sales Price – By Property Type

Average Days on Market

KWAR cautions that average sale price information can be useful in establishing long term trends but should not be used as an indicator that specific properties have increased or decreased in value. The average sale price is calculated based on the total dollar volume of all properties sold. Months Supply is the inventory of homes for sale at the end of a given month, divided by the average monthly closed sales from the last 12 months Those requiring specific information on property values should contact a local REALTOR®. REALTORS® have their fingers on the pulse of the market. They know the questions to ask, the areas to probe and what to look for so that you get a complete picture of the property and community you’re considering.

Kitchener-Waterloo Market Snapshot October 2021

Wednesday, November 3rd, 2021

PRICES CONTINUE TO INCREASE WITH STRONG HOME SALES IN OCTOBER

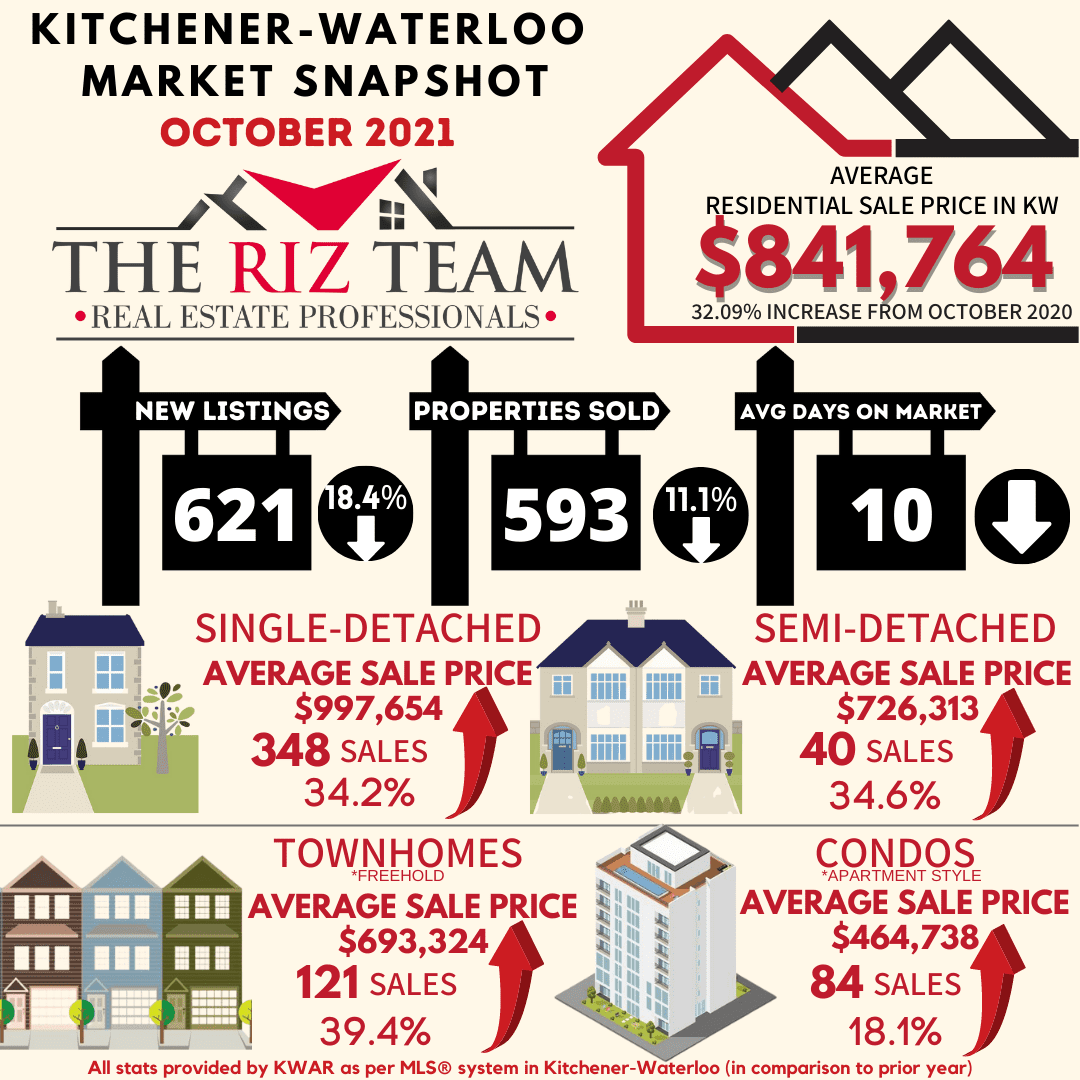
KITCHENER-WATERLOO, ON (November 3, 2021) –– A total of 593 residential homes sold last month through the Multiple Listing Service® (MLS® System) of the Kitchener-Waterloo Association of REALTORS® (KWAR), a decrease of 11.1 per cent compared to last October and a decrease of 16.5 per cent compared to September.

“While not as red-hot as last year’s record-breaking October, it was still a higher-than-normal number of home sales for the month, and the second-highest October on record,” says KWAR’s president, Nicole Pohl. “The number of listings coming on the market can scarcely keep up with the demand for homes in Waterloo region, and the continued price growth we see in October reflects this.”

Total residential sales in October included 348 detached (down 13.2 per cent from October 2020), and 84 condominium units (down 8.7 per cent). Sales also included 40 semi-detached homes (down 9.1) and 121 townhouses (down 6.9 per cent).

In October, the average sale price for all residential properties in the Kitchener-Waterloo area was $841,764. This represents a 32.9 per cent increase over October 2020 and a 6.1 per cent increase compared to September 2021.

  • The average price of a detached home was $997,654. This represents a 34.2 per cent increase from October 2020 and an increase of 3.5 per cent compared to September 2021.
  • The average sale price for an apartment-style condominium was $464,738. This represents an increase of 18.1 per cent from October 2020 and a decrease of 7.1 per cent compared to September 2021.
  • The average sale price for a townhouse was $693,324. This represents a 39.4 per cent increase from October 2020 and an increase of 7.3 per cent compared to September 2021.
  • The average sale price for a semi was $726,313. This represents an increase of 34.6 per cent compared to October 2020 and an increase of 5.6 per cent compared to September 2021.

KWAR cautions that average sale price information can be useful in establishing long-term trends but should not be used as an indicator that specific properties have increased or decreased in value. The MLS® Home Price Index (HPI) provides the best way to gauge price trends because averages are strongly distorted by changes in the mix of sales activity from one month to the next.

The MLS® HPI composite benchmark price for all residential properties in Kitchener-Waterloo was $803,900 in October. This represents a 34.3 per cent increase over October 2020 and a 2.5 per cent increase compared to September 2021.

  • The benchmark price for a detached home was $887,500. This represents a 35.5 per cent increase from October 2020 and 2.1 per cent increase compared to September 2021.
  • The benchmark price for an apartment-style condominium was $406,400. This represents a 22.7 per cent increase from October 2020 and a 3.5 per cent increase compared to September 2021.
  •  The benchmark price for a townhouse is $603,900. This represents a 42.5 per cent increase from October 2020 and a 3.8 per cent increase compared to September 2021.

“With ongoing constraints on supply versus demand, home prices continued to accelerate in October,” says Pohl.

There were 621 new listings added to the MLS® System in KW and area last month, a decrease of 18.4 per cent compared to October of last year, and a 12.1 per cent decrease compared to the previous ten-year average for October.

The total number of homes available for sale in active status at the end of October was 288, a decrease of 36 per cent compared to October of last year, and 76.5 per cent below the previous ten-year average of 1,285 listings for October.

The number of months of inventory remained at 0.5 in October. Inventory has settled at under 1 month for twelve consecutive months. The number of months of inventory represents how long it would take to sell off current inventories at the current rate of sales.

The average number of days to sell in October was 10 days, compared to 13 days in October 2020 and a previous 5-year average of 22 days.

“Affordability throughout Waterloo Region continues to be challenged, creating significant barriers especially for many people who are just trying to get their foot in the door of the housing market,” says Pohl. “We are urging all levels of government to work together to tackle the supply issue facing housing markets across the country and right here in Waterloo region.”

Over the past two weeks representatives of KWAR, alongside REALTORS® from across Canada have been meeting with Members of Parliament to talk about Canada’s economic recovery plan and the need to prioritize housing. You can read about the ideas that REALTORS® are proposing here:  https://www.crea.ca/mp

Those requiring specific information on property values should contact a local REALTOR®.  Working with a Realtor is the best way to get a complete picture of the property and community you are considering.

View our HPI tool here to learn more: https://kwar.ca/hpi-dashboard

Historical Sales By Property Type

Months Supply of Homes for Sale

Historical Median Sales Price – By Property Type

Historical Average Sales Price – By Property Type

Average Days on Market Chart

KWAR cautions that average sale price information can be useful in establishing long term trends but should not be used as an indicator that specific properties have increased or decreased in value. The average sale price is calculated based on the total dollar volume of all properties sold. Months Supply is the inventory of homes for sale at the end of a given month, divided by the average monthly closed sales from the last 12 months Those requiring specific information on property values should contact a local REALTOR®. REALTORS® have their fingers on the pulse of the market. They know the questions to ask, the areas to probe and what to look for so that you get a complete picture of the property and community you’re considering.

Kitchener-Waterloo Market Snapshot July 2021

Thursday, August 5th, 2021


VERY LOW INVENTORY COMBINED WITH STRONG DEMAND KEEPS HOME PRICES HUMMING IN JULY

“Although home sales slowed down to some degree in July compared to June, overall demand remains very strong,” says Nicole Pohl, President of KWAR. “The current inventory of homes available for sale in the Kitchener-Waterloo and area is extremely low, making Waterloo Region one of the most competitive markets in Ontario.”

Total residential sales in July included 339 detached (down 27.1 per cent from July 2020), and 91 condominium units (up 30 per cent). Sales also included 46 semi-detached homes (down 4.2) and 135 townhouses (down 11.8 per cent).

In July, the average sale price for all residential properties in the Kitchener-Waterloo area was $755,681. This represents a 18.2 per cent increase over July 2020 and a 0.6 per cent decrease compared to June 2021.

      • The average price of a detached home was $907,192. This represents a 21.9 per cent increase from July 2020 and a decrease of 1.4 per cent compared to June 2021.
      • The average sale price for an apartment-style condominium was $429,630. This represents an increase of 6.7 per cent from July 2020 and a decrease of 3.6 per cent compared to June 2021.
      • The average sale price for a townhouse was $623,732. This represents a 33.8 per cent increase from July 2020 and an increase of 5.4 per cent compared to June 2021.
      • The average sale price for a semi was $667,570. This represents an increase of 28.6 per cent compared to July 2020 and an increase of 2.9 per cent compared to June 2021.

KWAR cautions that average sale price information can be useful in establishing long-term trends but should not be used as an indicator that specific properties have increased or decreased in value. The MLS® Home Price Index (HPI) provides the best way to gauge price trends because averages are strongly distorted by changes in the mix of sales activity from one month to the next.

The MLS® HPI composite benchmark price for all residential properties in Kitchener-Waterloo was $748,700 in July. This represents a 30.5 per cent increase over July 2020 and a 0.4 per cent increase compared to June 2021.

  • The benchmark price for a detached home was $822,300. This represents a 31.1 per cent increase from July 2020 and 0.2 per cent increase compared to June 2021.
  • The benchmark price for an apartment-style condominium was $385,900. This represents a 19.5 per cent increase from July 2020 and a 3.3 per cent increase compared to June 2021.
  • The benchmark price for a townhouse is $564,500. This represents a 40 per cent increase from July 2020 and a 0.4 per cent decrease compared to June 2021.

“The housing market took a bit of a breather last month,” notes Pohl. “July is typically a quieter month with families taking vacation, and with the region coming out of lockdown there were certainly more staycations happening.  But we do anticipate the market will pick up steam again and it will be another busy fall.”

There were 675 new listings added to the MLS® System in KW and area last month, a decrease of 24 per cent compared to July of last year, and a 14.4 per cent decrease compared to the previous ten-year average for July.

The total number of homes available for sale in active status at the end of July was 281, a decrease of 52.7 per cent compared to July of last year, and 79.1 per cent below the previous ten-year average of 1,346 listings for July.

The number of months of inventory was 0.4 in July, a decline from 0.5 months in June. Inventory has numbered less than 1 month since October. The number of months of inventory represents how long it would take to sell off current inventories at the current rate of sales.

The average number of days to sell in July was 11 days, compared to 17 days in July 2020 and a previous 5-year average of 22 days.

Those requiring specific information on property values should contact a local REALTOR®.  Working with a Realtor is the best way to get a complete picture of the property and community you are considering.

View our HPI tool here to learn more: https://kwar.ca/hpi-dashboard

Historical Sales By Property Type

Months Supply of Homes for Sale

Historical Median Sales Price – By Property Type

Historical Average Sales Price – By Property Type

Average Days on Market

KWAR cautions that average sale price information can be useful in establishing long-term trends but should not be used as an indicator that specific properties have increased or decreased in value. The average sale price is calculated based on the total dollar volume of all properties sold. Months Supply is the inventory of homes for sale at the end of a given month, divided by the average monthly closed sales from the last 12 months Those requiring specific information on property values should contact a local REALTOR®. REALTORS® have their fingers on the pulse of the market. They know the questions to ask, the areas to probe and what to look for so that you get a complete picture of the property and community you’re considering.
EASY LANDSCAPING D.I.Y PROJECTS

Monday, August 12th, 2019

Ever get the itch to do a DIY project? Whenever we do, our favorites involve getting outdoors and mixing up our landscaping features.

*READ MORE BELOW

Whether it’s as simple as installing some lighting or a little more time-consuming like re-plotting plants, a fresh look for the lawn always gives your home a fresh look as well. Here are our top five easy landscaping projects!

Create a pathway.

To guide you and visitors throughout your yard and link different areas together, install a pathway. You can use materials from a variety of materials, including reclaimed pallet wood, flagstones, gravel, and more to add texture and color.

Add a wall or border.

Installing a flagstone, rock, or brick wall around flower beds or trees adds a sleek, clean look to your landscaping and helps separate different sections of your yard.

Install a water feature.

Nothing says zen quite like the sound of trickling water as you relax in your backyard. You can start simple with by purchasing and installing a small feature powered by a solar panel or create a larger focal point in your yard by installing a waterfall wall or small pond.

Light your way.

An easy way to transform your yard is to strategically use lighting. Place cool-colored lights high in trees to recreate a moonlight feel, use pathway lights to naturally guide the eye, or highlight objects or plants.

Plant upwards.

Expand your yard space by drawing the eye to the sky with a trellis fence or screen made of wood or metal. Once you install your trellis, select your climbing plants and vines and get to planting!

☎️ Don’t put it on HOLD…Call The Riz Team to get it SOLD!!!™
519.RIZ.SOLD | riz@therizteam.com | www.therizteam.com

Five Hot Trends in Hardwood Flooring

Monday, April 1st, 2019


(NewsUSA) – More than ever, homeowners are appreciating the added value – aesthetic and monetary – that hardwood floors bring to a home.”They also offer what can be an overwhelming variety of possibilities and choices,” says Linda Jovanovich of the American Hardwood Information Center, www.hardwoodinfo.com. “Here’s a look at five top flooring trends that will help if you can’t see the wood for the trees.” Made in America “There’s a growing demand for American-produced hardwoods,” says Michael Martin, President and CEO of the National Wood Flooring Association.”It’s part of the general trend toward locally-sourced materials of all kinds in the U.S.”Consumer concerns about sustainability, quality, safety, and environmental factors are more easily addressed when a hardwood is domestically grown and milled. Plus, the U.S. offers an unrivaled range of readily available species suitable for flooring. Stains and Finishes Gray is a classic “neutral” that’s never truly out of fashion. It’s currently one of the most popular colors, ranging from pale smoke to deep charcoal, showing up on hardwood flooring.”Whether light or dark, gray stains bring out any wood’s natural grain and texture,” says New York interior designer Laura Bohn. “Grays are versatile and timeless – quiet and soothing colors that recede into the background without losing personality or becoming faceless. They work in any style décor, yet always look modern.” SpeciesFor several years, the trend was toward characterful woods like hickory, but recently, white oak has moved to the front. Along with abundance, durability, and reasonable cost, white oak offers aesthetic advantages.”It can be stained light, dark, or somewhere in between,” says interior designer Emily Morrow Finkell, CEO of Emily Morrow Home. “Many of the popular gray-brown shades look especially sophisticated applied to white oak. Consumers see and love it in magazines and websites, making it a perfect ‘attainable home upgrade.’” The Wider, The Better “It’s all about wide, wider, widest!” says NWFA’s Michael Martin. “Planks of up to 7 inches in width are considered normal now. Traditional strip flooring still remains popular, but wide-plank is the market leader.”As Melissa Morgan of M Interiors in San Antonio says, “Wider floorboards can make a space look larger and more modern. The floor can be treated like a canvas: ebonized for a sleek, dark look; light-stained for an urban vibe; distressed for a rustic affect – the possibilities are endless.” Popular Patterns “One way to set your home interior apart is by tapping into the trend for herringbone-and- chevron-pattern hardwood floors, which show up increasingly in decorating magazines,” says Morrow Finkell. But as Michael Martin points out, “Since installing herringbone floors is a time-and labor-intensive process, they’re more common in high-end projects than in the average middle-class home.” Still, if you can afford to splurge, these floors are a gorgeous addition to any room.Visit www.hardwoodinfo.com for more about residential design trends and other applications and products using American hardwoods.


© Copyright 2017, Real Estate Websites by Redman Technologies Inc. | Privacy Policy | Disclaimer | Sitemap

MLS®, REALTOR®, and the associated logos are trademarks of The Canadian Real Estate Association.

The data included on this website is deemed to be reliable, but is not guaranteed to be accurate by the Kitchener-Waterloo Real Estate Board. The trademarks REALTOR®, REALTORS® and the REALTOR® logo are controlled by The Canadian Real Estate Association (CREA) and identify real estate professionals who are members of CREA. Used under license.