Kitchener Waterloo Market Snapshot September 2024
Thursday, October 3rd, 2024Waterloo Region Sees Decrease in Home Sales for September
In September, a total of 521 homes were sold in the Waterloo Region via the Multiple Listing Service® (MLS®) System of the Cornerstone Association of REALTORS® (Cornerstone). This represents a decrease of 2.1 per cent compared to the same period last year and a decline of 23.5 per cent compared to the average number of homes sold in the previous ten years for the same month.
“In September, there was an overall slowdown in home sales, but we continued to see strong demand for detached homes, resulting in an increase in sales for that specific type of property,” said Christal Moura, spokesperson for the Waterloo Region market area. “Meanwhile, buyers have a bit more selection than a year ago as inventory is up, and homes take a little longer to sell. This can mean a less stressful homebuying experience, but for sellers, the current market may require more patience or even adjustment in price expectation.”
If you are considering to Sell your home or Buy a home in the next short while it would be highly beneficial for you to connect with one of our Team Agents at
The Riz Team
Do you want to know what your home is worth today? Click Below for our Online No Obligation Market Evaluation
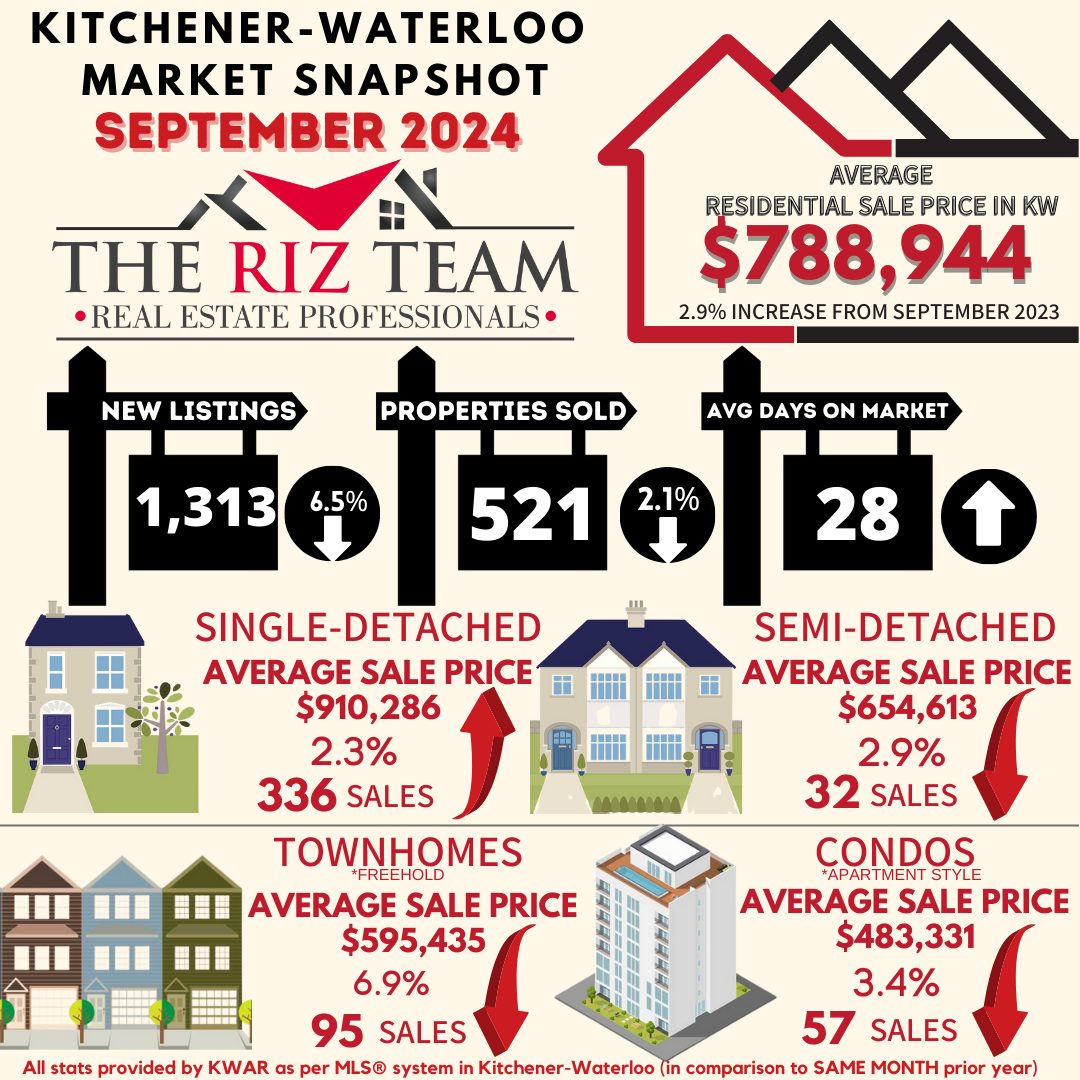
Total residential sales in September included 336 detached homes (up 9.4 per cent from September 2023), and 95 townhouses (down 22.1 per cent). Sales also included 57 condominium units (down 16.2 per cent) and 32 semi-detached homes (down 3.0 per cent).
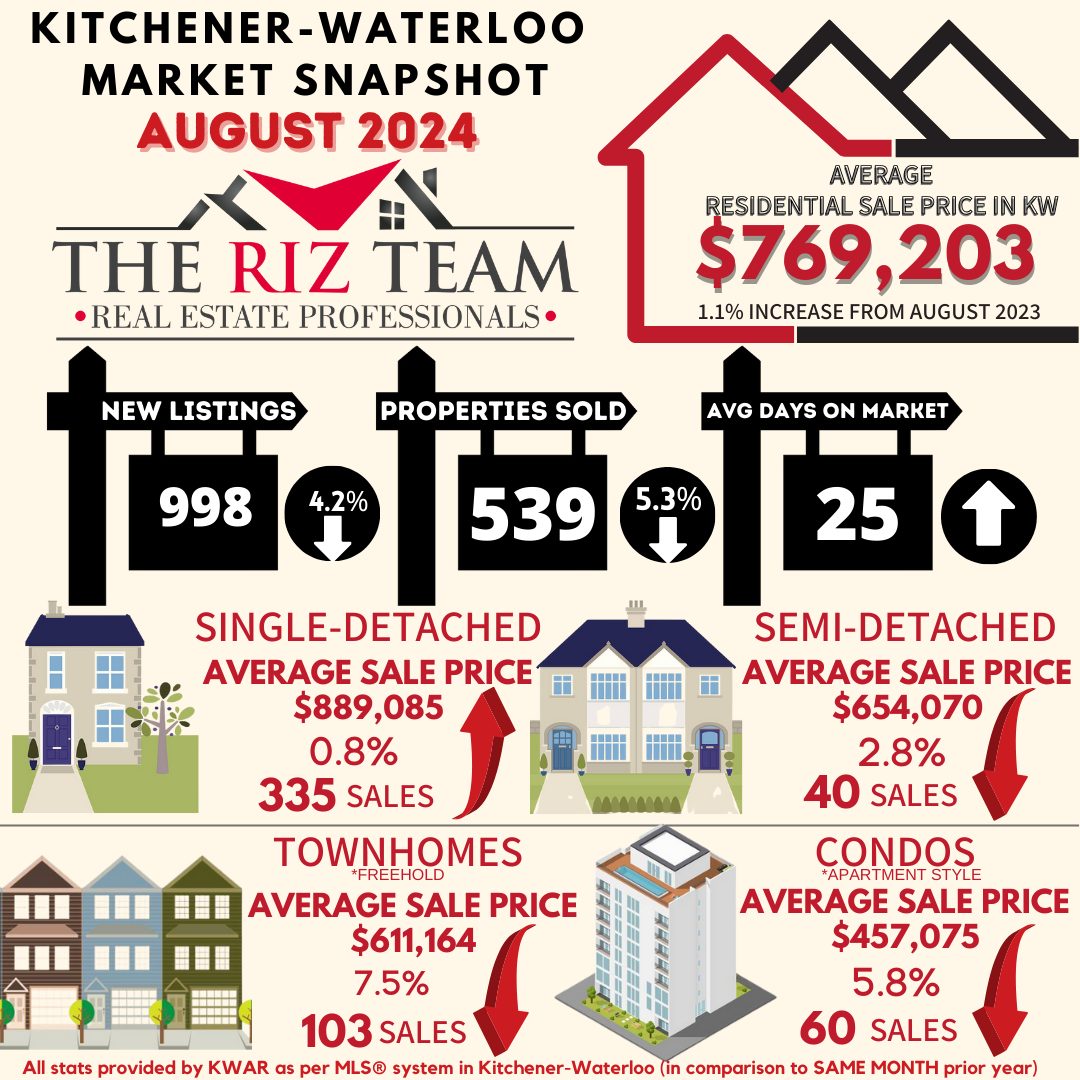
In September, the average sale price for all residential properties in Waterloo Region was $788,944. This represents a 2.9 per cent increase compared to September 2023 and a 2.3 per cent increase compared to August 2024.
- The average price of a detached home was $910,286. This represents a 2.3 per cent increase from September 2023 and an increase of 2.2 per cent compared to August 2024.
- The average sale price for a townhouse was $595,435. This represents a 6.9 per cent decrease from September 2023 and a decrease of 2.7 per cent compared to August 2024.
- The average sale price for an apartment-style condominium was $483,331. This represents a decrease of 3.4 per cent from September 2023 and an increase of 4.9 per cent compared to August 2024.
- The average sale price for a semi was $654,613. This represents a decrease of 2.9 per cent compared to September 2023 and an increase of 0.1 per cent compared to August 2024.

MLS® Home Price Index Benchmark Price |
||||||
| Kitchener-Waterloo | Cambridge | |||||
| Benchmark Type: | September 2024 | Monthly % Change | Yr./Yr. % Change | September 2024 | Monthly % Change | Yr./Yr. % Change |
| Composite | $728,700 | 0.2 | -1.8 | $741,800 | -0.1 | 0.0 |
| Single Family | $844,400 | 0.6 | 0.3 | $777,500 | 0.2 | 1.3 |
| Townhouse | $602,800 | -0.7 | -5.5 | $641,700 | -1.7 | -4.8 |
| Apartment | $435,700 | -1.3 | -8.3 | $481,500 | -0.2 | -4.2 |

In September, Cornerstone welcomed policy changes from the federal government. These changes include extending mortgage terms to 30 years for first-time homebuyers and all buyers of new builds and raising the CMHC insurance cap from $1 million to $1.5 million. These changes will come into effect later this year. Combined with anticipated further interest rate cuts, these adjustments could enable more buyers to purchase their first home.
There were 1,313 new listings added to the MLS® System in Waterloo Region last month, a decrease of 6.5 per cent compared to September last year and a 20.0 per cent increase compared to the previous ten-year average for September.
The total number of homes available for sale in active status at the end of September was 1,751 an increase of 21.3 per cent compared to September of last year and 42.2 per cent above the previous ten-year average of 1,232 listings for September.
The total inventory across the market increased by 23.1 percent, resulting in a 3.2-month supply of all property types by the end of September. Condominium apartments had the highest inventory, with 5.5 months’ supply, followed by townhouses with 3.6 months’ supply and detached homes with 2.7 months’ supply. The number of months of inventory represents the time it would take to sell off current inventories at the current sales rate.
The average time it took to sell a home in September was 28 days, which is three days longer than the previous month. In September 2023, it took 19 days for a home to sell, and the five-year average is 18 days.
Cornerstone emphasizes the importance of consulting a local REALTOR® when considering buying or selling property in the Waterloo Region. Their expertise can provide valuable insights into the current market conditions, enabling individuals to make well-informed decisions aligned with their goals and preferences.
Average Sales Price – Municipality

Average Sales Price – Township

Monthly Sales By Property Type


Cornerstone Association of REALTORS® cautions that average sale price information can help identify long-term trends but should not be to indicate that specific properties have increased or decreased in value. The average sale price is calculated based on the total dollar volume of all properties sold. Months Supply is the inventory of homes for sale at the end of a given month, divided by the average monthly closed sales from the last 12 months. Those requiring specific information on property values should contact a Waterloo Region REALTOR®. REALTORS® have their fingers on the pulse of the market. They know the questions to ask, the areas to probe and what to look for so that you get a complete picture of the property and community you’re considering.
ABOUT CORNERSTONE
Cornerstone Association of REALTORS® (Cornerstone) is a brand-new, novel association formed on July 1, 2024. Representing REALTORS® serving in the markets of Mississauga, Burlington, Hamilton, Waterloo Region, Niagara North, Haldimand County, Norfolk County and surrounding areas, it will become Ontario’s second-largest real estate board comprised of nearly 9,000 REALTORS®.
Established to better serve and represent REALTORS®, its vision is to establish a new, more influential, capable, and member-centric organization designed to meet the evolving needs of REALTORS® and help them thrive in the marketplace.
Cornerstone stands for transparency, honesty, and integrity. By taking a proactive stance toward the future and not being afraid to question some of the long-standing assumptions, Cornerstone offers a unique value proposition, paving the way for members’ brighter future.
We are Cornerstone. REALTORS® Together, Stronger Together.
More information at www.cornerstone.inc